ABSTRACT
A methodology has been developed to investigate the causes of fatigue fracture in the pressure-cast aluminium alloy Al Si9 Cu3 (Fe). Several samples have been tested. In each case porosity was the primary cause for failure. 3D tomographic images of the samples porosity at the initial state have been used as a basis for finite element analysis of the stress concentration around each pore above a minimal given size. Morphological assessment of the pores and Finite Element calculation allow investigating the correlations between, stress concentration and crack initiation. Results indicate that the pores causing failure have sizes located at the end-tail of the size distribution.
Introduction
Cast Al-Si alloys are widely used in the automotive industry to produce block engines, because of their high strength to weight ratio, their low processing cost and their ability to be cast in intricate shapes. However, this type of material contains microstructural defects resulting from the casting process such as porosity, oxides and metallic inclusions which strongly reduce the fatigue life and increase its variability. Close to the fatigue limit, previous studies have shown that fatigue crack nucleation occurs predominantly on pores (see for example [1]) which also have a detrimental effect on static mechanical properties. The volume fraction of porosity in a cast Al alloy typically ranges between 0.1 % and 25 % depending on the casting process used and the shape of the resulting product. A value as low as 1% (volume fraction) of porosity can lead to a reduction of 50% of the fatigue life and 20% of the fatigue limit compared with the same alloy with a similar microstructure but showing no pores [1].
To correlate fatigue properties of cast Al alloys to the presence of porosity, the fracture surfaces of broken fatigue samples have been extensively studied by Scanning Electron Microscopy (SEM), in order to identify which defect(s) is (are) responsible for crack initiation. One major drawback of this type of characterization, however, is that (in the best cases) it only reveals the weak link within the pore distribution. When the tail of the distributions matters, as it is the case in fatigue, comparisons with other samples therefore remain qualitative [2, 3] and statistical models are required to infer the actual pore population and to investigate its relationship with the fatigue life [4].
With the rapid development of X-ray microtomography in the last decade [5] this technique has being increasingly used for the characterization of cast materials because of its ability to provide fast and exhaustive information on porosity [6-10]. In this study, an Al-Si-Cu (A380) cast alloy has been tested in fatigue. SEM characterization of broken samples has been carried to determine the crack initiation sites. The 3D distribution of pores in the fatigue samples was determined by X-ray tomography. Finite element computations, based on the 3D tomographic images, have been used to estimate the stress level around pores taking into account their position in the sample, their size and their shape. Those results were used to investigate the ability of the pores to nucleate fatigue cracks.
Materials and methods
The studied material was a A380 alloy which composition is given in Table 1. The samples were produced by permanent mould casting in an industrial mold using a 630 tons Buhler machine. The metal was injected at 700 °C with a pressure of 800 bars. With an injection speed comprised between 40 and 50 m/s,the mold filling was completed in approximately 15 ms. The specimens were then machined in order to produce samples with a cylindrical gage length ( roughness< 0.8 ^m diameter 3.89mm and height ranging between 18 to 24 mm). The 0.2% Yield strength of the Al cast material was found to be 90 MPa and its tensile strength 150 MPa. A value of 70 MPa has been measured for the endurance limit (stair case method, R= -1) with some variation depending on the volume fraction of porosity in the material.
The fatigue tests presented here have been performed at room temperature at constant stress amplitude until failure. A stress ratio of 0.1 has been used in order to provide clearer evidences of crack initiation on the fracture surfaces. Three samples have been mistakenly cycled below the endurance limit for several millions of cycles, before getting tested at a correct level ie slightly above the fatigue limit (o-max ranging from 140 to 145 MPa). For this reason, the total fatigue life of the five samples has not be considered and the analysis has instead focused on the ability of a pore to initiate a fatigue crack.
Table 1 Chemical composition of the studied material.
|
Element Al |
Si |
Cu |
Zn |
Mg + Mn |
Others |
|
Composition o 0/ (weight %) 858 % |
8.9 % |
3.1% |
0.7 % |
0.2 % |
1.3% |
A laboratory tomograph was used for the 3D characterization of the fatigue samples[11]. For each tomographic scan,720 images were acquired (exposure time 0.5 s) with a voxel size of 5 ^m (a voxel is the 3D equivalent to the pixel for a 2D image). After reconstruction, a 16 bit image was obtained which was first down-sampled to 8 bits and further cropped to dimensions 850*850*1300 voxels (i.e. 6.5 mm in height). Depending on the sample, three or four scans were necessary to image the whole sample gage length.
Five samples have been exhaustively characterized in several steps (see Table 2 for a list). First a 3D image of the fatigue samples was obtained by tomography from which a statistical analysis of the pores was performed. The samples were subsequently cycled until fracture. Their fracture surfaces were characterized using SEM and a second tomographic image of the broken samples was recorded. From the 3D images a Finite Element (FE) model of a region surrounding the crack was generated allowing to study the stress level in this part of the sample. Image analysis of the stress concentration levels computed by the FE analysis was finally performed.
This last step consisted in trying to establish a correlation between the morphological and spatial parameters of the pores, stress concentration around them and the occurrence of crack initiation. For this purpose, the severity of the pores has been estimated by calculating the volume of the matrix stressed above the yield stress. As the FE analysis has been performed in the elastic framework, this quantity does not strictly correspond to a "micro-plastic zone" but rather refers to the influence zone of each pore. This pore influence zone has been analyzed following two approaches:
- The first one aimed at examining the links between the morphology of each pore and the size of its own influence zone, and is referred to hereafter as the pore-by-pore, analysis.
- The second one investigated the links between the local pore fraction (in slices perpendicular to the tensile axis) and the influence zone density in the same slices. It is referred to hereafter as the slice-by-slice analysis.
Table 2 Summary of the studied samples.
|
Sample |
36 |
164 |
C48 |
E29 |
F40 |
|
Pore volume fraction |
0.60 % |
0.62 % |
0.46 % |
0.57 % |
0.20 % |
|
Equivalent omax for R=-1 (MPa) |
40 and 90 |
85 |
80 |
40 and 85 |
80 and 85 |
|
Fatigue life (cycles) |
4.106 and 113 190 |
132 037 |
194 583 |
6.106 and 183 093 |
4.106 and 437 257 |
The Avizo software [12] was used to mesh the solid/air interface of the samples. This included the external shape of the specimen as well as the inner shape of the porosity. As each of the specimens contains a few thousands pores having a minimal volume of 403 ^m3, it was not possible to mesh a complete sample in a single pass. Due to computation limitations, the FE analysis was restricted to a sub-block of 2 mm in height. This sub volume was cropped from the initial block around the location of the crack.
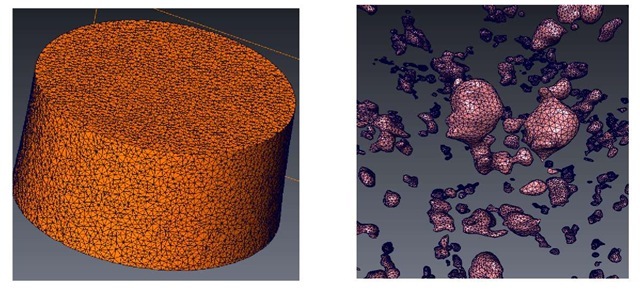
The generation of a 3D mesh in Avizo was performed by an advancing front strategy. The interfaces between the different phases of the model were first triangulated and used as seeds for the iterative generation of tetrahedral elements that eventually meshed the material completely. The number of initial 2D elements had a strong effect on the final number of tetrahedral elements and on the complexity of the subsequent simulation. The pore geometry being much more complex than that of the sample cylindrical surface, both types of interfaces had to be triangulated separately and the corresponding meshes were exported as two separate STL files (text-type format files), which were then concatenated into a single, global file. This later was used to generate the 3D mesh. The average number of triangles required to mesh the sample’s surface was about 15 000, whereas it varied between 100 000 and 800 000 for the pore surfaces. The number of 3D elements was further reduced by assigning them a target average size close to the dimensions of the 2D elements at the sample’s surface. The 3D mesh was thus reasonably refined around the pores and its number of elements ranged between 600 000 and 1 500 000 elements (Figure 1)
Fig. 1: 3D rendering of the mesh used for the mask surrounding the region of interest (left image:15000 elements ) and for the pores contained in this region (right image:181000 elements).
The FE calculation was performed using ABAQUS Standard. While an accurate simulation of the mechanical behavior of the material should have taken the cyclic plasticity into account, as a firs approach, an elastic calculation was carried out (E=70 GPa and v=0.3) in order to test whether such a simple approach could give a valid estimator for the severity of the pores. The computation was static. A monotonic, uniaxial displacement was imposed to the sample upper extremity, while the lower one was kept at a constant height (the nodes were nevertheless free to move laterally in the plane perpendicular to the loading direction). The value of the imposed displacement was fixed in order to match the maximal stress imposed during the fatigue tests.
The results of the FE calculation were converted into an 8bit volumetric image [13] where each of the 256 gray levels corresponded to a 3 to 5 MPa range, depending on the maximal value of the von Mises Stress calculated by the simulation. This image was then downsized to match the size of the initial tomography block containing the pores. The stress values were thus averaged on voxels of 5*5*5 ^m3.
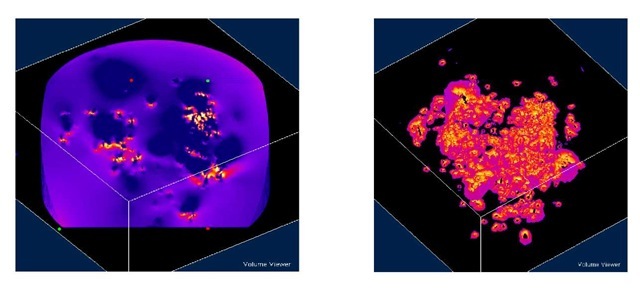
The statistical distribution of the stress within the meshed part of the material could be conveniently evaluated through the gray levels histogram of the 3D image. This histogram always showed some abnormally high values which were the result of numerical singularities at the vicinity of very tortuous pores. In order to avoid this problem the 3D images were binarized with a threshold value corresponding to the material 0.2 % yield stress (185MPa). The resulting block showed white regions surrounding the largest pores (Figure 2). These regions correspond to the pore influence zones. Each pore could thus be characterized by the volume of its own influence zone which was related to a micro-plastic region that was likely to develop at the immediate vicinity of the pore. Since the computation was elastic, the actual size of the highly loaded regions around the pores was probably slightly different from that obtained with the simulation. Still, this approximation had no consequence on the validity of the analysis, which relied uniquely on comparisons between parameters.
To complement the above described analysis, the influence zones of each individual pore were also averaged on each slice in order to obtain the distribution of influence zones density (surface fraction) along the sample axis.
Fig. 2: Left:3D rendering of the FE calculation (Von Mises stress) Right: same image after thresholding above the 0.2% yield stress.
Results and analysis
The analysis of the reconstructed 3D images provided an exhaustive description of the pores present in the samples in terms of volume, surface, sphericity, (ratio of the two former parameters), projected surface, distance to the surface, size of individual influence zone and surface fraction of influence zone in each slice. All those parameters could be used to try and establish correlations with the ability of a pore to initiate a crack as shown elsewhere [13]. Here we mainly focus on the last two parameters which reflect the propensity of a pore to generate local plasticity either individually or more globally in a slice of the sample perpendicular to the loading axis. It is worth recalling that the local stress level (which determines the influence zone sizes) implicitly takes into account all the above mentioned parameters.
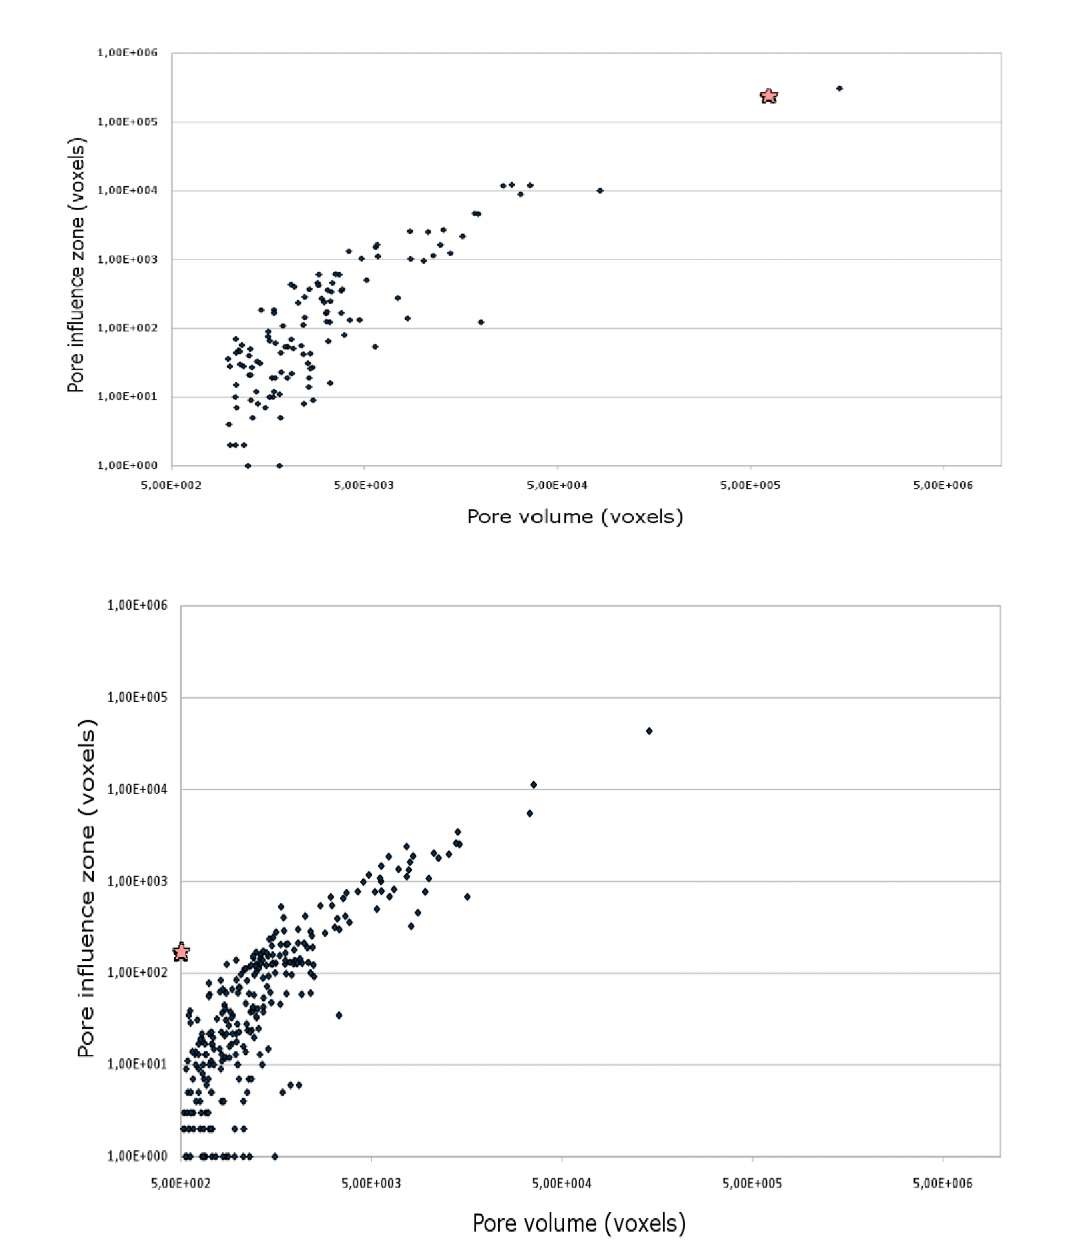
Figure 3. shows the volumes of the pore influence zones plotted against the volumes of the pores for two typical samples. As expected, large pores tend to induce large stress concentration. For four of the investigated samples the crack leading to failure was found to initiate at the largest pores (like in the case of sample 48). In the case of sample 36, however, the crack nucleates at a small pore which intersects the surface.
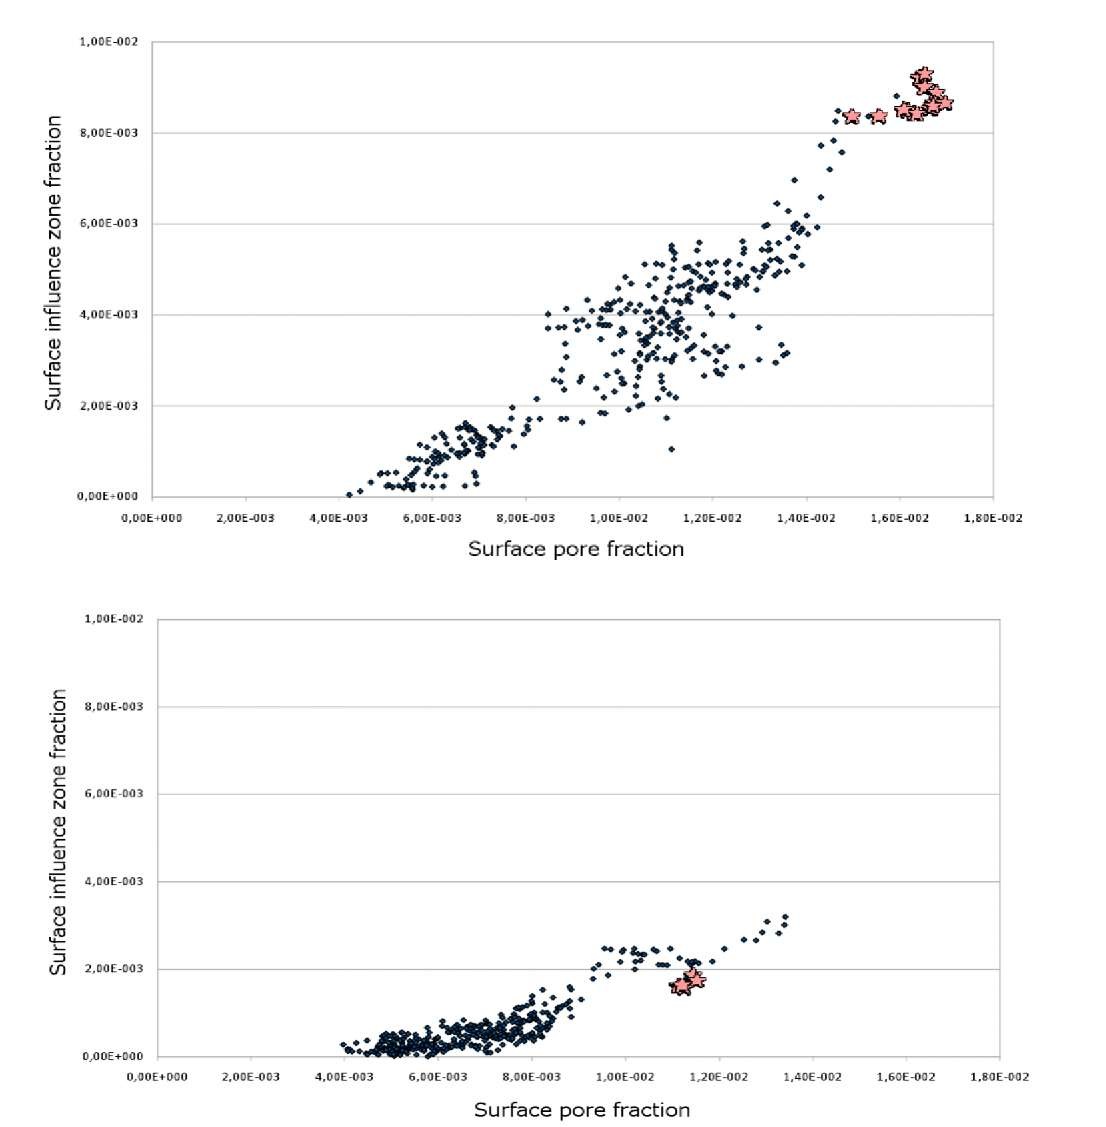
The slice-by-slice analysis leads to a similar conclusion as can be seen on Figure 4. On this figure, the surface fraction of matrix (on a surface perpendicular to the loading axis) with a stress higher than the yield stress has been plotted as a function of the fraction of pores for the same samples as those shown in Figure 3. Each point represents a slice of 5 ^m in thickness. As the location of the crack initiation could not be exactly determined by fractography or post failure tomography within the sample gage length, the pore leading to failure is shown by several marks.
Figure 4 shows that there is a correlation between the local densities of the pores and the density of highly stressed zones. This is the result of the sample being highly loaded in sections where the porosity was higher. Crack initiation seemed to occur in sections where the porosity was high, i.e. where the stress was high, with the exception of samples 164 and, to a less extent, F40 [13] The relationship between the pore influence volume / surface fraction and the event of crack initiation varied according to the sample, as is qualitatively summarized in Table 3. For each sample analysed, the "quality of correlation" relates to the position of the initiating pore within the relevant distribution.
Fig. 3: Plots of the pore influence zone size as a function of pore volume for samples 48 (top) and 36 (bottom).Pore by pore analysis. Stars indicate the initiating pore.
In samples C48, E29 and F40, the crack initiated at a pore which had a wide influence zone and a large volume, i.e. which was located at the tail of both the influence zone and the volume distributions. In these cases, the elastic calculation seems to be accurate enough to predict the location of crack initiation. The same can be said for the slice-by-slice analysis of samples 36, C48, E29 and to a lesser extent F40: The crack nucleated at a position rich in pores and showing a high density of influence zones. In other words, in these samples crack initiation occured at a local maximum of the pore density.
A poor correlation was found for sample 164 which did not comply with any of the analyses: this sample failed at a small pore with a modest influence zone, albeit located near the surface. These results outline the importance of the pore size distribution and spatial repartition for crack initiation. Indeed, the samples for which both analyses yield satisfying results are those in which the spatial repartition is markedly heterogeneous. Conversely, the samples 164 and F40 were characterized by a rather flat distribution along the principal axis [13]. Interestingly, in sample 36, the crack initiates at a small pore which intersected the sample surface, the influence zone volume was moderate, yet considerably higher than that of internal pores of comparable size (Figure 3). In this case, the pore-by-pore analysis was not fully satisfying. As a whole the proposed methodology allowed to identify the most probable zones for fatigue failure when the pore distribution was spatially heterogeneous. These critical zones were those of high porosity, and were directly related to a high density of stressed matrix.
Fig. 4: Results of the slice-by-slice analysis. Plots of the density of influence zones against surface fraction of pores along the axis of samples 48 (top) and 36 (bottom). The approximate location of the crack starting point is marked by stars.
Table 3 .Correlation between the occurrence of crack initiation and the influence zone of the pores considered either individually or slice by slice. Symbols used for indicating the correlation quality: -• bad, * poor, **: good, ***: excellent
|
Sample |
36 |
164 |
C48 |
E29 |
F40 |
|
Pore influence volume |
- |
* |
*** |
*** |
*** |
|
Pore influence density |
** |
- |
*** |
*** |
** |
|
Crack initiation site |
Pore intersecting the surface |
Internal pore |
Internal pore |
Internal pore |
Internal pore |
Conclusion
A partly automated treatment has been developed to analyse the causes for fatigue failure in cast aluminum samples containing porosity. It relies on the 3D characterization by micro-tomography of the pores, used as an input for finite element analysis. A careful methodology for generating a refined mesh has been developed,. The proposed methodologyi s based on the conversion of 3D images of the microstructure in FE data and of FE computation results into a 3D image again. This last step proves to be a fast, easy and reliable method for post-processing the results with powerful techniques from the image analysis field
The pore influence zone is proposed as a variable that represents the volume of matrix stressed above the yield stress. It has been treated on an individual, pore-by-pore basis, and on a local, slice-by-slice basis. On average, both give satisfying results for samples with a heterogeneous porosity and predict that cracks nucleate at regions with a high local porosity.


