Abstract
Carbon foams are refractory cellular materials. The material exhibits an open porosity with a tridimensional architecture offering multifunctional properties. These properties can ever be tailored threw post processing in order to use the material in many fields such as energy (fuel cell) or transport (shock absorber).
For all applications, the knowledge of the mechanical properties is important. These properties depend on the 3D architecture and the damage kinetics. In this study the computed X-Ray microtomography (^CT) has been used firstly to analyze the damage kinetics during in-situ compression tests and secondly to simulate the behavior. The ^CT compression tests lead to the local damages and global deformations. The analyses of these images will be presented to illustrate the potentiality of tomographic investigations for brittle cellular materials. To assess both the stress and strain fields, a model based on the real material was developed. This model consists in meshing the tridimensional images and modeling the behavior of the constitutive material. The fracture of cells is treated using an adapted law and a brittle criterion. The models are also compared with the measured macroscopic mechanical behavior or adapted to simulate numerically-generated materials.
Introduction
Ceramic foams are cellular materials which are used in industry in particular for their attractive mechanical properties coupled with other functionalities. Thermal insulation, acoustical absorption properties, low density with large specific surface and electrical conductivity are some examples of these properties [1-2-3]. The main industrial sectors are packaging (as shock absorbers), filtering (through the open cell) or energy (fuel cells). Although the main reason to select this material is not always its mechanical properties, they need to be known and must be understood in regards with the parameters of the 3D structure.
The ceramic foams studied were manufactured at the LCTS using vitreous carbon preform provided by the CEA – Le Ripault [1-2]. This material is composed of a solid 3D arrangement of struts and edges delimitating open cells. The solid phase is glassy carbon and the resulting material combines its properties (thermal stability, high strength…) with the properties of the cellular structure (low density, high specific surface, open porosity). The material is macroscopically ductile while the vitreous carbon itself is brittle. This surprising behavior is explained by the 3D structure and its damage kinetics.
Macroscopic compression tests were carried on foams having different pore sizes and relative densities by S.Delettrez [1-2]. The results of these tests are not in accordance with the theory of Gibson and Ashby [1-3]. One hypothesis to explain this difference is that the 3D structure of the material is far from the one considered by Gibson and Ashby [3]. In particular one can not define a simple unite cell, the material being rather random.
This random 3D structure must be characterized to better understand the mechanical properties. Probably the better way to do is using micro-computed X-Ray tomography (^CT). Firstly the mechanical properties and damage kinetics are analyzed using a compression test coupled with tomography. These observations are necessary to understand the damaged mechanisms responsible of the macroscopic behavior. In addition it would be useful to measure further informations, such as the strain and stress fields in the material. The choice of calculating these data directly using the ^CT images will be presented in this paper. This method based on finite element modeling is not a direct experimental measurement but is derived from the images of the real microstructure.
Material and Methods
Materials
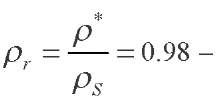
The material was produced using highly porous vitreous carbon foam (relative density
with p* the apparent density of the foam and pS the density of the constitutive material). This preform was produced from the pyrolysis of a polymer foam. Fig. 1-a and Fig. 1-b presents two secondary electron microscope (SEM) pictures respectively at low and high magnification of the porous vitreous carbon foam. Unfortunately this foam does not have sufficient mechanical and corrosive strength for shock absorber or fuel cell applications. the foam was thus densified by vapour deposition with pyrocarbon (PyC) or silicon carbide (SiC) using respectively propane and methiltrichlorosilane/hydrogen (MTS/H2) precursor [1-2-4-5] (Fig. 1-c). The deposition time was adjusted to obtain the desired thickness and thus the desired relative density. The final material is an open foam characterised by its relative density pr and the number of pores per inch (ppi). In this paper only a PyC densified foam was analysed with a relative density and a cell size of 0.14 and 60 ppi respectively.
Fig. 1 : MEB pictures of he foam. (a) Magnification x50 to illustrate the mesoscopic morphology of the non densified foam. (b) and (c) Magnification x500 to illustrate the microscopic morphology of a ligament respectively before and after densification.
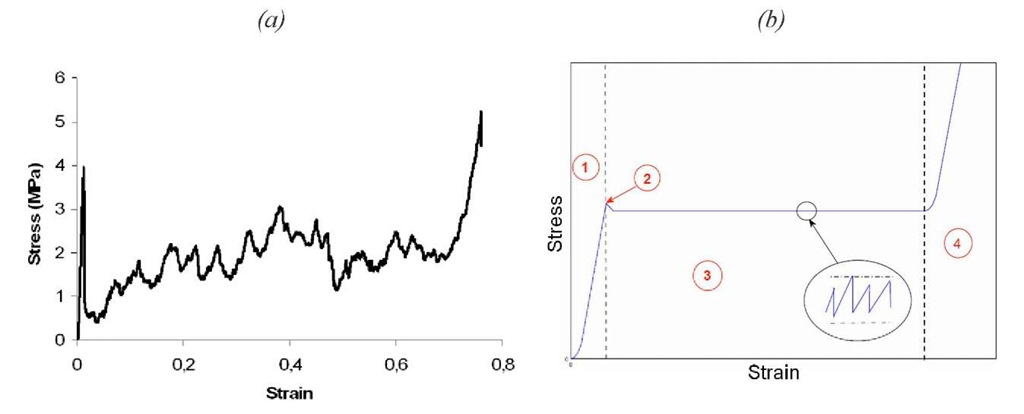
Fig. 2-a presents the stress/strain compression behavior of a 60 ppi foam densified with PyC up to a relative density of 0.14. The sample was placed between two plates. The superior plate is mobile and controlled in displacement. The device records the load (F) and displacement (l-l0), the stress
and the true strain
being calculated using S0 as the initial surface (S0=78.5 mm2) and l0 the initial length of the sample (lo=10mm). This curve is in good agreement with the standard compression behavior of foams [3], as presented on Fig. 2-b. The different domains are highlighted with numbers. Firstly (1) the material exhibits a pseudo elastic behavior, in this part of the curve, or during unloading, the Young’s modulus is measured. The value is about 320 MPa. Then a crack appears and the load decreases (2) to reach a stable value often named the plateau (3). In this part the load is almost constant with some fluctuations around an average value. These perturbations are generally attributed to successive brittle failures corresponding to individual pores crushing. The average stress value of the plateau (cpl -estimated by an average of the values in this domain) is about 2 MPa, the plateau appearing for a strain higher than about 0.02 in the present case. In this domain the material seems to be ductile although the constitutive material is fragile. (4) When all the open porosity is filled a densification state is observed. Here the densification appears for a strain of 0.7.
Fig. 2 : Stress/Strain compression behavior of the foam. (a) Compression test done on a foam with relative density of 14 % and a cell size of 60 PPi, densified with PyC. (b) Scheme reporting the different domains of the curve.
To model the ceramic foams Gibson and Ashby [3] have proposed cell models based on elementary cells. They have derived analytical expressions of the Young’s modulus and of the plateau stress. None of these models gives the values measured by [1]. These differences between the experimental and calculated values of the foam’s mechanical properties are probably due to a too simple model. In the Gibson and Ashby model [3], the elementary cell is simply repeated avoiding localization problems. The fact that damage kinetics and the local stress and strain fields are not taken into account in the material could probably explain the differences. A local image analysis during insitu compression test has been used to obtain more information on these points.
Methods
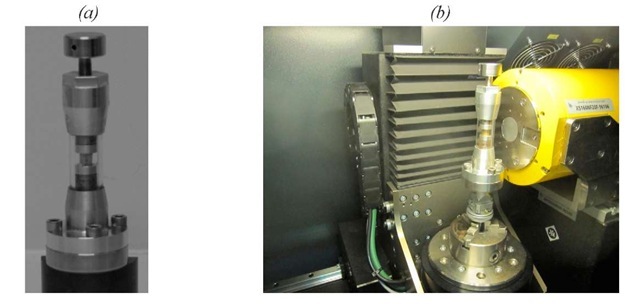
X-ray tomography [6] is well-suited to study cellular materials and especially the development of damage [7-89-10]. To scan the material, we used a standard microtomograph from TOMOMAT in Pessac (Nanotom -Phoenix/Xray – see Fig. 3-b) with a voxel size of 6 microns. The tomograph was operated with a Molybden target at 50 keV and 500 ^A with an Aluminium filter of 0.2 mm.
Compression tests with constant strain were conducted on a specially-designed machine for in-situ compression measurements. The insitu compression device is presented on Fig. 3. Main features are: 1- A quartz pipe which can allow the X-ray to go thought and the visual check of the installation. 2- A manual mechanical actuator using a micrometric screw system for fine displacements. 3- A bearing ball, placed between the screw and the superior plate, avoiding moment transmission to the sample. Foam cylinders (10 mm of diameter and 10 mm length) are analysed at a voxel size of 6^m, resulting in images of about 1600x1600x1600 voxels. The strain is controlled knowing the screw thread (0.5 mm/tr). Eight ^CT scans were performed at increasing strained states, the first one corresponding to the initial undeformed state. The true strain
was calculated from the screw thread and confirmed by ^CT image analysis.
Fig. 3 : pictures of the insitu compression device used to apply the load to the foam samples installed in the micro-tomograph. (a) Close visualisation of the compression device – the sample is inside the transparent pipe. (b) Compression load cell placed in the laboratory microtomograph – on the right the nanotom Phoenix Xray tube.
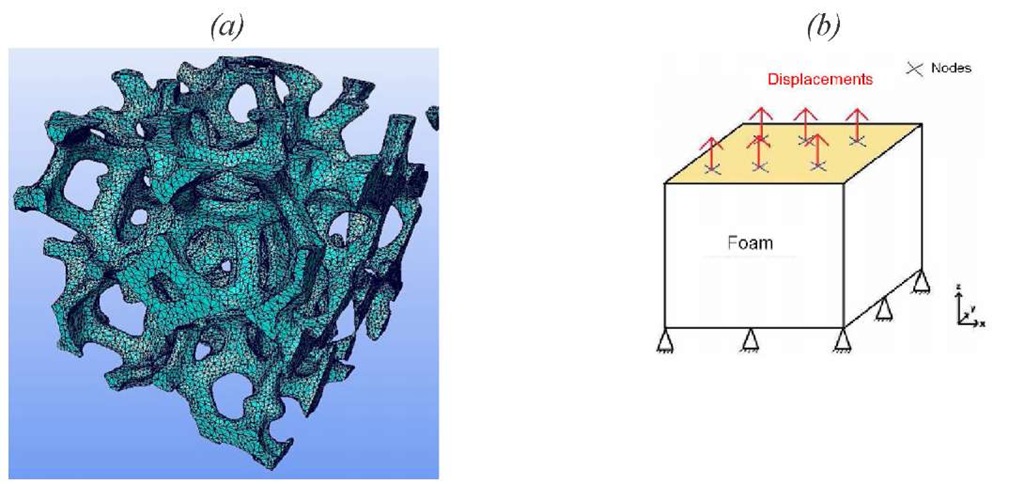
The solution adopted to determine the stress and strain fields in the foam is a meshing of the ^CT images with tetrahedral elements and a finite element calculation ([12] and [13]). The 3D image of the foam was meshed with Avizo software [11] The meshing is done in three steps; the surface is first reconstructed using triangles by a marching cubes algorithm [14], [15]; the meshed surface is then simplified to reduce the number of triangles -this is achieved through an edge collapsing algorithm [16]; finally, the tetrahedral mesh is built by an advancing front algorithm [17]. The ^CT images of the sample foams being too large to be meshed directly. The image was cropped into a 300x300x300 voxels image (1.8×1.8×1.8 mm3) to get a sub-sample of the foam. The choice of the boundary conditions is very important. We decided to unconstrain the lateral faces, completely constrain the lower face in displacement, and impose a displacement along the compression direction (z direction) on the upper face, the displacements in the perpendicular plane (x and y directions) being blocked on this face (a scheme of the boundary conditions is presented on Fig. 4-b). A parallel study of the modeling of the foam was also executed to determine the ideal parameters of the mesh (convergence study – about 300 000 elements), the constitutive laws (elastic brittle law – E=35 GPa – cy = 300 MPa) for the PyC and the minimum size of sample to be representative. A mesh of the foam is presented on Fig. 4-a.
Fig. 4 : (a) mesh of a 3D T image of the foam. (b) Scheme of the boundary conditions applied to the mesh.
Results
Damages in the foam were observed at the nine states of compression acquired by ^CT. First, the analysis of the global deformations/damages was carried out by observing the outer surface of the foam. These observations were done by choosing the adapted angle of view to see the failure and using a voltex rendering to visualize the foam in 3D (voltex rendering is a function of the Avizo software – see [11] for details). This angle of view is crucial to well analyze the failure and would be hard to be found without the use of in-situ ^CT. On Fig.5, three states of deformation are presented – at the initial state (Fig.5-a) – at 6% of strain (Fig.5-b) and at 15 % of strain (Fig.5-c). As indicated by the arrows a macroscopic failure is visible in the middle of the foam. This failure actually consists in a series of individual failures of the ligaments of the cells, these individual failures being connected in a plane presenting an angle at about 30° to 45° with the loading direction (the loading direction is vertical on these pictures).
Fig. 5 : T in-situ compression test on a ceramic foam with a relative density of 0.14. Observation of the external surface using a voltex rendering [11]. 3 states of deformation: (a) Initial state, (b) 6% strain -arrows indicate the initiation of failure (c) 15% strain – Arrows indicate the evolution of damage.
In a second study we have exploited one of the main assets of CT : the possibility to visualize the local damages inside the material. These observations were made at different places in the material. The recognition of the different zones on the 3D images of the foam is difficult and was made easier following particular cells or defects. A major failure mode was evidenced in this study, an example being presented on Fig.6. This figure compares the initial state and a damaged state of the same ligament’s cell. As highlighted by the arrows, the failure appears at both ends of a ligament. It is a fragile failure with no plastic deformation.
Fig. 6 : Local analysis of a ^T in-situ compression test on a ceramic foam with a relative density of 0.14. Visualisation of a ligament inside the foam using a voltex rendering [11]. Arrows indicate the fracture, numbers are visual marks to highlight the bounds.
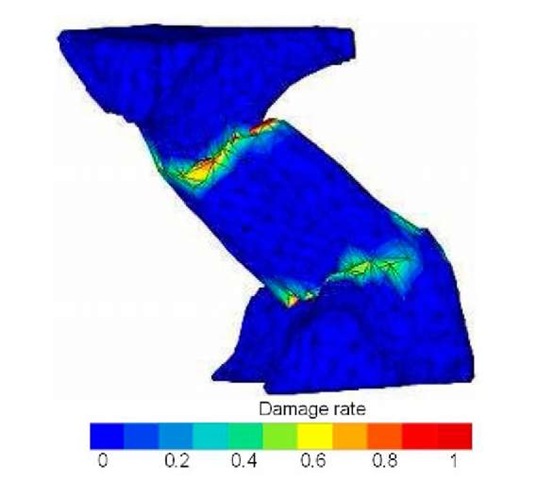
The local behavior observed above by CT analysis is also observable on the measurement of damage in an isolated ligament. Fig. 7 presents a ligament randomly chosen in the foam with no particular orientation and position. The measures of damage clearly show that the damage concentrates at both ends of the ligament where the thickness of the ligaments changes. This stress concentration zone is also a weak point and the weakness of these ligaments initiates the damage in the foam. Thus if one wanted to simulate the damaging behavior of the foam without taken into account the real microstructure, these singular points in the structure would be missed, leading probably to an erroneous behavior.
Fig. 7 : Calculation of the damage rate field inside a ligament. A 0 damage rate is a material without damage and 1 is a failed material.
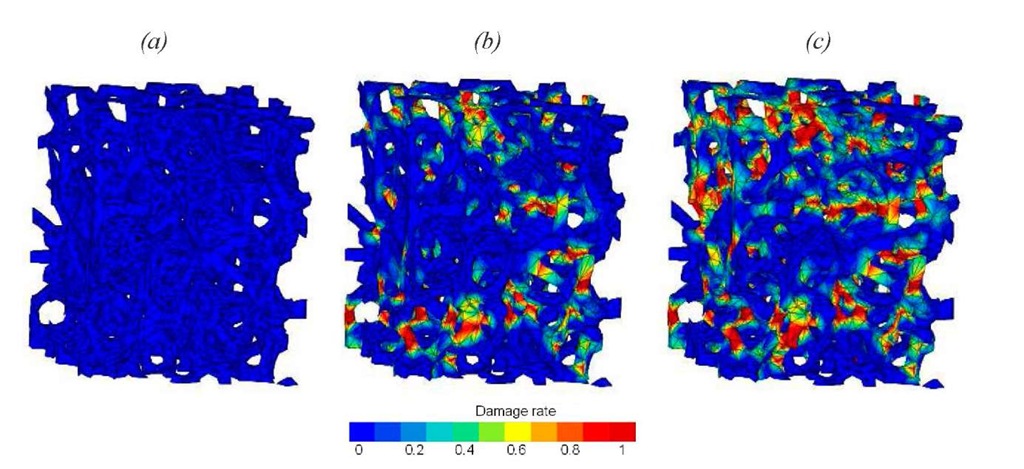
When the first failures appear on both ends of the ligament, the load is transmitted to the neighbouring ligaments. This creates particular development of the damage. This organisation is well illustrated on Fig.8, where the damage rate in a rather large part of the sample is shown. On Fig.8-b, a damage band orientated at about 30° with the loading direction appears. The damage appears in the ligaments and propagates throughout the structure. When the damage in this band is saturated, other local failures appear (Fig.8-c). These subsequent failures are often organized in smaller bands.
Fig. 8 : Damage rate field inside the cellular structure. FE calculations of different states of compression corresponding to states ref. 1, 2 and 3 in the in-situ ^T observations. (a) Initial state. (b) 3% strain. (c) 6% strain.
Discussion
As explained in the results section, a failure was observed at 30° to 45° with respect to the loading direction on Fig.5. We can make an analogy with ductile metallic materials were failure is often observed at 45°. This angle corresponds to the maximum sheered plane in the sample. Thus, the failure has a quasi-ductile character whereas the constitutive material is intrinsically fragile. This is in good agreement with the macroscopic behavior, as shown on Fig.2-a.
In the measure of damage by FE calculation on the structure presented on Fig.8, the failure seems to propagate in a plane oriented at 30°. This plane is not exactly the same as the one described on Fig. 5. Another difference is the presence of local damages in the calculations of Fig. 8. These isolated damages are not observable during experimental investigations of Fig. 5. These differences are probably explained by the difference in the size considered during the experimental tests. Here appears the problem of the representative size. The size of foam used for calculation is probably too small to be representative of the experimental test. Another question appears: the boundary conditions applied were chosen uniformly. This condition is obviously not effective in a foam extracted in the middle of the sample tested. We have chosen these conditions for simplification reasons and because we have estimated that these conditions are rather close to the real ones. Further investigations are needed to validate this choice. A solution would be to apply the displacement directly measured on the ^CT images.
The comparison of Fig.6 and Fig.7 reveals that the stress/damage concentration zones correspond to the failure zones. Most loaded ligaments are generally broken at their ends as illustrated on Fig.6. These zones are indeed the most stressed/damaged regions in the FE calculation (Fig.7).
The final goal of these investigations was to better understand the macroscopic mechanical behavior. The fractures in bands observed explain the perturbations in the plateau domain described in the material section. These perturbations are also well simulated by the model presented. Then, in order to optimize the material, the model is a useful tool. It is rather easy to adjust parameters such as the dimensions, the volume fraction or the constitutive material properties to find the material adapted to a specific application.
Conclusion
Using CT technique, it is possible to visualize the inside of the materials at high resolution. These investigations can also be carried out insitu during mechanical loading. Using the 3D images, it is also possible to calculate several fields like stress, strain or damage. All these microscopic data are very important to understand the macroscopic mechanical behavior. In the case of cellular materials (like the PyC densified porous vitreous carbon foams presented here), these investigations are rather easy. The information obtained is crucial to optimize or understand mechanical behaviour.
Another important benefit of these calculations using meshed ^CT images is the relevance of the simulated behaviour compared with classical models like those presented in [3]. This benefit is explained by local damages linked to local defects. These defects are singular points that must be considered to simulate the effective mechanical behaviour of such brittle materials. Unfortunately these calculations are heavy. In this study, we have chosen to use only one part of the sample. This choice may be a problem, as explained in the discussion section. A solution would be to use the entire sample for calculations using more powerful computers, or to improve the calculation efficiency.
Another improvement would be on the experimental set-up used for in-situ compression tests. A new loading device is under development at the ICMCB in Pessac. This new insitu device is adapted for accurate and small displacements. The main difficulty in the development of such a device is the lack of room available in the laboratory tomograph and the necessity to be X-ray transparent throughout a 360° rotation. Finally, to improve the test and the resolution of 3D images in particular, a solution would be to use a synchrotron like the ESRF in Grenoble [18].



![T in-situ compression test on a ceramic foam with a relative density of 0.14. Observation of the external surface using a voltex rendering [11]. 3 states of deformation: (a) Initial state, (b) 6% strain -arrows indicate the initiation of failure (c) 15% strain - Arrows indicate the evolution of damage. T in-situ compression test on a ceramic foam with a relative density of 0.14. Observation of the external surface using a voltex rendering [11]. 3 states of deformation: (a) Initial state, (b) 6% strain -arrows indicate the initiation of failure (c) 15% strain - Arrows indicate the evolution of damage.](http://what-when-how.com/wp-content/uploads/2011/07/tmp1168_thumb_thumb.jpg)
![Local analysis of a ^T in-situ compression test on a ceramic foam with a relative density of 0.14. Visualisation of a ligament inside the foam using a voltex rendering [11]. Arrows indicate the fracture, numbers are visual marks to highlight the bounds. Local analysis of a ^T in-situ compression test on a ceramic foam with a relative density of 0.14. Visualisation of a ligament inside the foam using a voltex rendering [11]. Arrows indicate the fracture, numbers are visual marks to highlight the bounds.](http://what-when-how.com/wp-content/uploads/2011/07/tmp1169_thumb_thumb.jpg)
