ABSTRACT
3D structures of bulk alloys and nanoparticles have been studied by means of electron tomography using scanning transmission electron microscopy (STEM). In the case of nanoparticles of Fe-Pd alloy, particle size, shape, and locations were reconstructed by weighted backprojection (WBP), as well as by simultaneous iterative reconstruction technique (SIRT). We have also estimated the particle size by simple extrapolation of tilt-series original data sets, which proved to be quite powerful. We demonstrate that WBP yields a better estimation of the particle size in the z direction than SIRT does, while the latter algorithm is superior to the former from the viewpoints of surface roughness and dot-like artifacts. In contrast, SIRT gives a better result than WBP for the reconstruction of plate-like precipitates in Mg-Dy-Nd alloys, in respect of the plate thickness perpendicular to the z direction. We also show our recent results on the 3D-tomographic observations of microstructures in Ti-V-Al, Ti-Nb, Cu-Ag, and Co-Ni-Cr-Mo alloys obtained by STEM tomography.
Introduction
Our understanding on the microstructure in metals and alloys has been advanced with the progress of transmission electron microscopy (TEM) and electron diffraction. Thus, for example in the fifties, dislocation theories were directly confirmed by electron imaging based on the diffraction contrasts [1]. This technique immediately found enormous areas of applications in materials science, and utilized for instance to clarify the phase transformation behavior in a number of alloy systems. Other applications of TEM include of course high-resolution transmission electron microscopy (HRTEM) and scanning transmission electron microscopy (STEM) [2]. The images obtained by these techniques are projections of three dimensional (3D) objects; and in order to better understand the nature of phase transformation behavior, for example, a direct 3D observation is much needed. In this respect, recent advance in 3D-tomography (x-ray, electron, and atom probe tomography) has opened a new prospect. Electron tomography, especially its applications to materials science, is a novel technique, which can retrieve 3D structural information usually missing in TEM and STEM. A 3D structure can be reconstructed by processing a tilt-series of electron micrographs with mass-thickness contrasts, formed by several different imaging techniques: bright-field (BF) TEM [3], dark-field (DF) TEM [4, 5], atomic number (Z) contrast of STEM [6], energy-filtered TEM [6] and electron holography [7]. The recent progress in this field has been summarized in review articles [8, 9]. In all the techniques, acquisition of clear contrast images and accurate alignments of the tilt axis are essential for subsequent 3D reconstruction. Some model simulations on the accuracy of reconstruction have been presented in detail [6]. An investigation for a novel method to quantify 3D reconstructed structures is one of the fundamental interests in the electron tomography [10-13]. Here, we report some of our recent studies on magnetic nanoparticles and bulk alloys, where electron tomography has played an important role in identifying the 3D structures and spatial distribution of nanocrystals, dislocations, and precipitates.
Experimental Procedures
We employed BF and high-angle annular dark-field (HAADF) imaging modes of STEM for the tilt-series acquisition using an FEI Titan 80-300 (S)TEM operating at 300 kV with a field emission gun. We set the beam convergence to be 10-14mrad in half-angle, taking into account the spherical aberration coefficient (1.2 mm) of the pre-field of objective lens. The Xplore3D software (FEI Co. Ltd) was used for data sets acquisition taking the dynamic focus into consideration. A single-tilt holder (Fischione model 2020) and a triple-axes holder (Mel-Build model HATA-8075) were used for the tilt series acquisition with the maximum tilt angle of 70°. Alignment of the tilt axis for the obtained data set by an iterative cross-correlation technique and subsequent 3D reconstruction were performed by using the Inspect3D software package (FEI Co. Ltd). As for the algorithm for 3D reconstruction, we employed weighted back-projection (WBP) [14], as well as simultaneous iterative reconstruction technique (SIRT) [15]. The reconstructed 3D density data were then visualized using the AMIRA 4.1 software (VISAGE IMAGING).
Results and Discussion
Shapes and distribution of FePd nanoparticles
Figure 1a shows a series of STEM-HAADF images taken at different tilt angles with the detector inner half angle of 60mrad. The tilt-series was observed sequentially from 0 to -70° and then 0 to +70 °. The tilt angle increments were set 2° for angle ranges of 0 to |50|°, and 1° for |50| to |70|°. Out of this data set, we employed, by careful inspection of contrasts, images taken at tilt angles between -66 and +64° for later 3D reconstruction. As seen, the apparent particle length in the y-direction becomes shorter as the tilting angle increases. A nanoparticle enclosed by the circle in the figure is one of the examples to demonstrate the reduction of the particle image in the y-direction. To examine an accuracy of a reconstructed particle height in the z-direction, we therefore measured projected particle length in the y-direction as a function of tilt-angle, and deduced the particle height by extrapolating the projected length to the value expected at the tilt-angle of 90°. The results are plotted in Fig.1b. The projected length clearly decreases with tilting, which indicates that the particle height is actually shorter than the in-plane diameter. Here, the extrapolation was performed by fitting the data points at angles higher than 40° using cosine of the tilt angle (a), because of the fact that the projected y-length is proportional to cosa at high angles when the particle height is shorter than the diameter.
Using the aforementioned procedure, here termed "tilt-series extrapolation (TSE) method", we obtained a relation, which summarizes the relation between particle diameter and thickness estimated by using several different techniques (Fig.2a). Solid triangles and solid squares indicate the results obtained from the reconstructed images based on SIRT and WBP, respectively. In the present study, 20 iterations were carried out in SIRT to minimize the differences between the original projected series and the calculated ones. The large error bar for WBP indicates a possible elongation of dz = 4.1 nm [13]. Therefore, we divided the apparent particle thickness (tz), which was deduced from the 3D volumes based on WBP, by the elongation factor (eyz=1.42) [12] for the present experimental condition. The results, tz / eyz, are indicated by open squares. Solid circles denote the deduced particle thickness measured from the TSE method. A solid curve indicates the previous result based on the electron holography [16]. Note that the deduced thicknesses obtained by the TSE agree well with those obtained by WBP (tz / eyz) as well as those by electron holography. On the other hand, the thicknesses suggested by SIRT are much larger than the values deduced by the TSE method or electron holography. The apparent thickness predicted by WBP (tz) is close to the deduced values with an error of about 1-4 nm in thickness, without taking the elongation factor into consideration. Therefore, within a framework of single-axis tilt geometry, it is demonstrated in a semi-quantitative manner that the WBP gives a better result in terms of the accuracy of the particle length in the z-direction than that predicted by SIRT, despite the fact that the latter algorithm is superior to the former from the viewpoints of artifacts.
Fig. 1 (a) A series of Z-contrast images taken at different tilt angles. (b) The analyzed particle length in the y-direction as a function of the tilt-angle. The particle length decreases as the tilt-angle increases towards 90°, indicating the fact that the particle height is shorter than the diameter. Extrapolation of particle length in the y-direction to the value expected at the tilt-angle a = 90° leads to an elucidation of the true particle height. Here, the extrapolation was performed by fitting the data points at angles higher than 40° using cosine of the tilt angle [13].
Fig. 2 (a) The relation between particle diameter and thickness (height) for the FePd nanoparticles estimated by using several different techniques. (b) Oblique-view of the reconstructed volume processed by SIRT (upper) and (c) WBP (lower). Large discrepancy in particle thickness (height) is apparent. The reconstructed volume is 75 x 75 x 36 nm3 [13].
The difference in the particle height of the reconstructed results is pronounced when viewed from an oblique direction as shown in Fig.2b. Indeed SIRT gave particle heights, which are almost comparable to or even longer than the particle diameter (Fig.2b), while rather flat 3D shapes can be seen in the result by WBP (Fig.2c). Nanoparticles in the upper image (SIRT) show prolate 3D-shapes, i.e., elongated in the z-direction. The reason for this artifact is not clear at this moment. To reduce the artifacts, a minimization of the missing wedge will be most effective, which can be attained by increasing the maximum tilt-angle together with number of 2D-slice images as possible. Using the same experimental setup, recently we succeeded in reconstructing double-layer of 2nm-sized CoPt nanoparticles separated by a thin amorphous carbon film [18].
Phase separation in Ti-V-Al alloy
We have examined 3D morphology of a (hcp) and p (bcc) dual phase structure of a Ti-12mass%V-2mass%Al alloy after aging for 24 h at 500oC by means of STEM-HAADF tomography. In the present study, we set the inner half angle of the HAADF detector to be 30mrad to ensure a clear contrast during the tilt-series acquisition. This setting of a rather low angle may break the simple Z2 dependence of the HAADF-STEM images to some extent due to possible diffraction contrasts during the tilting. The tilt-series was obtained sequentially from 0 to -70° and then 0 to +70°. The angular tilt angle increments were set 2°. Out of this data set, we employed images taken at tilt angles between -62 and +62° for subsequent 3D reconstruction. Figure 3 shows one of the original images (Fig.3a) and corresponding reconstructed images processed by WBP (Fig.3b). Here, the x-axis is the tilt-axis, about which the specimen film is sequentially tilted towards the y-direction; while the primary beam incidence direction is parallel to the z-axis. Bright contrast region corresponds to the precipitated V-rich p phase (<40mass%V). A bird-view of the reconstructed volume is shown in Fig. 3c. The plate-like 3D shapes of p phase, precipitated by decomposition of hexagonal a’ martensites, has been successfully reconstructed. As seen in these images, general features projected onto the x-y plane, such as plate-like shape, size, and the location of precipitates, are clearly reconstructed. However, it is noted that floating dot-like artifacts are seen in the reconstructed volume, which can be attributed to a low signal to noise ratio and diffraction effects of the original tilt series STEM images.
Fig.3 3D distribution of the p phase in Ti-12mass%V-2mass%Al after annealing for 24 h at 500oC [19]. (a) An original STEM-HAADF image. Bright regions correspond to the V-rich p phase. (b) Reconstructed images processed by WBP. (c) A bird-view of the reconstructed volume (690 x 720 x 375nm3). Plate-like structures correspond to the p precipitates.
Dislocations in a Ti-Nb alloy
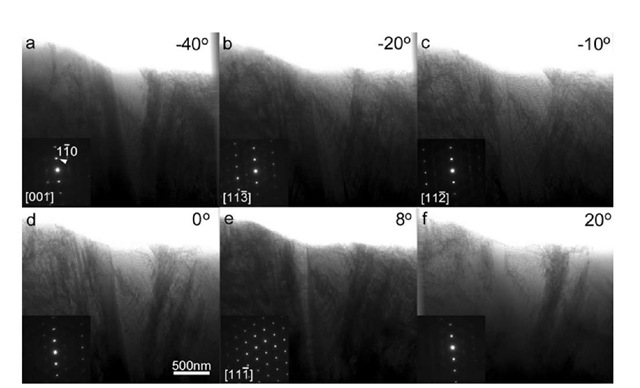
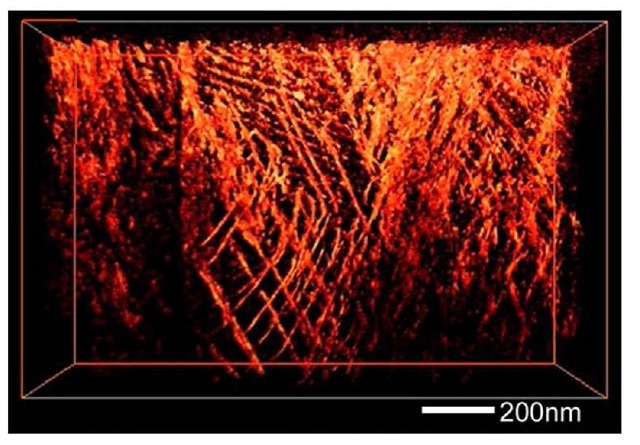
Figure 4 shows STEM-BF images of an as-quenched Ti-35mass%Nb alloy acquired during a tilt-series observation. The alloy composed of acicular orthorhombic a" martensites and bcc P phase [20]. In this observation, hh0 systematic reflections of the P phase (bcc) was set parallel to the tilt-axis of the triple-axes holder. As seen in the corresponding diffraction patterns, 110 reflection of the P phase is always excited during the tilt-series observation. The tilt-series was obtained sequentially from 0 to -70° and then 0 to +70° with the angular tilt angle increments of 2°. The reconstruction was carried out by WBP using 71 images. Figure 5 shows a snapshot of reconstructed image of dislocations observed in the P phase region. It is presumed that origin of these dislocations in the P phase can be attributed to the p-a" martensitic transformation at quenching. Detailed characterization of these dislocation structures is now in progress.
Fig.4 STEM-BF images of an as-quenched Ti-35mass%Nb alloy acquired during a tilt-series observation (after tilt-axis correction). Corresponding diffraction patterns are shown in the inset, showing excitation of hh0 systematic row.
Fig.5 Reconstructed 3D image of dislocations in an as-quenched Ti-35mass%Nb alloy processed by WBP from the tilt series of STEM-BF images in Fig.4.
Precipitates in Cu-Ag, Mg-Dy-Nd, and Co-Ni-Cr-Mo alloys
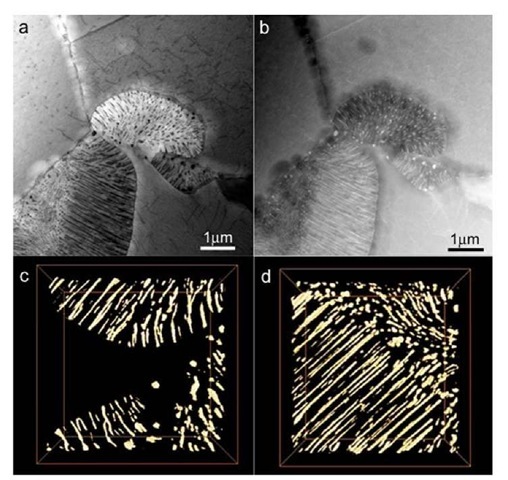
Figure 6a and 6b show STEM-BF and HAADF images of a Cu-4at%Ag alloy aged at 450oC for 20min, respectively [21]. Discontinuous precipitation of Ag at grain boundary regions is clearly seen. Figure 6c and 6d are snapshots of reconstructed images of Ag precipitates processed by SIRT. The reconstruction was carried out using 70 individual images. As can be seen in these snapshots, the precipitates possess a "flat" rod shape, i.e., the cross-section of the rods are not circular but elliptic. We found that the aspect ratio or the ellipticity is more than two, the origin of which is still under question.
Fig.6 STEM-BF (a) and HAADF (b) images of a Cu-4at%Ag alloy aged at 450oC for 20min, showing discontinuous precipitation of Ag at grain boundary regions. (c, d) Reconstructed volumes of the Ag precipitates processed by SIRT.
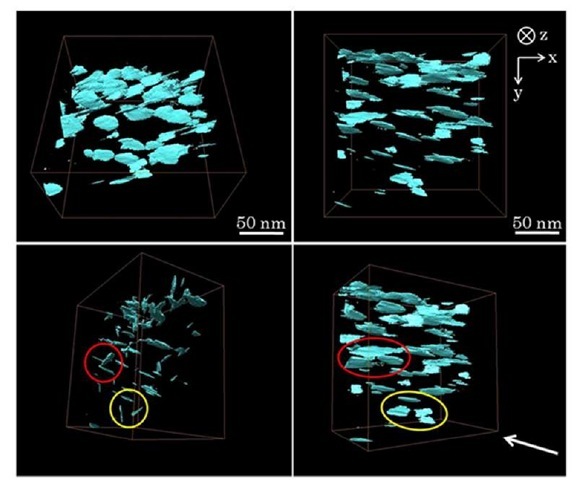
Fig.7 Reconstructed images of p’ precipitates in a Mg-7mass%Dy-3mass%Nd alloy aged at 200oC for 30h.
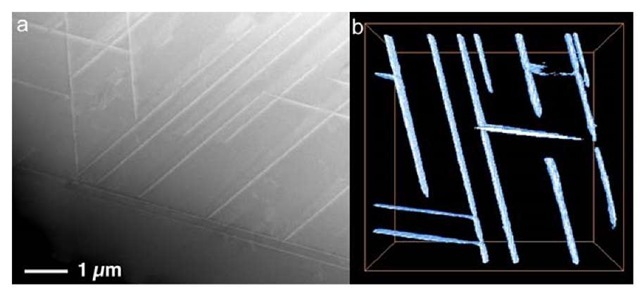
Figure 7 shows reconstructed images of P’ precipitates in a Mg-7mass%Dy-3mass%Nd alloy aged at 200oC for 30h processed by SIRT [22]. The tilt-series was observed sequentially from 0 to -70° and then 0 to +70 °. The tilt angle increments were set 2° for angles of 0 to |40|°, and 1° for |40| to |70|°. We can observe distribution of plate-like precipitates, separated by 10-50nm. Note that in the reconstruction of plate-like precipitates, it was found that SIRT gives a better result than WBP does in respect of the plate thickness perpendicular to the z direction as well as a smooth surface with little apparent dot-like artifacts. Using the same experimental setup, we also observed 3D structures of lamellar precipitates in Co-Ni based superalloys as shown in Fig.8 [23].
Fig.8 STEM-HAADF image (a) and a snapshot of reconstructed 3D image (b) of a Co-Ni-Cr-Mo superalloy.
Conclusion
We have studied 3D structures of nanoparticles and bulk alloys by means of electron tomography using STEM. In the case of FePd nanoparticles, we demonstrate that WBP yields a better estimation of the particle size in the z direction than SIRT does, most likely due to the presence of a missing wedge in the original data set, while the latter algorithm is superior to the former from the viewpoints of surface roughness and dot-like artifacts. Dislocation network in P phase of a Ti-Nb alloy was visualized by STEM-BF tomography exciting hh0 systematic reflections using a triple-axes holder. We also observed 3D structures and spatial distribution of precipitates in Ti-V-Al, Cu-Ag, Mg-Dy-Nd, and Co-Ni-Cr-Mo alloys by means of single-axis STEM-HAADF tomography. For the reconstruction of plate-like precipitates in bulk Mg-Dy-Nd alloys, it was found that SIRT gives a better result than WBP does in respect of the plate thickness perpendicular to the z direction.
![(a) A series of Z-contrast images taken at different tilt angles. (b) The analyzed particle length in the y-direction as a function of the tilt-angle. The particle length decreases as the tilt-angle increases towards 90°, indicating the fact that the particle height is shorter than the diameter. Extrapolation of particle length in the y-direction to the value expected at the tilt-angle a = 90° leads to an elucidation of the true particle height. Here, the extrapolation was performed by fitting the data points at angles higher than 40° using cosine of the tilt angle [13]. (a) A series of Z-contrast images taken at different tilt angles. (b) The analyzed particle length in the y-direction as a function of the tilt-angle. The particle length decreases as the tilt-angle increases towards 90°, indicating the fact that the particle height is shorter than the diameter. Extrapolation of particle length in the y-direction to the value expected at the tilt-angle a = 90° leads to an elucidation of the true particle height. Here, the extrapolation was performed by fitting the data points at angles higher than 40° using cosine of the tilt angle [13].](http://what-when-how.com/wp-content/uploads/2011/07/tmp111_thumb.jpg)
![(a) The relation between particle diameter and thickness (height) for the FePd nanoparticles estimated by using several different techniques. (b) Oblique-view of the reconstructed volume processed by SIRT (upper) and (c) WBP (lower). Large discrepancy in particle thickness (height) is apparent. The reconstructed volume is 75 x 75 x 36 nm3 [13]. (a) The relation between particle diameter and thickness (height) for the FePd nanoparticles estimated by using several different techniques. (b) Oblique-view of the reconstructed volume processed by SIRT (upper) and (c) WBP (lower). Large discrepancy in particle thickness (height) is apparent. The reconstructed volume is 75 x 75 x 36 nm3 [13].](http://what-when-how.com/wp-content/uploads/2011/07/tmp112_thumb_thumb.jpg)
![3D distribution of the p phase in Ti-12mass%V-2mass%Al after annealing for 24 h at 500oC [19]. (a) An original STEM-HAADF image. Bright regions correspond to the V-rich p phase. (b) Reconstructed images processed by WBP. (c) A bird-view of the reconstructed volume (690 x 720 x 375nm3). Plate-like structures correspond to the p precipitates. 3D distribution of the p phase in Ti-12mass%V-2mass%Al after annealing for 24 h at 500oC [19]. (a) An original STEM-HAADF image. Bright regions correspond to the V-rich p phase. (b) Reconstructed images processed by WBP. (c) A bird-view of the reconstructed volume (690 x 720 x 375nm3). Plate-like structures correspond to the p precipitates.](http://what-when-how.com/wp-content/uploads/2011/07/tmp113_thumb.jpg)
