Plate Section (Neuroanaesthesia and Neurointensive Care) Part 4


Bedside CT. This patient sustained severe brain, chest and orthopaedic injuries following a road traffic accident. Using the CereTom mobile CT scanner (NeuroLogica Corporation, Danvers, MA, USA), imaging was obtained at the bedside without the need to transfer the patient to the radiology suite.

Fig. 10.1. Bedside CT. This patient sustained severe brain, chest and orthopaedic injuries following a road traffic accident. Using the CereTom mobile CT scanner (NeuroLogica Corporation, Danvers, MA, USA), imaging was obtained at the bedside without the need to transfer the patient to the radiology suite.

 CTand magnetic resonance angiography (MRA). The image in the left panel is from the same patient as shown in Fig. 10.10 and demonstrates the arteriovenous malformation within the region of the right Sylvian fissure. Further investigation using formal angiography was undertaken to delineate the arterial supply and venous drainage of the lesion. The image in the right panel was obtained using MRA and demonstrates a normal-appearing cerebral circulation.


Fig. 10.11. CTand magnetic resonance angiography (MRA). The image in the left panel is from the same patient as shown in Fig. 10.10 and demonstrates the arteriovenous malformation within the region of the right Sylvian fissure. Further investigation using formal angiography was undertaken to delineate the arterial supply and venous drainage of the lesion. The image in the right panel was obtained using MRA and demonstrates a normal-appearing cerebral circulation.

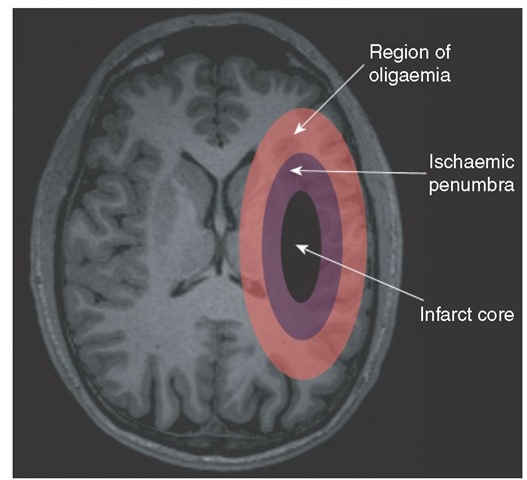
Schematic demonstrating the ischaemic penumbra: ischaemic core of infarcted tissue (black), penumbral region of ischaemic brain tissue at high risk of cerebral infarction (purple) and the surrounding region of oligaemia (pink) above the threshold for cerebral injury following an acute vascular occlusion.

Fig. 10.12. Schematic demonstrating the ischaemic penumbra: ischaemic core of infarcted tissue (black), penumbral region of ischaemic brain tissue at high risk of cerebral infarction (purple) and the surrounding region of oligaemia (pink) above the threshold for cerebral injury following an acute vascular occlusion.

Assessment of cerebral blood flow (CBF) using CT perfusion. This patient suffered a subarachnoid haemorrhage secondary to an anterior communicating artery aneurysm. The plain CT image on the left demonstrates hypodensity within the medial aspects of the frontal cortex in both hemispheres and also within the right occipital cortex. These areas have very low CBF and cerebral blood volume (CBV) suggestive of established infarction. In addition, there is a generalized reduction in CBF across the right hemisphere with an increase in CBV suggestive of cerebral ischaemia secondary to arterial vasospasm. This reduction of perfusion is most noticeable on the mean transit time (MTT) image, which clearly shows the delay in perfusion across the whole right hemisphere.

Fig. 10.13. Assessment of cerebral blood flow (CBF) using CT perfusion. This patient suffered a subarachnoid haemorrhage secondary to an anterior communicating artery aneurysm. The plain CT image on the left demonstrates hypodensity within the medial aspects of the frontal cortex in both hemispheres and also within the right occipital cortex. These areas have very low CBF and cerebral blood volume (CBV) suggestive of established infarction. In addition, there is a generalized reduction in CBF across the right hemisphere with an increase in CBV suggestive of cerebral ischaemia secondary to arterial vasospasm. This reduction of perfusion is most noticeable on the mean transit time (MTT) image, which clearly shows the delay in perfusion across the whole right hemisphere.

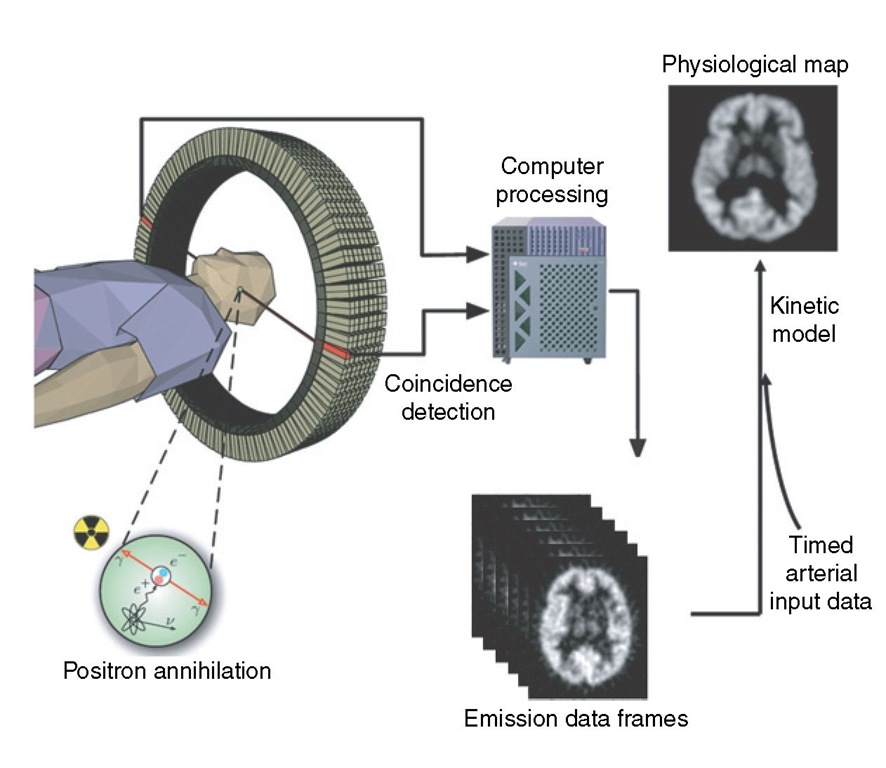
 Positron emission tomography (PET). The use of positron-emitting isotopes, incorporated into biological tracers, has enabled in vivo studies of human physiology in health and disease. These positron-emitting isotopes decay by emitting a positron, which is the positively charged anti-particle of the electron. The positron travels a short distance in tissue before it annihilates with an electron and causes the simultaneous release of two photons perpendicular to each other. As the photons are emitted simultaneously, coincidence detection occurs for each event through a cylindrical array of detectors. The large datasets acquired in PET require powerful computers to perform the data corrections and image reconstruction in a feasible timescale. The emission frames from the PET scanner and the arterial blood radioactivity data can be used to calculate absolute physiological parameters using appropriate kinetic models.

Fig. 10.14. Positron emission tomography (PET). The use of positron-emitting isotopes, incorporated into biological tracers, has enabled in vivo studies of human physiology in health and disease. These positron-emitting isotopes decay by emitting a positron, which is the positively charged anti-particle of the electron. The positron travels a short distance in tissue before it annihilates with an electron and causes the simultaneous release of two photons perpendicular to each other. As the photons are emitted simultaneously, coincidence detection occurs for each event through a cylindrical array of detectors. The large datasets acquired in PET require powerful computers to perform the data corrections and image reconstruction in a feasible timescale. The emission frames from the PET scanner and the arterial blood radioactivity data can be used to calculate absolute physiological parameters using appropriate kinetic models.

Positron emission tomography (PET) imaging of regional metabolism following head injury. X-ray CT, PET cerebral blood flow (CBF), oxygen metabolism (CMRO2), oxygen extraction fraction (OEF) and glucose metabolism (CMRglu) images obtained following early head injury. Note the right temporal haemorrhagic contusion with surrounding rim of hypodensity on the X-ray CT. The lesion core reflects infarcted brain with no or very low CBF. The pericontusional cerebral hemisphere displays variable pathophysiology. Immediately adjacent to the lesion core (dotted arrow), CBF is increased, CMRO2 and OEF variable but glucose metabolism increased, while the right parietal occipital cortex (white arrow) demonstrates a decrease in CBF and CMRO2 with an increase in OEF and variable glucose metabolism suggestive of regional cerebral ischaemia. The increase in CMRglu implies a switch to non-oxidative metabolism of glucose in order to meet underlying metabolic needs.

Fig. 10.15. Positron emission tomography (PET) imaging of regional metabolism following head injury. X-ray CT, PET cerebral blood flow (CBF), oxygen metabolism (CMRO2), oxygen extraction fraction (OEF) and glucose metabolism (CMRglu) images obtained following early head injury. Note the right temporal haemorrhagic contusion with surrounding rim of hypodensity on the X-ray CT. The lesion core reflects infarcted brain with no or very low CBF. The pericontusional cerebral hemisphere displays variable pathophysiology. Immediately adjacent to the lesion core (dotted arrow), CBF is increased, CMRO2 and OEF variable but glucose metabolism increased, while the right parietal occipital cortex (white arrow) demonstrates a decrease in CBF and CMRO2 with an increase in OEF and variable glucose metabolism suggestive of regional cerebral ischaemia. The increase in CMRglu implies a switch to non-oxidative metabolism of glucose in order to meet underlying metabolic needs.

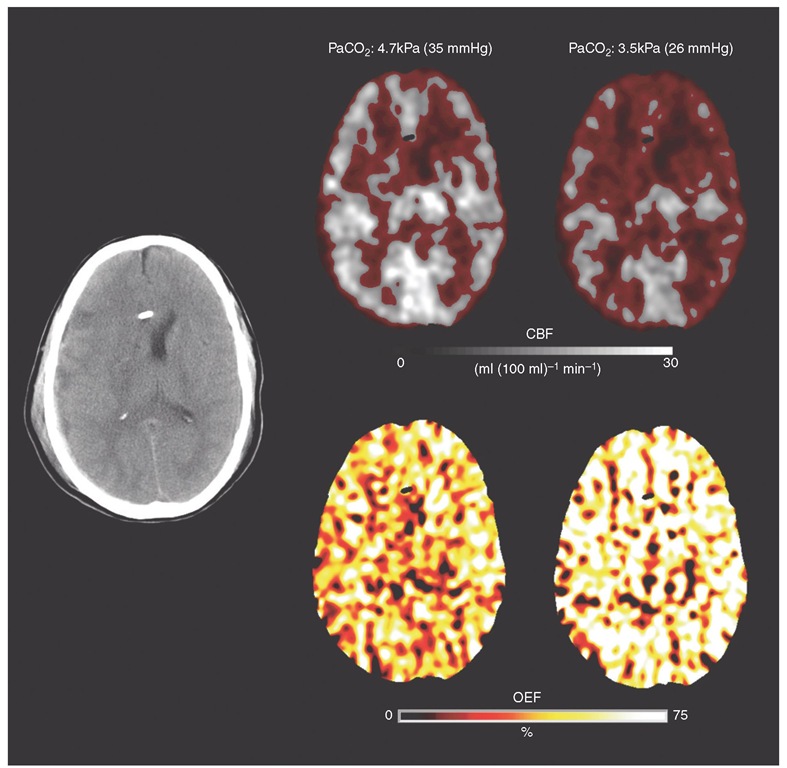
Assessment of the efficacy of acute hyperventilation using positron emission tomography (PET) imaging. Structural CT following early head injury demonstrates a thin right subdural haematoma with underlying cerebral contusion, swollen hemisphere with effacement of the ipsilateral ventricle and midline shift. Greyscale PET cerebral blood flow (CBF) images were obtained at relative normocapnia (left panel) and hypocapnia (right panel). Voxels with a CBF <15 ml (100 ml)-1 min-1 are picked out in red. Baseline intracranial pressure (ICP) was 21 mmHg and supports the use of hyperventilation to lower arterial carbon dioxide tension (PaCO2) and improve ICP control. Hyperventilation did result in a reduction in ICP to 17 mmHg, but, in this individual, led to a substantial increase in the volume of hypoperfused brain. The PET oxygen extraction fraction (OEF) images show that the effect of the reduction in perfusion is a dramatic increase in OEF to levels consistent with cerebral ischaemia.

Fig. 10.16. Assessment of the efficacy of acute hyperventilation using positron emission tomography (PET) imaging. Structural CT following early head injury demonstrates a thin right subdural haematoma with underlying cerebral contusion, swollen hemisphere with effacement of the ipsilateral ventricle and midline shift. Greyscale PET cerebral blood flow (CBF) images were obtained at relative normocapnia (left panel) and hypocapnia (right panel). Voxels with a CBF <15 ml (100 ml)-1 min-1 are picked out in red. Baseline intracranial pressure (ICP) was 21 mmHg and supports the use of hyperventilation to lower arterial carbon dioxide tension (PaCO2) and improve ICP control. Hyperventilation did result in a reduction in ICP to 17 mmHg, but, in this individual, led to a substantial increase in the volume of hypoperfused brain. The PET oxygen extraction fraction (OEF) images show that the effect of the reduction in perfusion is a dramatic increase in OEF to levels consistent with cerebral ischaemia.

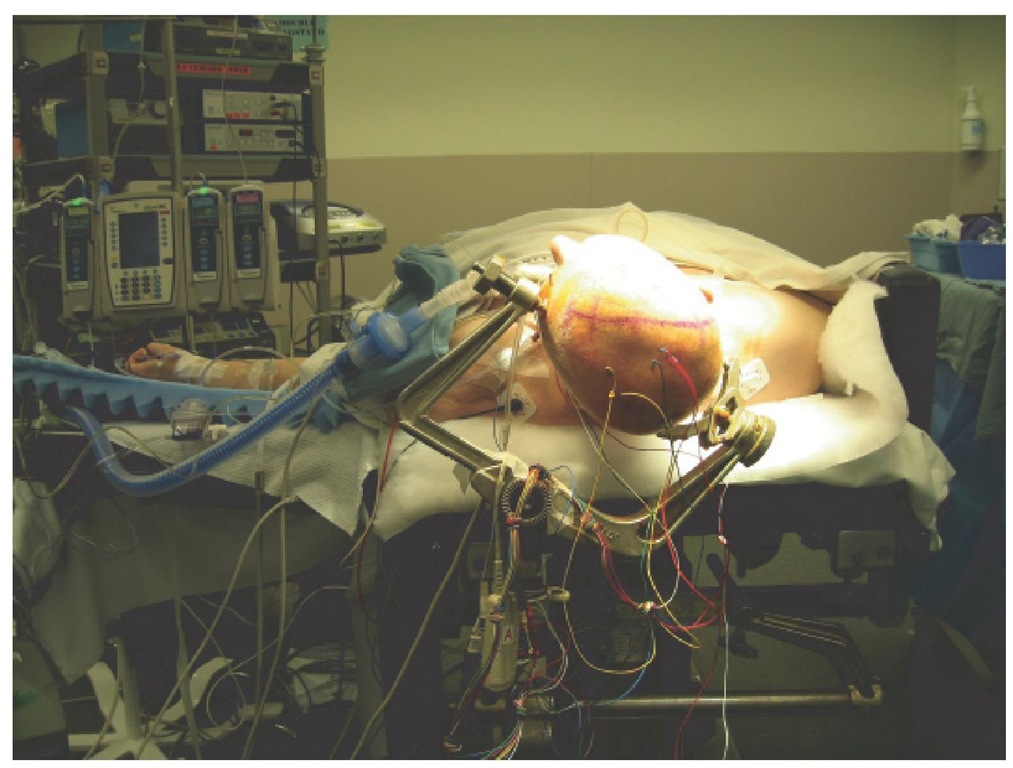
Patient in the supine position with a slight head-up tilt. All pressure points are adequately padded and the eyes are protected.
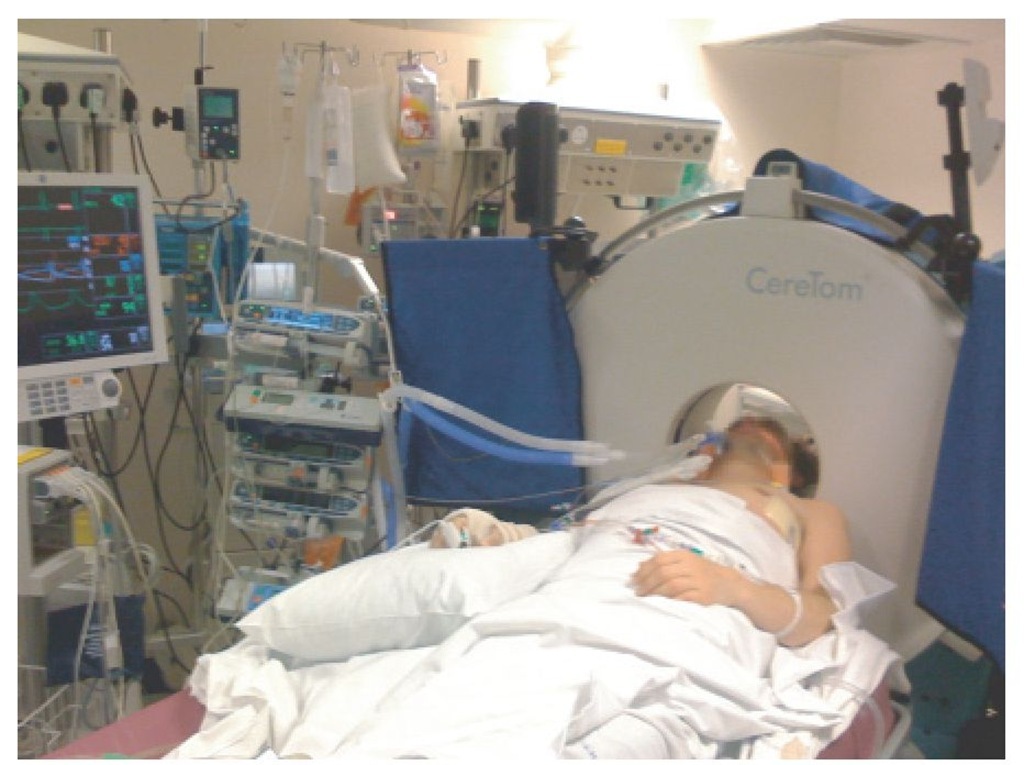
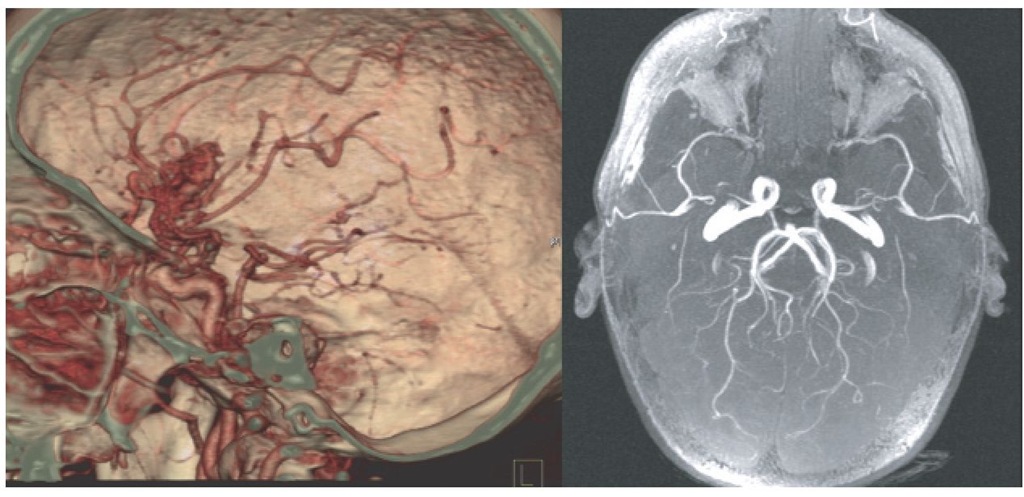
Fig. 11.1. Patient in the supine position with a slight head-up tilt. All pressure points are adequately padded and the eyes are protected.
Next post:

Previous post: