Although it is clearly that AP amplitude is suitable for measurement, after learning it changes only for a few percentage points [1267, 670, 586, 1004, 1367] and sometimes alterations are not found at all [865, 1428]. A change in excitability after learning and LTP has been described in many reports, but the results were mostly acquired by testing with a current pulse, while the threshold within the response to current pulse may differ from the thresholds within responses to, for instance, CS+ and CS~. Therefore, these reports exposed unspecific change in excitability, and it would be important in these cases to examine a selective change in thresholds. Plasticity of excitability was persistent during days or weeks, but later passed away [1351, 1100], and these results are impossible to consider as convincing. Since prolonged recording in an experiment is impossible at the present time because of technical reasons, more intracellular recording is necessary in order to evaluate excitability. The data mentioned here were obtained in separate experiments at the neural tissue taken from trained and naive animals. Neurons from heavily trained animals may be more sensitive to damage and were more injured by the electrode. Particularly, the effect may be observed because in the trained animal some neurons with a low threshold were recorded [1100].
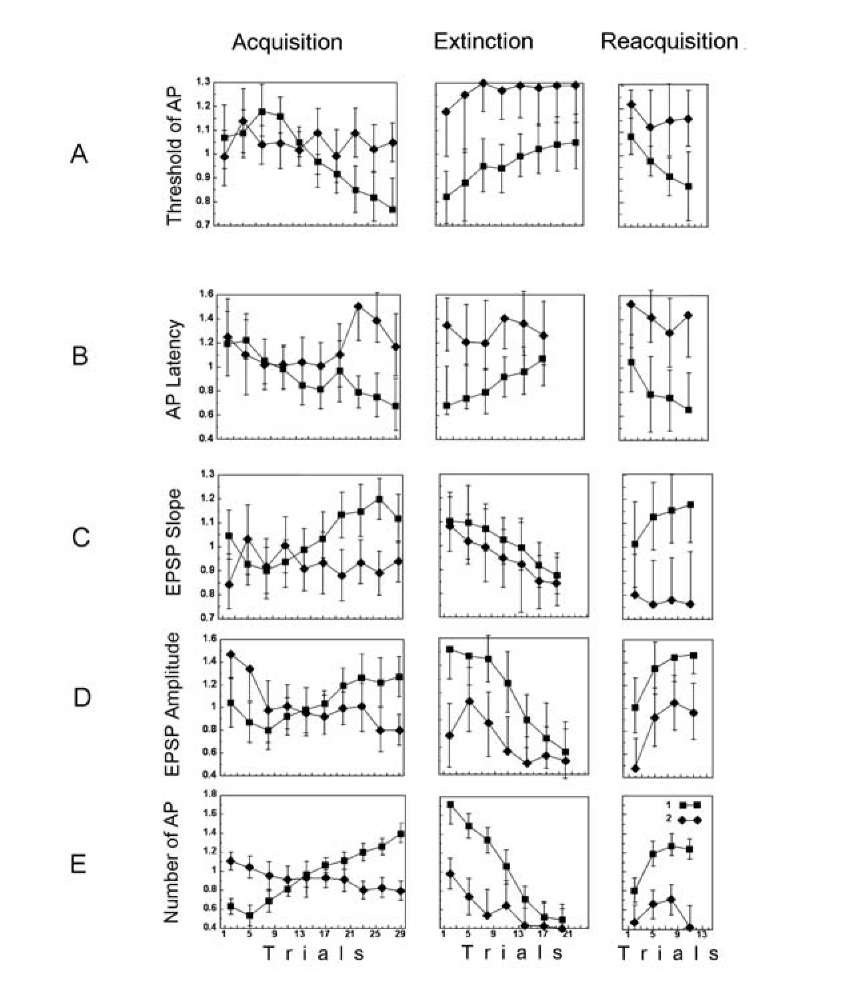
Fig. 1.20. Behavior of neuronal activity during acquisition, extinction and reacquisition. The symbols are denoted in the figure (E), 1 – responses to the CS+, 2 – responses to the CS- vs. the trial number. For each neuron the corresponding characteristics were normalized to a mean response – separately for acquisition, extinction and reacquisition. A- AP thresholds; B- AP latencies; C – slope of the EPSP; D – EPSP amplitudes. The values and confidence intervals (p < 0.05) in the plots (A-D) are calculated by means of a two-way ANOVA with interactions between the trial number and the type of stimulus – CS+ or CS-. E the number of APs, the time window over which the APs were counted was 0.5 s; medians and confidence intervals are shown (Mann-Whitney U test, p < 0.05). AP latency in response to tactile stimulus was measured from the onset of the EPSP to the onset of the AP. The slope of the EPSP was measured as the tangent of the angle of the EPSP growth. The EPSP amplitude was measured when a neuron failed to generate AP, the AP threshold and latency when a neuron generated an AP in the response, while EPSP slope and number of APs in the response were recorded for every response.
Many reports describe a change in excitability during learning within the responses to stimuli whose significance changes during learning [1355, 641, 24, 525, 45]. However, in cited investigations did not test excitability within responses to discriminated stimuli. The selective form of excitable membrane plasticity has been described in other laboratories [1157, 982, 1419, 374, 997, 1339]. During elaboration of a conditional reflex in the Helix mollusk, an AP threshold within the response to a CS+ decreased to a greater degree than a threshold in the response to a US, while pseudoconditioning did not change excitability within the response to a CS+ but augmented excitability in the response to a current pulse [752]. It has been reported that the excitability of cortex neurons during conditioning increases while spontaneous activity does not change, which was explained by the specific geometry of neuronal inputs [1355, 48], but it could also be explained by selective change in excitability. Selective change in excitability was found later in other cases after LTP in the hippocampus, cortex and cerebellum [586, 291, 414, 374] and was explained too by the local modification of excitability in the restricted dendritic area, connecting this excitability to potentiated and non-potentiated inputs.
We think that this assumption of specific excitability in the restricted dendritic area cannot explain the specificity of normal learning. Certainly, if synaptic input for the CS+ lies, for example, close to modified channels, an alteration in these channels could underlie long-lasting changes in the AP waveform just within the response to the CS+ and may facilitate spike generation. An EPSP evoked by a CS~ might not undergo amplification because of its spatial remoteness from these modified channels. Therefore, a change in excitability will be selective but steady, not transient. In order to accept this hypothesis, we have to speculate that locations of the conditioned and discriminated excitations become different during acquisition, draw together during extinction and rapidly diverge during reacquisition. This does not look more probable than a transient alteration of excitability within the response to a given stimulus. In particular, selective change in excitable membrane properties was demonstrated in an isolated neuron when microelectrodes played a role as source of a stimuli with an invariable location [1157, 1419, 1301] and when a rare stimulus was a fragment of a habitual stimulus [1272].
An unexpected outcome of investigation into excitable membrane plasticity has come from the analysis of neuronal reaction selectivity during image recognition. Direction selectivity in simple cells of the cat primary visual cortex has usually been explained by a selectivity of inhibitory processes: in the preferred direction excitations surpass inhibitions. However, it has been proved that excitations and inhibitions in the visual cortex and retina are tuned for the same direction and therefore selectivity cannot be explained by the spatial organization of excitatory and inhibitory synaptic inputs [997, 307]. During habituation and conditioning, too, the EPSP and inhibitory postsynaptic potential changes in the same direction. Moreover, the time of the greatest inhibition was close to the time of the least excitation for the same spatial input and a difference in their latencies cannot explain the selectivity. The spike response is far more direction selective than synaptic response and its selectivity may be explained by a nonlinear decrease in spike threshold for the preferred direction.
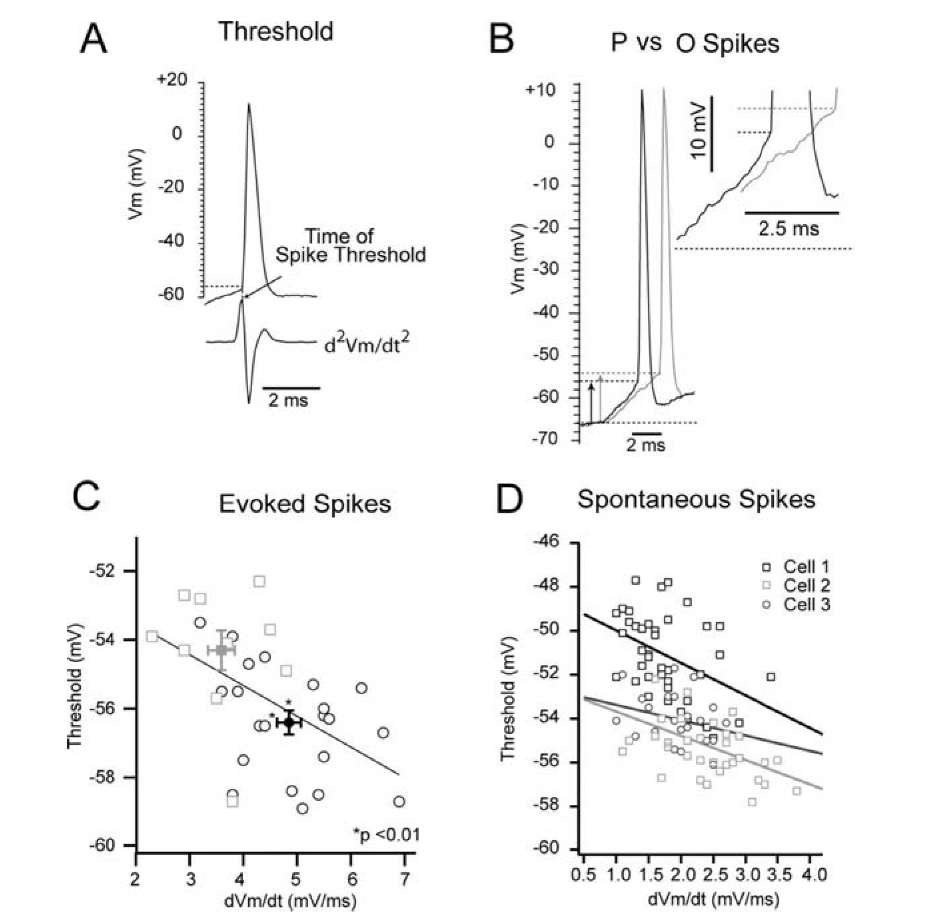
Sensory neurons in the rat barrel cortex also demonstrated different excitability to the preferred and non-preferred orientations of the whisker angular deflection (Fig. 1.21A,B) [1339]. The difference in the threshold was 2.1 mV. The mean spike response was more sensitive to the direction of whisker deflection than the mean synaptic response. Spike threshold was measured at the maximum of curvature at the AP front. Only the first AP in the response was measured. The rate of rise of the synaptic response, EPSP slope, and threshold were connected by a negative correlation. This correlation is considered as the reason for existence of different thresholds in the same neuron. The authors explained the change in excitability as the result of an increased proportion of Na+ channels entering the inactivated state during the slower depolarization. This explanation is plausible if depolarization is long enough or large enough. The difference in latencies between an AP for preferred and non-preferred direction was only 5 ms, while EPSP amplitude was a few mV [1339] (Fig. 1.21).
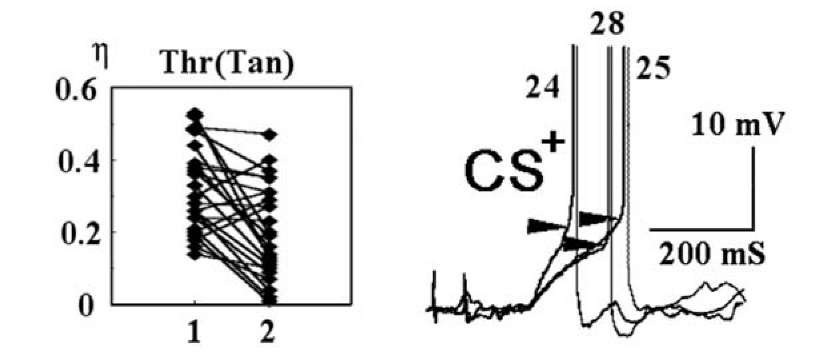
Negative correlation between EPSP slope and AP threshold was observed also in our experiments [1259], but cause-and-effect correspondence between these factors was absent (Fig. 1.22).
High thresholds, as a rule, are observed in the responses with larger AP latencies and lower EPSP slopes, but correspondence between the threshold and the slope of the EPSP was not well-defined. Thresholds may differ when EPSP slopes almost coincided and a smaller EPSP slope may correspond either to smaller or larger thresholds (Fig. 1.22,right). Fig. 1.22 (left) demonstrates a weak correspondence between AP threshold and EPSP slope for within-cell comparisons. The correlation ratio for the dependence between AP threshold and EPSP slope tended to decrease after factoring out the covariate trial number, and only for a few cells did the covariate tend to increase, when the trial number was kept constant [1259].
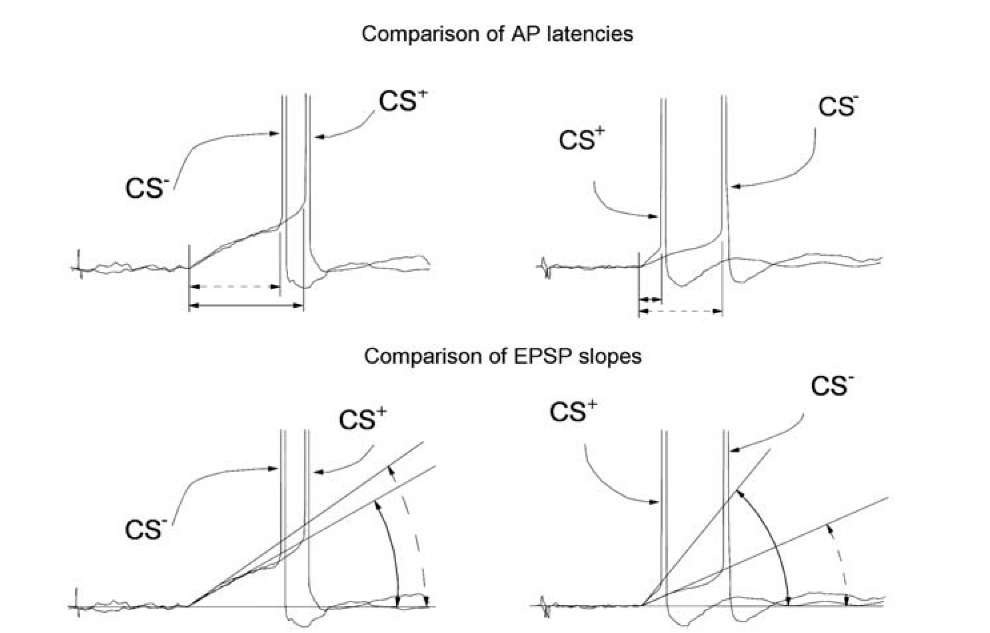
The examples in Fig. 1.23 demonstrate that the AP threshold, AP latency and EPSP slope are not connected by a rigorous dependence. After training, the AP latency in the response to the CS- may be smaller (top left) or bigger (top right) than it was in the response to the CS+. Similarly, the EPSP slope may be bigger (bottom left) or smaller (bottom right) in the response to the CS~ (Fig.1.23). However, in both cases the threshold in response to the CS~ exceeds the threshold at the response to the CS+.
Fig. 1.21. Spike threshold and the preceding dVm/dt. A, The level of the spike threshold was determined as the voltage from the baseline to the time of the peak of the second derivative. B, A preferred direction – (black) and opposite direction – (gray) evoked spike are shown. The rate of rise preceding the preferred direction of the spike was 1 mV/ms greater than that of the opposite direction – evoked spike, and the spike threshold of the preferred direction was 2.0 mV lower than that of the opposite direction-evoked spike (vertical arrows). The inset shows the final 2.5 ms of the synaptic response leading to a spike, the time period in which dVm/dt was determined. C, Threshold and EPSP slope of all evoked spikes for opposite direction (squares) – and preferred direction (circus) – are shown. The spike threshold of the preferred direction-evoked spikes was significantly lower, and the dm/dt was significantly higher than that of opposite direction -evoked spikes (mean SE). D, Threshold versus EPSP slope for spontaneous spikes from three sample cells, including the cell shown in B (cell 1).
Fig. 1.22. An overview of correspondence between an AP threshold and an EPSP slope during acquisition of classical conditioning. At the left, the correlation ratio for an AP threshold and EPSP slope in the majority of the cells decreased when the trial number was kept constant. The presence of dependence (not only linear) between the variables was estimated using analysis of variance. Analysis of the influence of covariates on correlation ratio shows how a given dependence would have changed if the covariates were kept constant. The influence of a given covariate means that the covariate affects either the shape of the dependence or the spread in its value. Each diamond represents one cell. Ordinate: correlation ratio (n) of the dependence of an AP threshold (Thr) on the EPSP slope (Tan) in the same response. Abscissa: 1 main effect, correlation ratio. 2 the correlation ratio decreased when it was factored out in analysis of a covariate trial number. The relationship between an AP threshold and EPSP slope is partially explained by their common dependence on trial number. At the right, an example of the responses of the Rpa3 neuron to the CS+ during the last part of acquisition. The oscillogramms are matched in the membrane potential levels and the onset of the EPSPs. The number of CS+ at each exposure is indicated. Clear-cut correspondence between AP threshold and EPSP slope was evidently absent.
We evaluated correlation between the EPSP slopes and the AP thresholds in direct experiments. Change in strength of tactile stimulus lead to an increase in EPSP slope and amplitude, but does not affect AP threshold. This is just the famous all-or-none principle and it is almost always correct (Fig. 1.24).
An AP threshold decreases with the growth of the depolarization slope, but it remains almost constant with only a slight increase when the amplitude of the input signal increases, in spite of EPSP increases also in this case [1043, 1165, 413]. Therefore, selective increase in synaptic efficacy in the conditioned input cannot explain enhancement of excitability in the same input. Examination of the change in excitability in response to a stronger tactile stimulus did not reveal a significant difference between excitabilities within the response to the weak tactile stimulus directed to the same point of the foot (Fig. 1.24). This inspection was not examined in rat barrel cortex [1339].
Fig. 1.23. Weak interdependence between AP thresholds, AP latencies and EPSP slopes. Responses of mollusk neuron RPa3 to the CS- and CS+ after training are aligned at the point of the beginning of the EPSP. Two examples are shown at the left and at the right. At the top, imprecise changes of the AP latency in the responses to the CS- and the CS+ are shown. At the bottom, imprecise changes in the EPSP slope are demonstrated. Methods of measurement of AP latency and EPSP slope are indicated.
Fig. 1.24. The change in the AP threshold within responses of the Helix neurons LPa3 (top) and RPa3 (bottom) to weaker (left) and stronger (middle) tactile stimuli. At the right, mean change of AP thresholds for 18 neurons are shown. The results were obtained before acquisition. Thresholds are indicated by the arrows.
We believe that a cause-and-effect connection of the negative correlation between EPSP slope and threshold in the experiments of [1339] is not a correct conclusion. Firstly, excitability and EPSP slope were larger for the preferred direction, exactly as we have described properties of EPSP slopes and thresholds for the CS+ and CS- during classical conditioning; change in excitability and EPSP slope are parallel processes. Secondly, both EPSP slope and threshold are slightly increased with the strength of a stimulus that is connected with a positive correlation according to the experimental [1259] and theoretical [1043, 646] data. Thirdly, for the same value of EPSP slope, the threshold of the evoked AP was 2 mV smaller than the threshold of the spontaneous AP (Fig.1.21C, D). This difference is compatible with the whole value of the effect discovered in this investigation and, hence, a one-to-one correspondence between these characteristics was absent.
Investigation of selectivity of neuronal response sometimes reveals no specific change in excitability. In the visual cortex of cat, neurons respond selectively to the orientation and direction of movement of an object, but the threshold for the AP generation, which has been measured within the responses, did not depend on stimulus orientation, and thus could not account for the observed difference in the transfer function [1308]. However, only the threshold for the first AP in the response has to be measured, while 10 or more APs were generated and measured in each response. Possible participation of selective excitability in the recognition of images is a basic result, since it means that capability for reorganization of thresholds may be long-term. Then, when a neuron selectively reorganizes it excitability, its may maintain this property for a long time. Each time in the future when it will be necessary to recognize the signal, selective excitability has to recover it after access to long-term memory. Certainly, this suggestion needs examination.
The selective change in threshold cannot be explained by non-specific alterations in the neuronal state, such as the change in input resistance, ion concentration, the membrane potential, etc. These and any other changes in neuronal state may determine the selective change in excitability only if these alterations are transiently induced by the current stimulus. This is the reason why it is difficult to use patch recording, pharmacological blockage or other methods of channel investigations during learning. It would be convincing to compare responses from one entire experiment under normal conditions and another entire experiment under exposure to some one factor.
Neurons appear to evaluate the probable consequences of a signal not only according to its strength but also according to its significance, and then transiently change their own excitability. A neuron somehow chooses an appropriate excitability, but the mechanism of the transient reorganization of excitability is still unclear. Modifications of excitability during learning are in accordance with the assumption about rapid reorganization of Na+ channel properties: the number of active channels in the membrane and their opened-closed characteristics. Although this scheme is not a final hypothesis, it is in accordance with all known data. Thus, during habituation, drawing of Na+ channels into the signal-induced excitation is impeded, while after classical conditioning, CS+ more easily draws Na+ channels into the reaction. Consequently, during habituation, Na+ channels are but sluggishly concerned in AP generation and a spike may not be generated at all. Correspondingly, for classical conditioning, the effects should be opposite. These conclusions are supported by the data concerning change in latency, threshold of AP and number of APs in the response to learning related signals (see Sec. 1.7).
The AP start depends mostly on the potential-dependent Na+ channels, while other channels such as K + and Ca2+ are involved later. Na+ channels interact with second messengers, undergo post-translational modifications and this regulation allows electrical excitability to be tuned to changing physiological needs [55, 790]. Neurons may respond to changes in their input by adding Na+ channels that alter electrogenic properties of the cell membrane [1215]. However, expression of new channel requires few hours, whereas the phos-phorylation of channels already presented in the membrane takes a fraction of second. Chemical diffusion through cell is slow process and can take 10-100 ms, but diffusion of little molecules between neighboring synapses has a shorter character time. Theoretical accounts demonstrate that the change in excitability during learning may result from a shift in the voltage dependence of Na+ channel activation or a change in the probability of their transition into an open state [514, 1044]. Change in excitability during LTP [1367], LTD [745], stimulus detection [14], cocaine-withdrawal [1428] and conditioning [1351] depends on the function of voltage-gated Na+ channels and on participation of the system of second messengers. There are indications that second messenger cyclic AMP participates in the adaptive reorganization of excitability. Thus, excitability of central auditory neurons is, probably, regulated by cyclic AMP pathway. Elevation of the intracellular cyclic AMP level slowly (tens of minutes) increases the spontaneous activity compared to tone evoked responses, while responses to tone and to glutamate increased similarly [1119]. However, there is a shortage of direct experimental data on the participation of Na+ channels and cyclic AMP in the reorganization of behavior.
The same neuron or synapse may participate in the analysis of different stimuli. How quickly can modulation of Na+ channels be expressed? This time should be shorter than the EPSP duration, since the same neuron may generate different AP waveforms in response to an EPSP evoked by different signals. Rapid conditioned alterations have been observed with a latency of from 10 ms to 30 ms, but it is unclear if they are transiently evoked by a CS+, or preexisted without connection to the current stimulus. We have shown directly that the AP waveform changes within 50-200 mS, from the first to the second AP within a response to the CS+. During execution of a sinusoidal flexionextension movement of the wrist in a tempo of 1 Hz, motor neurons in cortical structures and spinal motoneurones modulate their excitability with congruent time courses as the motor program [152]. Since the excitability modulation precedes the movement, one can suppose that highspeed adjustment of excitability may control a current behavior. The firing threshold seems to be a dynamic property of an excitable membrane, but it must rebuild their properties rapidly.
It is necessary to make a reservation concerning the speed of signal recognitions. This process uses only short-term memory. 10-30 ms for decision-making is related only to signals participating in the current learning, as the CS+ and CS-, to be exact in respect to current signal and without participation of long-term memory. What is really necessary for signal recognition is the merging of information from activated synapses and correlation of this information with the current expectation of reward. Participation of long-term memory requires at least a ten times longer time interval for recognition than, for instance, recall of famous faces [1005, 8].
Rapid transmission of intracellular signals may also be realized through the cytoskeleton, which forms continuous, dynamic connections between nearly all cellular structures, and these connections present an enormous surface area upon which proteins and other cytoplasmic components can dock [696, 230]. Transmission may have a selective direction through narrow channels in microtubules, since both the neuron soma and dendritic tree are penetrated by a system of microtubules. The cytoskeleton network not only contains many filamentous elements, but its structure also changes constantly in time [140]. The chemical and physical properties of the cytoskeleton suggest that it may have subtle and important effects on the way in which information is passed5.
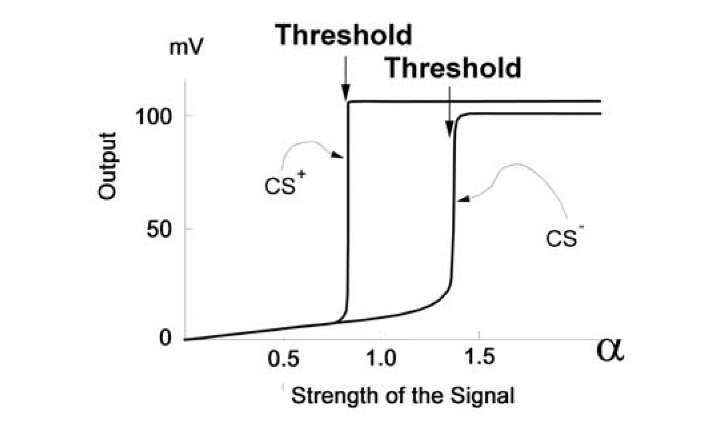
Co-existence of two thresholds in a neuron looks like the occasion to reject the all-or-none principle. Nevertheless, neurons generally either do generate an AP or do not generate it at all. Change in AP amplitude during learning is usually small. Consequently, it is not a good idea to reject this basic principle of neuron function. However, our results mean that the all-or-none principle ought to be modified. Fig. 1.25 demonstrates the results of a computational
experiment illustrating such a modification. Suppose that one combination of excited synapses corresponds to a CS+ and another such combination corresponds to a CS-. The properties of excitable membranes in our model were controlled by supposed chemical reactions occurring in neural cells (for details see Sec. A.1).
Fig. 1.25. Modified all-or-none principle. Activation functions for responses to the CS+ and CS" are shown for the 10-synapsed model neuron after 20 combinations of a CS+ and an US. The CS+ corresponded to the pattern: 111111000, CS" to: 0000111111. During the test, after learning the CS+ was – aaaaaa0000 and the CS" – 0000aaaaaa, where a changed in the limits 0 < a < 2. Abscissa – a value. Ordinate – maximum membrane potential deviation in response to the signal, calculated as described in the Hodgkin-Huxley model.
After conditioning, the thresholds within the response to a CS+ and a CS-become different and a neuron chooses a branch of the activation function (Fig. 1.25), which, presumably, leads to a healthy result. However, for the given combination of inputs, the model exhibits (after learning) the all-or-none principle of spike generation, when intensity of the inputs changes.
