INTRODUCTION
The purpose of this article is to examine the stable, ordered near-surface phase of dichain cationic surfactants, which has been recently reported,[1] and to determine whether this phase can be unambiguously assigned as a vesicular phase. Such a phase would be a remarkable example of an aligned near-surface phase, extending hundreds of nanometers into solution, which exists in equilibrium with the bulk aqueous phase, and may explain the superspreading characteristics of these surfactants,[2] providing a reservoir of surfactant near the surface.
These surfactants are also widely used as fabric softeners and are the subjects of keen interest for pharmaceutical applications. They have been shown to form vesicles in dilute solutions. This is particularly significant as it extends the range of standard vesicle-forming compounds beyond phospholipids, long the gold standard of the field. Furthermore, the vesicles formed by these cationic surfactants are generally smaller than those formed from phospholipids, ranging from as small as 30 nm. These cationic vesicles are the subjects of biomedical research, where they are highly regarded as effective gene transfer agents in gene therapy.[3] Part of the success of this technique depends on the interaction between the cationic vesicle-DNA complex and the target cell membrane, which enables the DNA to cross undegraded,[4] and thus it is of interest to know how the surfactant vesicles behave near a surface.
VESICLES
The vesicle morphology is a common motif in surfactant self-arrangement. Favored by surfactants whose packing parameter falls in the typically lamellar range (0.5 < pp<1), it often coexists in solution with other lamellar-type structures such as lamellar fragments or sponge phases. The precise morphology chosen for a given surfactant depends critically on the precise nature of the surfactant and its counterion and the solution conditions of the system.
The most well-studied and common vesicle-forming surfactants are phospholipids.1-5-1 These vesicles have been used as cell-membrane analogs[6,7] and have a great deal in common with ordinary biological cells. They do not form spontaneously, requiring significant energy input to form typically through sonication, and produce large, metastable vesicles which can grow as large as micrometers. Phospholipid vesicles are not generally mono-disperse and can be both unilamellar and multilamellar. Monodispersity is often achieved by forming vesicles using a fixed-size extrusion technique.
Phospholipid vesicles are not, however, found to be stable when interacting with a solid surface. This enables them to be widely used to deposit phospholipid bilayers on surfaces for use as model membranes, where the vesicle collapses on contact to produce a lamellar bilayer at the surface.[8-10]
The range of vesicle-forming surfactant systems has recently been enlarged through the use of combinations of oppositely charged surfactants,[11-14] nonionic surfactants,1-15,16-1 and dichain cationic surfactants.[17-20] The vesicle-forming dichain cationic surfactants, which are the dialkyldimethylammonium bromide (DAB) family, are the focus of the work referred to as the basis of this article.
SURFACE MEASUREMENTS
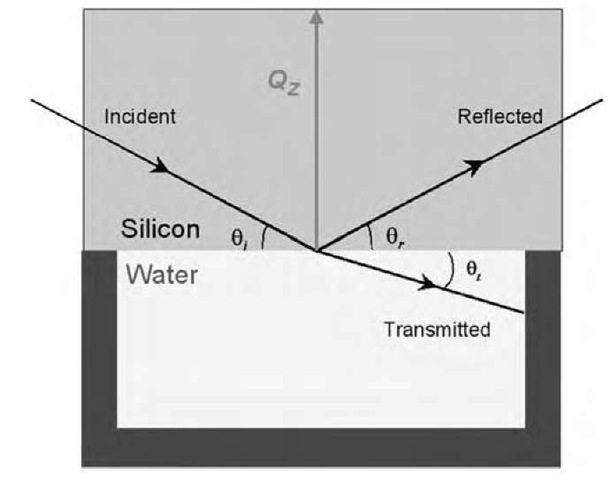
Neutron reflectometry provides the unique ability to probe the surface and near-surface region of a solid-liquid interface nonintrusively, an important condition for the study of such fragile systems. Neutrons of 1-10 A wavelengths, which are typically used for surface measurements, penetrate a single crystal of silicon with greater than 70% transmittance over a path length of around 15 cm and are then reflected from the solid-liquid interface (see Fig. 1 for the standard geometry of a solid-liquid experiment). Neutron reflectometry also gives information about the near-surface structure in solution. The neutron penetration length in D2O is of the order of microns for 10-A neutrons, although, experimentally, it is found that it is difficult to detect species which are highly disperse or rough below the surface.
The reflection experiment measures the number of neutrons reflected as a function of the wave vector change on reflection (normally referred to as the momentum transfer) QZ, which itself is a function of the wavelength of the neutrons and the angle of reflection
Fig. 1 The geometry of a specular neutron reflection experiment at the solid-liquid interface, where 9i = 9r and QZ is the vertical momentum transfer.
The reflection depends on the interaction of the neutrons with the nuclei present at the surface. The extent of nuclear interaction with a neutron is described by an experimentally well-determined quantity known as the coherent scattering length bcoh, which varies nonsystemat-ically across the periodic table (see Table 1 for values of this parameter for a few biologically significant isotopes). In contrast to the X-ray scattering equivalent, it can be seen that hydrogen isotopes have large bcoh, which significantly takes a negative value for 1H. This allows simple isotopic substitution to adjust the contrast of hydrogen-containing molecules; indeed, for water, the scattering length density (SLD) can range from — 0.58 up to 6.35 A— 2, enabling it to be contrast-matched to many common interfaces [SLD(Si)=2.07 A— 2, SLD(Air)=0.0 A— 2] so that the only scattering arises from material found at the interfacial region.
Table 1 Bound coherent scattering lengths (bcoh) for biologically significant isotopes
|
Element |
bcoh (10— 5 A) |
Element |
bcoh (10— 5A) |
|
JH |
— 3.74 |
12C |
6.65 |
|
2H (D) |
6.67 |
13C |
6.20 |
|
16O |
5.81 |
14n |
9.37 |
Modeling
Data analysis is normally performed using optical matrix methods, in which the interface region is modeled as a series of homogenous layers. The layers are each characterized by a thickness [t (A)], SLD [p (A— 2)], and an interfacial roughness between adjacent layers [s (A—:)]. The exact reflectivity can be calculated from such a model; this can be compared with the data, and the model is then refined using least-squares minimization routines. For a more detailed discussion of the analysis of neutron reflectometry data in general, refer to Li et al.[22]
Off-Specular Scattering
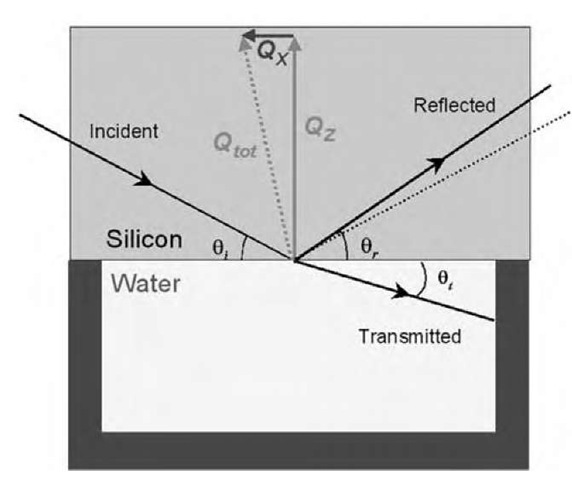
If the interface between two regions is rough on a length scale appropriate to the wavelength of the scattering neutrons, then it is possible for some reflection to occur at angles that do not equal the incident angle. In this situation, the scattering, known as off-specular scattering, contains momentum transfer in both the perpendicular (QZ) and horizontal (QX) directions (see Fig. 2 below showing the geometry of the off-specular scattering experiment). It is therefore theoretically possible to determine, from the pattern of this scattering, information about the horizontal structure in a surface layer.
In practice, the determination of horizontal order is far from a routine procedure. Current instruments are not optimized for the detection of off-specular scattering, particularly at the small dispersive angles necessary for these DAB measurements, and there have been few measurements making use of this ability. The most notable exceptions are in the field of magnetic thin films, where the ability of polarized neutrons to interact with magnetic fields is employed.[23]
Fig. 2 The geometry of an off-specular reflection experiment. Here the angle of the reflected beam 9r^ 9j, and there are two components to the total momentum transfer Qtot, a vertical (QZ) and a horizontal (QX) component.
Bulk Solution Measurements
As an aid to modeling the surface conditions, bulk solution measurements are often used as a guide. Small-angle scattering is a well-established technique for determining bulk solution structures of surfactant solutions, which involves measuring the scattering of X-rays or neutrons from solutions in a transmission geometry. This technique is also nonperturbing, and neutron small-angle scattering shares many of the benefits of reflectometry in relation to the ability to alter contrast through the use of isotope labeling. X-ray small-angle scattering has the advantage of being able to make use of the extremely high flux available at modern synchrotron sources, enabling low-contrast (e.g., dilute) solutions to be measured, or measurements with high temporal resolution.
Cryo-transmission electron microscopy (cryo-TEM) is a much more recent technique, which involves taking a thin-film of a surfactant solution and flash-freezing it in near-freezing ethene. The freezing happens so rapidly that the water does not have time to crystallize and is considered to be much faster than what surfactant rearrangement would be, preserving the room-temperature surfactant structure.1-24-1 However, it has been reported that the process of thinning the surfactant solution to an appropriate thickness for flash freezing (100-200 nm) may cause changes to the surfactant structure,[25] so that the evidence from cryo-TEM images must always be considered carefully.
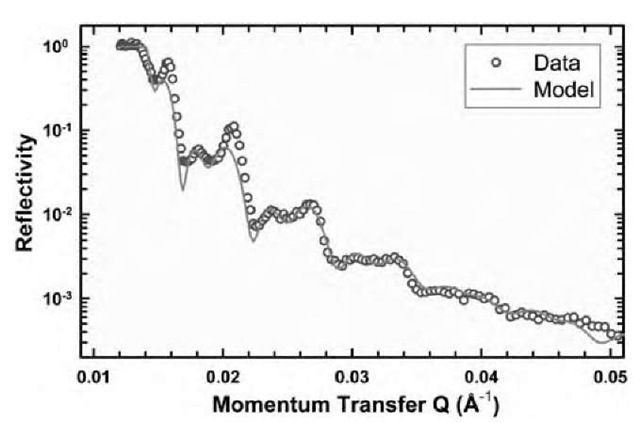
Fig. 3 Specular reflectivity profile and simple modeled fit to data for C12C12DAB 1% w/w solution in D2O at 65°C.
Table 2 Parameters of the optical matrix fit to the scattering from a C12C12DAB 1% w/w solution in D2O at 65°C
|
Layer |
Silicon |
SiO2 layer |
Void 1 |
Layer 1 |
Void 2 |
Layer 2 |
|
sld/(A _ 2) |
2.07 |
3.4 |
- 0.2 |
- 0.2 |
- 0.2 |
- 0.2 |
|
Thickness/ |
n/a |
12.0 |
690 |
170 |
630 |
165 |
|
(A) |
||||||
|
Roughness/ |
5.0 |
5.0 |
40 |
30 |
40 |
30 |
|
(A) |
||||||
|
Solvent/ |
n/a |
0 |
100 |
90 |
100 |
93 |
|
(%) |
RESULTS
Fig. 3 shows a typical specular reflectivity profile for a sample of C12C12DAB (didodecyldimethylammonium bromide) at 1% w/w in solution, together with a simple modeled fit to the data. The parameters of this optical matrix model can be found in Table 2. Several features are immediately clear. The primary feature is the appearance of strong quasi-Bragg peaks in the specular reflectivity profile. These peaks are indicative of a periodic structure extending into solution perpendicular to the surface. The relatively poor definition of the peaks, and the appearance of subsidiary peaks, implies that the structure consists of a limited number of repeats into the solution. In this case, it appears that the pattern is adequately fit through the use of only two layers, but more detailed modeling[1] suggests up to four may be partially complete for this sample. Samples of other DABs show very similar behavior across the same temperature range.
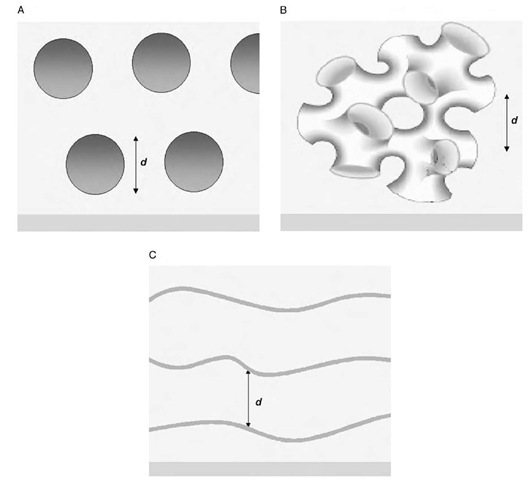
The modeling implies a lamellar structure aligned with the surface, consisting of broad lamellar sheets separated by large solvent-filled voids of the order of 1000 A. Such a pattern may be observed for several morphologies at the surface, which are illustrated in Fig. 4 below.
It is difficult to determine from a perpendicular density profile which of these options is the one occurring at the surface. Each could give rise to a periodic density modulation, as seen in the diagram (where the characteristic repeat distance is marked), and the vertical walls in the sponge and vesicle phases would contribute negligibly to the average SLD across the voids in the structure. A significant point that arises from the fitting is that the periodic repeat layer is of low density (approximately 90% solvent content) and much thicker than the typical bilayer thickness for a bilayer of a C12-surfactant sheet (ca. 20 A). The interlayer spacing is also smaller than that calculated for a simple space-filling lamellar bilayer structure at similar concentrations (ca. 2000 A), implying that this phase does not extend throughout the solution. This coincides with surface force measurements, which do not show any evidence of this phase,[26] implying that the layering detected in reflectometry is either too diffuse, too fragile, or both to be detected by a contact method.
Fig. 4 Possible morphologies giving rise to lamellar layers at the surface. (A) Vesicles aligning at the surface; (B) a sponge phase; (C) lamellar sheets, with the characteristic repeat distance d marked.
These facts can be rationalized differently for each of possible morphologies. For a lamellar system, this observation would be consistent with an undulating bilayer, such that the density of the layer is averaged over the undulation period. This implies undulations of a 100-A amplitude, which is reasonable for a lamellar sheet at this temperature unconstrained by near neighbors. Conversely, for a vesicular system, the low density and thick layers could be explained by a low horizontal packing density of vesicles, as would be expected given their surface charges and the fact that the curved surface of the vesicle is being projected into a planar averaging. Similar arguments could be used for the sponge phase.
Comparison with Bulk Structure
Some guidance can perhaps be gained from a knowledge of the bulk behavior of these surfactants. Phase diagrams have been produced for dichain cationic surfactants of these types,[17,20,27- which show some general features in common. The first is that they all form a vesicular phase at low concentrations (approximately those of the systems described here, namely, of the order of 1% w/w). The stability of these vesicles has been questioned, it being suggested that they do not form spontaneously (requiring some form of energy input to form, such as sonication or shaking[14-) and will spontaneously collapse to a lamellar phase with time.[17- The solutions reported here were indeed sonicated on dissolution, but the structuring at the surface is stable over a period of hours, with no visible changes. Another marked difference between the bulk and the surface is that the vesicles imaged in the bulk phase (e.g., through freeze-fracture electron microscopy) are polydisperse, with radii of 1300±600 A for a solution of C11C12DAB imaged by freeze-fracture TEM.[20- The degree of polydispersity would need to be much lower to give rise to the quasi-Bragg peaks seen in the specular reflectivity profiles measured for these systems.
However, it is also seen that either lamellar or sponge phases can coexist with this vesicle phase. Each of these phases is quite consistent with the simple geometric rationale of surfactant morphologies proposed by Tan-ford[28] and developed by Israelachvili et al.[29] as the packing parameter for the dichain surfactants, ca. 0.6 (varying ±0.01 depending on the chain length), lies in the middle of the range of lamellar-based structures. It appears that the bulk phase of the dichain surfactants is therefore quite complex and appears to be dependent on the precise history of the sample.
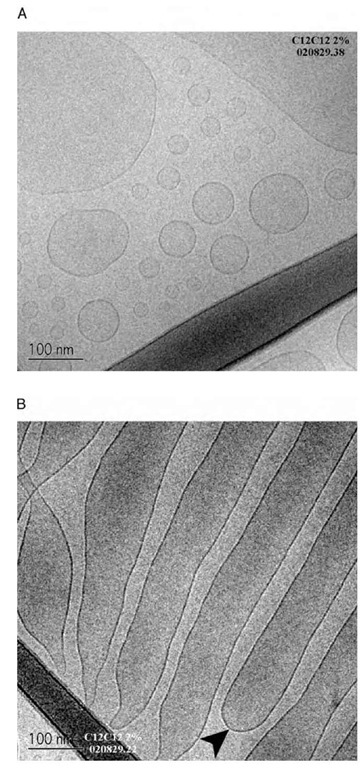
As a result, small-angle scattering and cryo-TEM experiments can be useful to determine the particular nature of these solution phases. Two representative cryo-TEM images are shown below (Fig. 5). These images clearly show that for the same sample, regions of vesicle and lamellar-like structures can be found. Indeed, other images also show that the vesicles and the lamellae were capable of coexisting in the same region. There is no evidence, however, of sponge phase structures found in any of the exposures. The lamellar structures imaged also show that the lamellae seen are not isolated lamellar sheets, but rather appear to be elongated microtubules— connected with a definite interior and exterior (as marked in Fig. 5b).
Although the lack of sponge phase observed in the cryo-TEM does not of itself exclude the possibility of sponge phase being found at the surface (particularly given the nature of cryo-TEM discussed above), it seems that this phase is the least likely of the postulated options. The inherently three-dimensional continuous structure of the sponge phase does not pack well into the highly asymmetric and constrained near-surface region and, as such, would need to show some form of transition from a free bulk sponge phase to a surface phase.
Fig. 5 Cryo-TEM images of C12C12DAB 2% w/w solution flash-frozen from ca. 25°C; A) showing polydisperse unilamellar vesicles in the solution; B) showing the ”extended vesicle” or microtubules. The closure is marked with an arrow. Both images are taken from different areas of the same sample, scale as marked.
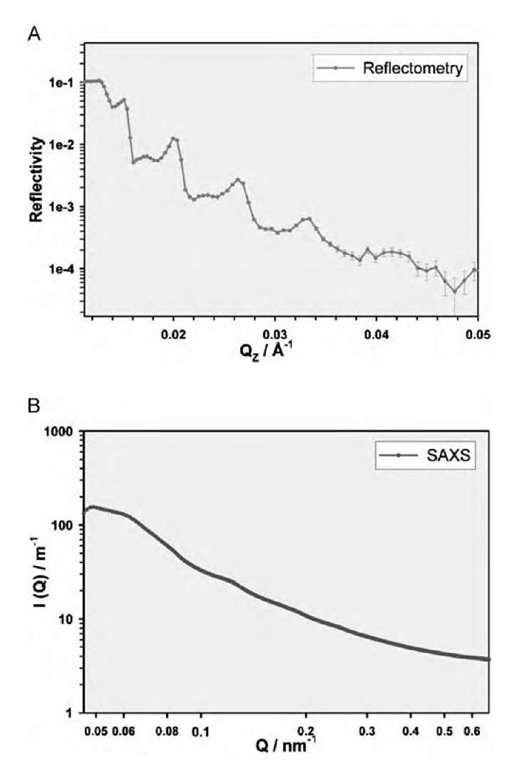
In any case, the small-angle scattering experiments provide evidence that the bulk phase behaves significantly differently to the near-surface phase—direct evidence for the limited nature of the surface-induced structural alterations. Although there is some evidence of a lamellar layering in the small-angle X-ray scattering, the structure is not as pronounced as that found at the surface (see Fig. 6 for a comparison of the structuring found for C12C12DAB, 1% w/w solution, for example) nor does bulk spacing (when observed) correspond to the surface spacing.
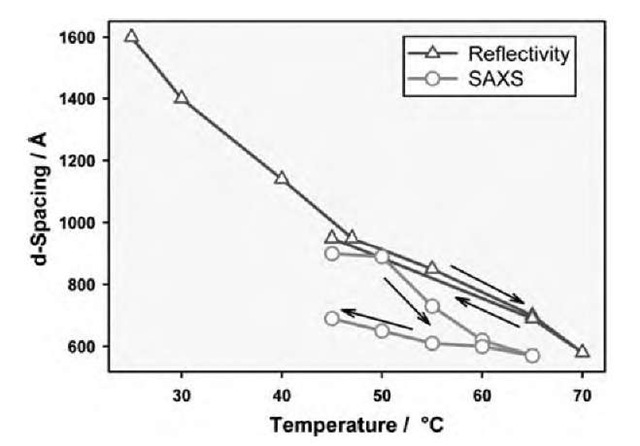
The differences between the bulk and the near-surface are also seen in the temperature response of the two systems. The interlayer spacing of the near-surface phase is highly sensitive to the temperature, generally decreasing with increasing temperature, as seen by the shift in the quasi-Bragg peaks in the scattering (Fig. 7). This type of temperature dependence at the surface has previously been reported for the lamellar phase of a 2% solution of NaAOT (sodium bis(2-ethylhexyl)sulfosuccinate) at the silicon-water interface, where the spacing changes from 270 A at 5°C to 165 A at 35°C.[30] In that system, the change in spacing was attributed to a change in an equilibrium between a micellar and a lamellar phase, where the surface structure was unambiguously lamellar extending thousands of layers into solution.
Fig. 6 Comparison of structuring for C12C12DAB 1% w/w solution at 45°C at the surface and in the bulk solution from A) reflectometry and B) small-angle scattering.
Fig. 7 The change in the d-spacing of the surfactant solution as determined from neutron reflectivity and small-angle scattering. The arrows indicate the direction of the temperature cycles in testing the reversibility of changes.
This change of spacing is reversible over at least a 30°C temperature range, which is also in contrast to the bulk solution, which is shown by small-angle scattering to be only broadly reversible (Fig. 7). This implies that the surface layer is in equilibrium at the surface and also that the time taken for the surface phase to reach this stable position is less than the equilibration time allowed after temperature changes (< 1 hr).
The temperature dependence can again be justified in terms of both the vesicular and lamellar morphologies at the surface. As the temperature increases, the solvation shell of headgroups will decrease, and the degree of ionization of the bilayer will increase—effects which will tend to increase the rigidity of the bilayer and hence decrease the degree of fluctuation-repulsion. However, this effect will be offset by the increased thermal energy of the bilayer and the increased electrostatic repulsion of the more highly charged layers, and the net effect is difficult to predict.
In the case of the vesicular morphology, in particular, attention needs to be given to the manner of how exactly the interlayer spacing might change. The direct implication is that the vesicles themselves change size, achieved either through the smooth aggregation of smaller vesicles to form larger vesicles (equivalently budding material on warming) or the loss of material to free surfactant as the solubility increases with temperature. Simple calculations for C12C12DAB show, for a unilamellar spherical surfactant vesicle, that the decrease in the volume of the bilayer in going from 1100 to 600 A (between 40°C and 70°C) is approximately 70% of the original volume, equivalent to an increase of solubility of the order of 100 times. This is much greater than the predicted change in solubility, which means the former mechanism must be dominant to explain the behavior seen here for spherical vesicles.
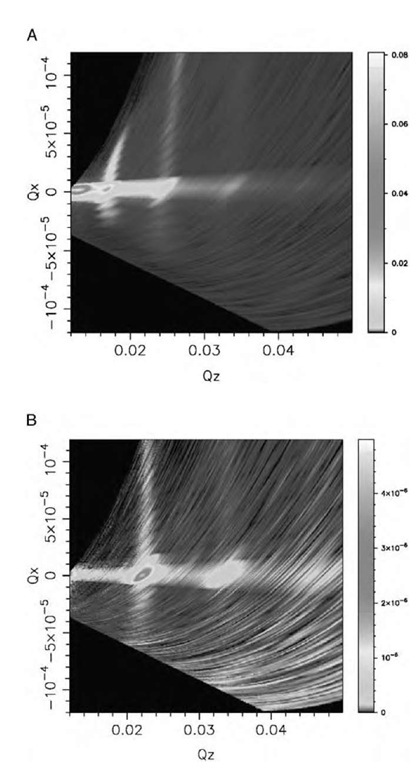
Fig. 8 Off-specular scattering from C12C12DAB 1% w/w in A) D2O and B) CMSi, a mixture of H2O and D2O with a SLD equal to that of silicon crystal (p = 2.07 x 10— 6 A— 2).
Off-Specular Scattering
The samples exhibit significant off-specular scattering associated with the quasi-Bragg peaks, indicative of a degree of lateral ordering. Unfortunately, the length scale of the lateral resolution of the measurements is much larger than the equivalent vertical dimension (micrometers rather than angstroms), which means that any interference patterns on the same length scale as those found in the specular scattering, as might be envisioned from a horizontally ordered vesicular layer, would not be seen.
The scattering which is seen consists of bands of scattering across a range of QX at constant QZ (Fig. 8). The question of whether this is true near-surface scattering, or instead derives from the bulk, can be answered by reference to two features of the scattering—namely, the centering of the off-specular intensity decay on the specular ridge and the appearance of curvature in the bands as a result of refraction in the D2O sample, which is absent in the sample contrast-matched to silicon (CMSi). This is also similar to the pattern seen for NaAOT and is believed to arise from correlated undulations between layers such as might be seen from the natural layer undulations.[31] These undulations might arise from either vesicular or lamellar membranes, but in the case of lamellar sheets, the large distance between the layers begs the question of the source of the correlation between the layers, failing connection between the sheets.
CONCLUSION
While it is clear that the system in question exhibits unusual surface properties, and that there is indeed a near-surface phase which differs from the bulk, it is extremely difficult to distinguish the possibilities that make up the structure. It is known that sponge, lamellar, and vesicular phases can exist in the solution, depending on the individual route of the preparation of the sample, but it is clear from small-angle scattering measurements that the surface is not exhibiting the same characteristics as the bulk. The exact surface density distribution, the temperature dependence of the structure, and the off-specular scattering all provide constraints on the possibilities at the surface, but none of these specifically excludes any of the candidates. A sponge phase seems the least likely because of the complexity of the phase in the dimensionally constrained near-surface region and necessity for the phase to align with the surface. Simplicity suggests that the best candidate for the surface might be a lamellar phase; this, however, represents extremely large spacing for a lamellar phase, and it is difficult then to explain the correlated nature of the undulations seen from the off-specular scattering.
The third choice, vesicles, has its own complications— in particular, that the vesicles would be more monodis-perse than the bulk solution, and that the mechanism for the change in the size of the vesicles with temperature is unclear. Perhaps the most reasonable compromise is suggested by the cryo-TEM images, which show the existence of an intermediary phase between vesicular and lamellar, equivalent to extended vesicles (microtubules). However, it does not seem possible to distinguish these possibilities based on the evidence now available.

