THERMODYNAMIC MODELS FOR PHASE EQUILIBRIUM CALCULATIONS
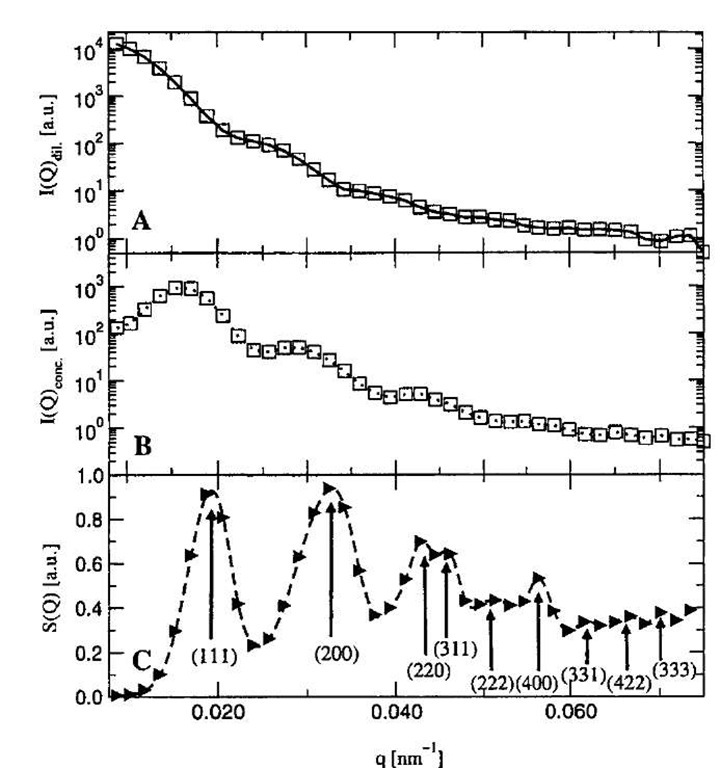
To calculate the phase diagram, we need to have the thermodynamic models for both fluid and crystalline phases, as well as the structure of the crystal. It has been shown before by small-angle neutron scattering measurements that even at low crosslinker concentrations, aqueous dispersions of PNIPAM microgel particles crystallize like hard-sphere liquids.[42] Fig. 5 indicates that the structure factor of the colloidal crystal is well represented by that for a face centered cubic (fcc) structure. Therefore it is reasonable to assume that hard spheres provide a good reference system for representing the thermodynamic properties of microgel dispersions. Because the van der Waals attraction between microgel particles is short-ranged compared to the particle size, a first-order perturbation theory is appropriate for both phases. The higher-order terms are insignificant when the perturbation potential is short-ranged.[58]
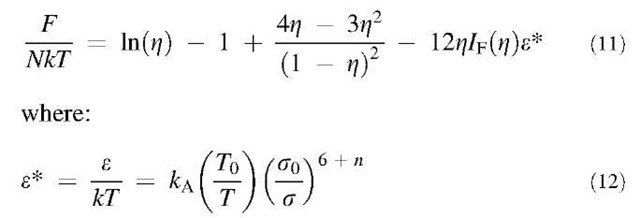
The Helmholtz energy of the fluid phase includes a hard-sphere contribution that is given by the Carnahan-Starling equation of state, and a perturbation that takes into account the van der Waals attraction. In dimension-less units, the Helmholtz energy is given by:
where N represents the total number of particles, Z = ppa3/6 is the particle packing fraction, p is the particle number density, and gHS(r) is the hard-sphere radial distribution function. For convenience, we correlate the integral in Eq. 9 as a function of particle packing fraction using the radial distribution function gHS(r) obtained from the Percus-Yevick equation:[59]
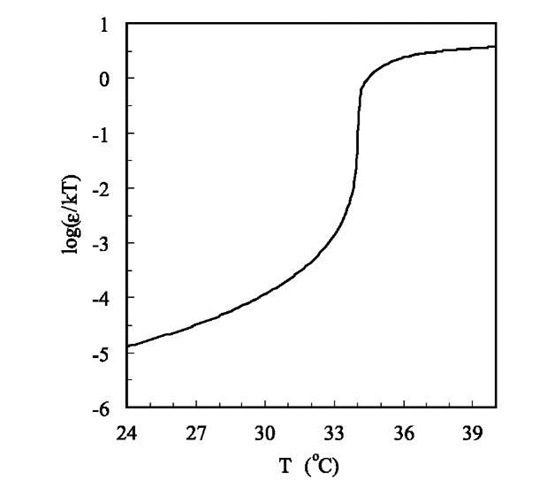
Fig. 4 The reduced energy parameter (e/kT) for interparti-cle potential between PNIPAM particles near the volume transition temperature.
Fig. 5 (A) Neutron scattering profile for a dilute microgel dispersion. (B) Scattering profile for a colloidal crystal of microgel particles. (C) Structure factor of the crystal. The Bragg peaks are interpreted according to the fcc lattice.
The quadric form as given in Eq. 10 is applicable to the reduced density pa3<0.6. Replacement of the integral in Eq. 9 with 1f(z) gives:
Other thermodynamic properties can be derived from Eq. 11 following standard thermodynamic relations.
To describe the thermodynamic properties of the solid phase, we follow a perturbation approach similar to that for the fluid phase. The Helmholtz energy in- cludes a contribution from the reference hard-sphere crystal and a perturbation taking into account the van der Waals attraction:
where gHS(r) is the radial distribution function of the hard-sphere solid. As in a hard-sphere system, an aqueous dispersion of PNIPAM microgel particles forms a face centered cubic lattice in the solid phase even when the particles are at low crosslinking density (”softer” particles).[42]
According to an improved cell theory,[60] the Helm-holtz energy of the hard-sphere solid is given by:
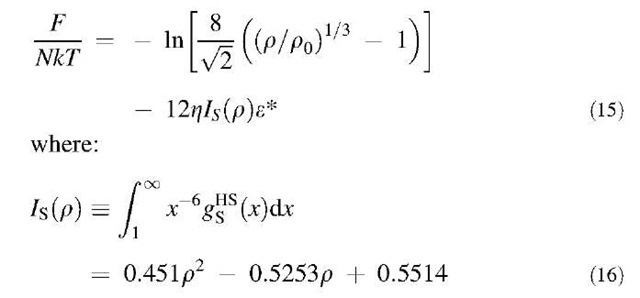
Compared with the original cell model proposed many years ago by Lennard-Jones and Devonshire,[61] the improved cell model introduces a factor of 8, taking into account the fact that the neighboring particles share partially the free space. Unlike the original cell model, the modified cell model provides accurate freezing and melting densities for the fluid-solid transition of uniform hard spheres. The hard-sphere radial distribution function gHS(r) can be calculated using a modified Gaussian model for density distributions.[49] Using the radial distribution function gHS(r) for the hard-sphere solids, we numerically integrate the perturbation term in Eq. 13. The final expression for the Helmholtz energy of the solid phase is given by:
Eq. 16 is applicable for the solid phase with the reduced density 0.95 < pa3 < 1.27.
EQUILIBRIUM PHASE DIAGRAM
Once we have an expression for the Helmholtz energy, the chemical potential m and the osmotic pressure P can be derived following standard thermodynamic relations:
where ”V” stands for the total volume. A fluid-fluid coexistence curve is obtained from the criteria of phase equilibrium:
where ”a” and ”p” designate two distinguishable fluid phases. To calculate the pressure and the chemical potential in the fluid phase, the Helmholtz energy is given by Eq. 11. For each temperature, we solve for equilibrium densities pa and pb using Eqs. 19 and 20. If no solution is found, the temperature is above the critical temperature for fluid-fluid equilibrium; in this case, there is only one fluid phase.
For fluid-solid equilibrium, we also use Eqs. 19 and 20. But now, for phase a, we use Eq. 11 for the liquid-phase Helmholtz energy, whereas we use Eq. 15 for the solid-phase Helmholtz energy for phase p. Again, we search for densities pa and pb that satisfy both equations of phase equilibrium (i.e., Eqs. 19 and 20).
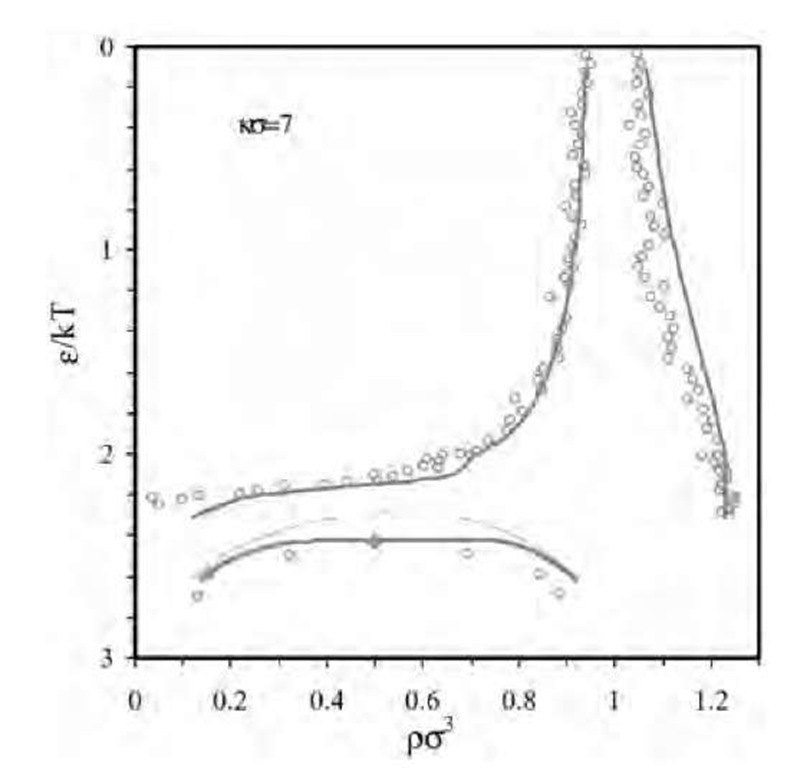
To calibrate the thermodynamic models proposed in this work, we first consider the phase behavior of a Yukawa system that is often used to represent colloidal dispersions with weak attractive interactions. Fig. 6 compares the fluid-solid as well as metastable fluid-fluid coexistence curves from simulation[62] and from the perturbation theory. The agreement is satisfactory except near the critical point of the fluid-fluid equilibrium where the long-range fluctuations become significant. An improved prediction in this region can be achieved by applying the renormalization group theory.[63] Fig. 6 indicates that at high temperature, the system is dominated by short-range repulsion and it exhibits freezing transition similar to that for hard spheres, whereas at low temperature, freezing occurs at dilute conditions and is separated by a metastable liquid-liquid equilibrium.
Fig. 6 The phase diagram of a typical colloidal system with weak attractive forces. The points are from simulation data for Yukawa potential.
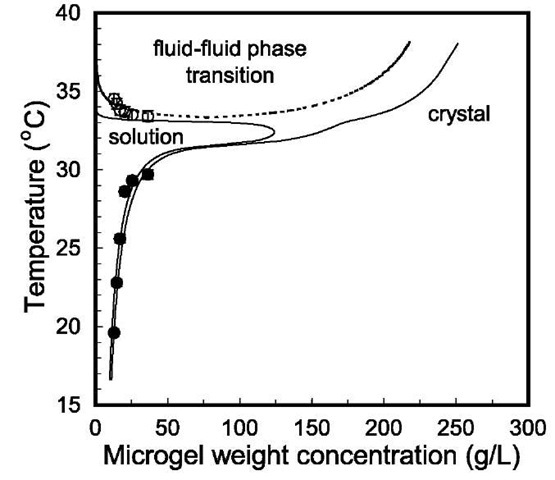
Fig. 7 The phase diagram of aqueous dispersions of PNIPAM particles determined from turbidity measurements (symbols) and from the thermodynamic perturbation theory with an empirical correction of temperature (lines). The filled and open circles represent the melting and the second phase separation temperatures, respectively.
Fig. 7 shows the calculated phase diagram of PNIPAM microgel dispersion using the first-order perturbation theories for fluid and solid phases. Also shown in this figure are results determined from a UV-VIS spectrometer. In this calculation, the calculated temperature is rescaled empirically by T = T(15/Rg)0 005 to match the experimental results quantitatively. The discrepancy is probably because of the slight size difference 2 nm) between the microgel samples used in light scattering and in phase diagram measurements. Nevertheless, the theory and the experiment agree, as least semiquantitatively.
The phase diagram shown in Fig. 7 differs drastically from that of a conventional colloidal dispersion, or that of a colloid polymer mixture.[64] Below the volume transition temperature, the coexistence phases at the freezing and melting points have close particle densities, similar to that observed in a hard-sphere system. However, above the volume transition temperature, fluid-solid transition spans over a wide gap of particle concentrations. At high temperature, the fluid phase at the freezing point is highly dilute, whereas the solid phase at the melting point is highly concentrated. Interestingly, this phase diagram indicates that the microgel dispersion can freeze at temperatures both above and below the gel volume transition temperature. For instance, according to this phase diagram, a microgel dispersion with 7 g/L particle concentration is in the fluid state at 34.5°C; it becomes a solid of similar density when the temperature drops to about 34°C, and the dispersion will be separated into a dilute solution and a solid of much higher density (about 17 g/L) at about 35.3°C. The dashed line in Fig. 7 shows a metastable fluid-fluid coexistence curve with a low critical solution temperature. This coexistence curve is reminiscent of that for an aqueous solution of uncrosslinked PNIPAM polymer. Because of strong hydrogen bonding with water molecules from CO and NH groups, PNIPAM can be dissolved in water at low temperature. In this case, the isopropyl groups along the PNIPAM chain are caged by water molecules. When the temperature is increased, the cages of water molecules are partially melted, resulting in entropy increases. As a result, on increase of the temperature, the hydrophobic attraction caused by the iso-propyl groups and the polymer backbone become more important and the solubility of PNIPAM in water drops.
KINETICS OF CRYSTALLIZATION
As shown in Fig. 3, light scattering measurements indicate that when the particles are in the swollen state, the osmotic second virial coefficients of PNIPAM microgel dispersions are essentially the same as those for hard spheres. The nucleation kinetics confirms further that the swollen PNIPAM particles behavior like hard spheres. We find that the kinetics of microgel crystallization can be represented quantitatively by the classical nucleation theory (CNT).
The classical theory of nucleation and crystal growth has been adapted by Russel[65] to hard-sphere colloids, and extended and evaluated numerically by Ackerson and Schatzel.[66] According to the CNT,[67] the crystal nu-cleation rate per unit volume I depends exponentially on the Gibbs energy barrier in the formation of a critical nucleus AGcrit:
where the kinetic prefactor Z is usually expressed as Af 5/3(1 – f/f g)2 6, where A is a constant independent of the particle volume fraction f, and f g is the glass transition concentration. The critical Gibbs energy of nucleation is related to the difference in the chemical potentials of the solution and the crystal Am, the solution-solid interfacial tension g, and the number density of the crystalline phase ps:
In most applications of the CNT to analyze crystal nucleation experiments, the parameter A in the kinetic prefactor and the interfacial tension are treated as adjustable variables.
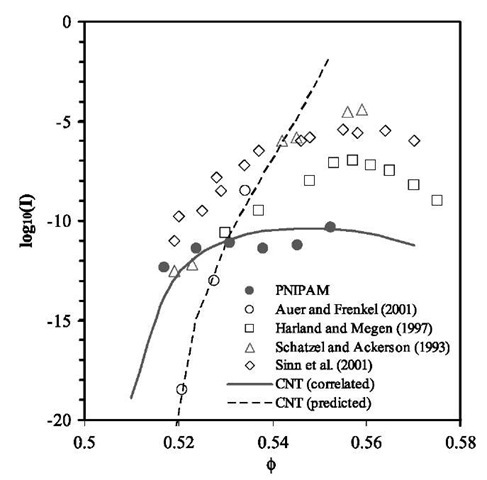
In Fig. 8, we compare the rate of nucleation per unit volume in the microgel dispersion investigated in this work with previous studies for hard-sphere-like col-loids.[7,68-70] Also shown in Fig. 8 are calculated results from CNT using A and g as adjustable parameters, as well as the predictions of CNT with the kinetic prefactor and the fluid-solid interfacial tension obtained from Monte Carlo simulations.[71] In these calculations, the chemical potentials of the fluid and solid phases are calculated from Eqs. 11 and 15. Fig. 8 indicates that although the rate of nucleation for microgel dispersions is close to previous investigations on well-established hard-sphere-like colloids and it agrees well with CNT using log10(A) = — 5.96 and g/kBT =0.45, it significantly deviates from simulation results for hard spheres. Similar observations have been reported by Schatzel and Ackerson for crystallization kinetics in a model hard-sphere system consisting of poly-methyl methacrylate particles coated with a thin layer of hydroxystearic acid suspended in a mixture of decalin and tetralin.[68]
Fig. 8 The nucleation rates per unit volume as a function of the particle volume fraction in an aqueous dispersion of PNIPAM microgel particles and in various hard-sphere systems. The solid line is calculated from CNT with the prefactor A and the fluid-solid interfacial tension g as adjustable parameters. The dashed line is the prediction of the CNT using A and g from Monte Carlo simulation.
CONCLUSION
The volume transition of PNIPAM particles significantly affects the interaction potential and determines a novel phase diagram that has not been observed in conventional colloids. Because both particle size and attractive potential depend on temperature, PNIPAM aqueous dispersion exhibits phase transitions at a fixed particle density by either increasing or decreasing temperature. At low temperature, freezing occurs at large particle volume fractions, similar to that in a hard-sphere system; whereas at high temperature, the freezing occurs at low particle concentration, driven by the strong van der Waals attraction caused by the collapsed microgel particles. Although the kinetics of nucleation in PNIPAM microgel dispersions is similar to that for hard-sphere-like colloids, it deviates significantly from the prediction of the CNT using the kinetic prefactor and the fluid-solid interfacial tension obtained from recent simulations for the crystal nucleation of hard spheres.
In many aspects, the phase behavior of colloidal dispersions reassembles that for simple fluids. However, a noticeable difference is that unlike the vapor-liquid equilibrium of a simple fluid, the equilibrium between a dilute and a concentrated colloidal dispersion is often metastable. Although that difference, arising for the short-ranged solvent-mediated attraction between colloidal particles, is now well-documented, not much attention has been given to other features that are unique in colloidal systems. Temperature-dependent potential, as shown in this work, is special in colloidal systems. Because the interparticle potential is strongly temperature-dependent, the phase behavior of PNIPAM dispersions differs remarkably from that for simple fluids or for conventional colloids. In future work, it might be interesting to investigate other features that are special to colloidal dispersions, including the multibody effect on the phase behavior and dissimilarity of interparticle potentials in different phases.

