The Scatchard plot is a graphical method of analyzing equilibrium ligand binding data (1). It is used to determine the number of ligand-binding sites on a receptor, whether these sites show cooperative interactions, whether more than one class of site exists, and the respective affinities of each site. The experimental parameters used for a Scatchard plot are the free ligand concentration [L] and the average number of ligand molecules bound to a receptor, n, at a particular ligand concentration at equilibrium. The formal definition of n is
where n is the maximum number of ligands that can bind and [R-] is the concentration of the receptor species with i ligands bound. In the simplest case, of a receptor with a single class of noninteracting sites, receptor-ligand binding follows the Scatchard equation:
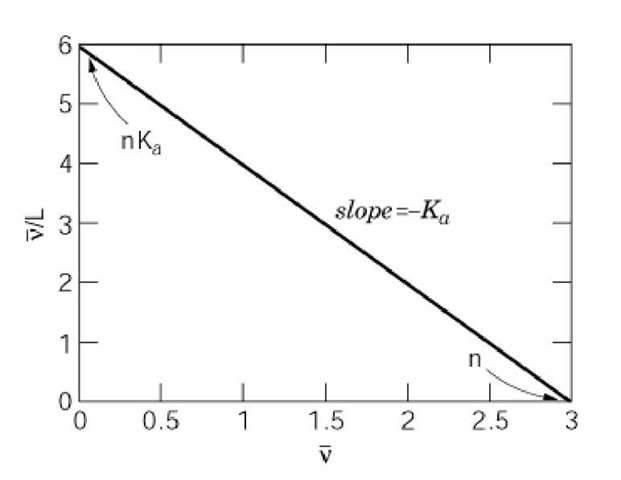
A linear plot results, as shown in Figure 1. The intercept on the abscissa equals the total number of binding sites in the receptor, and the slope equals -K where Ka is the intrinsic equilibrium association constant.
Figure 1. Scatchard plot for a receptor with three equivalent, noninteracting ligand-binding sites.
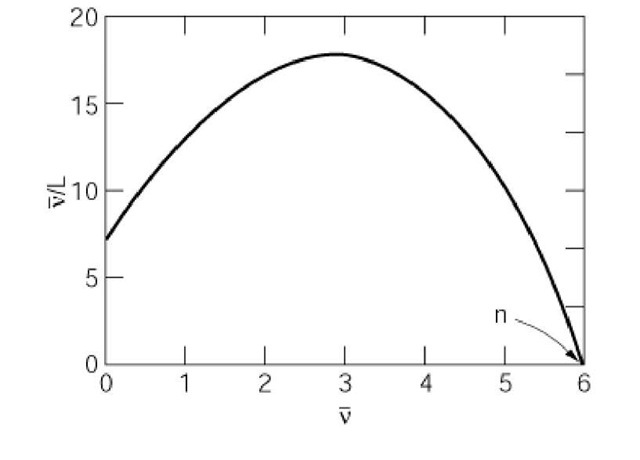
Nonlinear Scatchard plots are diagnostic of several more complex types of ligand-receptor interaction. A plot that is concave downward indicates positive homotropic cooperativity between binding sites on an allosteric receptor. An example is shown in Figure 2. The abscissa intercept again equals the maximum number of binding sites. The curvature of the plot corresponds to the degree of cooperativity in the system studied, but it is difficult to obtain an experimentally meaningful parameter from the curvature by inspection. Nevertheless, the linearity of Scatchard plots is very sensitive to cooperative interactions, and the downward-concave form of the plot in Figure 2 is considered diagnostic of allosteric proteins.
Figure 2. Scatchard plot for a receptor that exhibits cooperative ligand binding. The example illustrates a molecule that follows the Monod-Wyman-Changeux concerted model of allostery, with six binding sites and 10-fold preferential binding to the R state.
A second type of nonlinear Scatchard plot arises when multiple classes of binding sites with distinct affinities are present on a receptor. For receptors with multiple (m) classes of noninteracting sites, the Scatchard equation becomes a sum:
where n- and Kj are the number of sites and association constant of the jth class. The corresponding
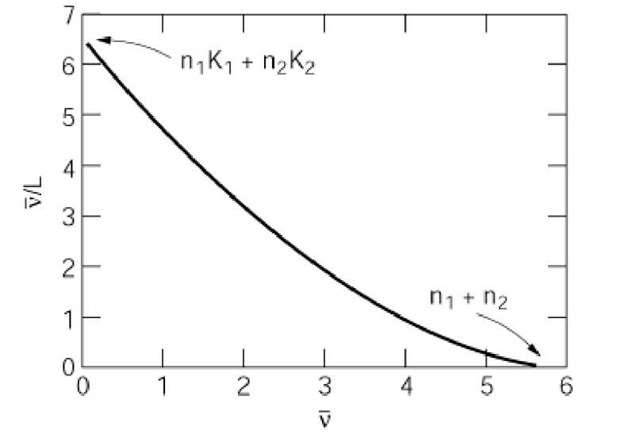
Scatchard plot (Fig. 3) is multiphasic, superficially resembling a linear combination of simpler plots. The abscissa intercept equals the total number of binding sites on the receptor, but further interpretation of multiphasic Scatchard plots is difficult.
Figure 3. Scatchard plot for a receptor with two classes of ligand binding sites, three high affinity, and three low affinity sites. The sites do not interact, and the affinities differ by a factor of 10.
Several limitations of Scatchard analysis have been recognized. One is that n and n/[L] both contain experimental errors; hence calculating the slope and intercept of a linear Scatchard plot by simple least squares is not statistically valid. A better approach for statistical analysis is to fit n as a function of [L] directly to the equation for a binding model (2). In addition, nonlinear Scatchard plots are notoriously difficult to interpret. Scatchard analysis amplifies the prominence of binding data obtained at low ligand concentrations. These data can distort extrapolations to the total number of binding sites that will be filled at a saturating ligand concentration (3). Another source of overinterpretation stems from the fact that binding behavior consistent with multiple classes of sites is also consistent with other binding models (4). In the case of multiphasic plots like that in Figure 3, discerning the true molecular properties of a receptor requires independent experiments, in addition to Scatchard analysis.
![tmp127-104_thumb[1] tmp127-104_thumb[1]](http://what-when-how.com/wp-content/uploads/2011/05/tmp127104_thumb1_thumb.jpg)


![tmp127-108_thumb[1] tmp127-108_thumb[1]](http://what-when-how.com/wp-content/uploads/2011/05/tmp127108_thumb1_thumb.jpg)

