The dot plot, introduced by Gibbs and Mclntyre (1), is a two-dimensional visual comparison method, useful for revealing regions of similarity between pairs of sequences or structures (2). Typically, the X axis represents one sequence and the Y axis represents the other. Every point in the plot is then scored for the similarity of the residue in sequence X with the similarity of the residue in sequence Y, and the point is plotted if the residues are scored as similar in a residue substitution matrix. Diagonal lines in the plots then indicate regions where consecutive residues are scored as similar. Insertions and deletions (Indels) are revealed by termination of a diagonal segment, followed by initiation of a new but offset diagonal. To improve the signal-to-noise ratio, it is usual to sum the scores in short windows spanning each residue: overall, fewer points are plotted, but divergent matches with rather few identities can be revealed. Cutoffs determining which points are plotted may be set using a variety of heuristic or probabilistic measures. The "double matching probability," introduced by McLachlan (3), is an estimate of the likelihood that the given score would arise by chance in two infinitely long sequences and is widely used to provide the scale for plotting points. The user can then choose the significance level cutoff to determine which points to plot.
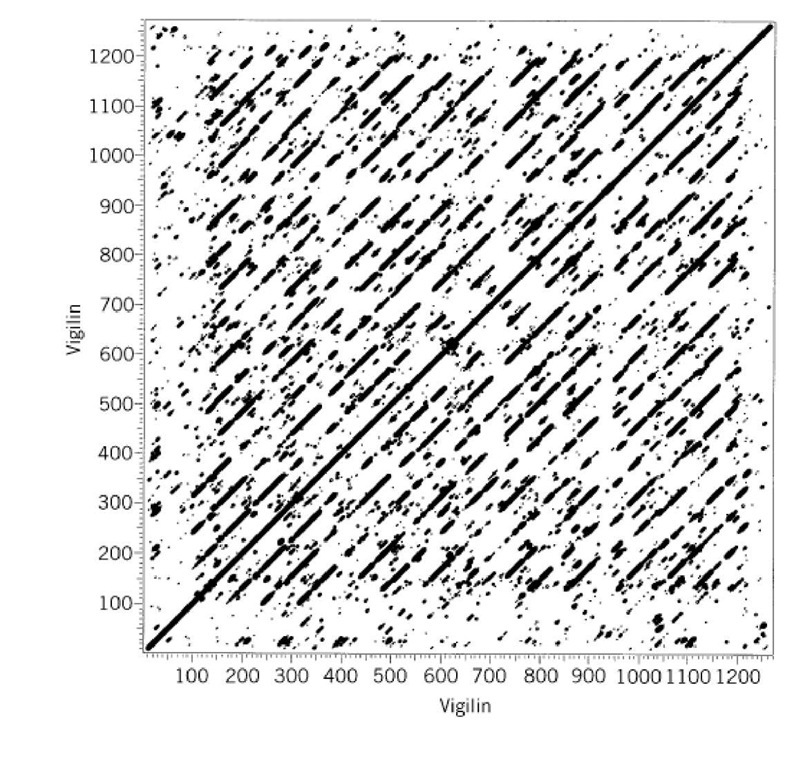
Dot plots can reveal recurring similarities within a sequence by self-comparison. In this case, repeated sequences appear as a series of off-center partial diagonals. Tandem Repeatsresult in a regular set of diagonals, consecutively decreasing in size by one repeat, moving away from the central diagonal (Fig. 1). Dispersed repeats also provide dispersed diagonals, one between each repeat element.
Figure 1. Dot plot showing 15 tandemly repeated KH domains in the chicken vigilin sequence. The larger the dots, the higher the matching segment score. A break in the diagonals spanning position 940 indicates a ~ 40-residue insertion in one of the domains.
Dot-plot self-comparisons can be used to reveal elements of double-stranded secondary structure in folded RNAs. In the simplest case, points are plotted whenever a pair of residues are able to base pair. More sensitive dot-plot algorithms use energy rules based on base pairing, base stacking, bulging, and looping, allied to dynamic programming algorithms (4). Therefore diagonals indicate runs of complementary residues able to form double helices . Looped out bases, which often occur in RNA secondary structure, are indicated by short offsets in consecutive diagonals.
Another variety of dot plot (5) may be used to compare two protein tertiary structures for regions of similarity, although interpretation is more complex. In this case, the plotted points typically represent distances between Ca carbons, so the plots are also known as distance plots or contact maps. Characteristic recurring patterns indicate secondary structure elements such as a-helices and b-strands. Long-range contacts are distributed irregularly in the plot. A useful automatic method to detect structural similarities by analyzing and superposing sets of self-contact plots has been implemented in the program Dali available on the WWW (6).
Dot plots are sometimes used in other ways for presenting sequence or structure information. For example, contact plots are a convenient way to summarize the residue contacts revealed in a structural investigation by nuclear magnetic resonance (NMR).

