11.9.
A numerical assessment is assigned to indicate the degree of smoothness (roughness) in a number of ways. In practice three roughness measures have shown themselves to be particularly useful.
11.9.1.
Maximum Peak to Valley Height of Roughness.
This is obviously the most common measure of roughness but is not by any means a complete definition of roughness, e.g. in the two cases in Fig. 11.13 peak to valley height is same, but frequencies of irregularities
are different and second surface is more rough in comparison to first one. But, since this is a relatively simple method of analysis, this will be a satisfactory measure
![]()
Fig. 11.13. Peak to valley height.
where it is desired to control the cost of finishing for checking the rough machining. This method is also very advantageous in cases where the condition of surface is likely to exert an important influence on such properties as fatigue resistance and it is intended to clear the surface of the irregularities left by a previous operation.
11.9.2.
Root Mean Square Value (R.M.S. Value).
This measure was in use previously and now-a-days superseded by Centre Line Average measure, as latter has the properties of
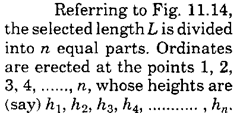
being easily measured. R.M.S. value is defined as the square root of the mean of the squares of the ordinates of the surface measured from a mean line.

![]()

Fig. 11.14. R.M.S. value.
11.9.3.
Centre Line Average Method (C.L.A. Value).
This is defined as the average height from a mean line of all ordinates of the surface regardless of the sign.
![]()
But of find C.L.A. value like this will be a laborious job. Also by this method, spacing chosen may be such that important ordinates are likely to be missed.
Things can be much simplified by using a planimeter which can find out the area of any curve. Referring to Fig. 11.15, let us say that somehow or other the mean line is exactly known. Then C.L.A. value
![]()

Fig. 11.15. C.L.A. value.
One has to take care of units carefully to find the C.L.A. value in micron.
11.9.3.1.
How to Determine Mean Line.
For it first the mean line is estimated by eye-judgement. Then total area above and below the assumed mean line are measured and a correction is applied to the assumed mean line to get the correct mean line. Error [IA (above) - IA (below)]/L is applied to the assumed mean line to get the. correct mean line. Thus in Fig. 11.16, X’ Y is assumed mean line.

Fig. 11.16. Mean line.
![]()
the assumed line algebraically gives the actual mean line. The C.L.A. value can be found out as described previously.
“Talysurf’ has got built in arrangement for integrating the areas and the average value is directly given.
C.L.A. value does not give any idea regarding the greatest extent and the nature of the surface irregularities. It is likely to give identical values for surfaces of vastly different characteristics. So this is the main disadvantage of C.L.A. value. But when the characteristics of a surface have been found out to be satisfactory and such conditions are produced which do not allow the surface to change radically in manufacturing, then C.L.A. value provides a workable control.
