Sleep Diary and Actigraphy
Before the polysomnography, participants were asked to fill in a sleep diary and wear an actigraphy during the night for 2 weeks, to check for irregular sleep-wake schedules. The morning after the polysomnography, all participants were asked to fill in a morning questionnaire evaluating their night in the sleep lab, consisting of the Brussels Indices of Sleep Quality (BISQ) and a PSAS. Following variables were calculated from the sleep diary: Total Sleep Time (TST), Sleep Latency (SOL), Wake after sleep onset (WASO), Sleep Efficiency (SE), and Time in Bed (TIB).
Wake EEG
All participants underwent a full-cap EEG measurement using the Cognitrace (A.N.T.) the evening they came to the laboratory for their sleep night. 19 electrodes were placed according to the international 10-20 system (Fp1, Fp2, F3, F4, F7, F8, Fz, C3, C4, Cz, P3, P4, Pz, T3, T4, T5, T6, O1, O2) and were averaged referenced online. An EOG and EMG submentalis were added to exclude artifacts of eye movements or muscle activity. Sampling rate was 256 Hz and impedances were kept below 10 kOhm. A 5 minute measurement with eyes open and eyes closed was performed. A Fast Fourier Transformation (FFT) Analysis was performed on the wake EEG on a minimum of 90 seconds artefact-free data using Neuroguide software (Applied Neuroscience, Inc.). The spectrum was divided into the following EEG frequency bands: delta (1-3.5 Hz), theta (4-7.5 Hz), alpha (8-12 Hz), beta1 (12-15 Hz), beta2 (15-17.5 Hz), beta3 (18-25 Hz), and high beta (25.5-30 Hz). Both absolute and relative values were calculated and a log transformation was performed to counter normality issues.
Polysomnography
A polysomnography was performed at the experimental sleep laboratory at the Vrije Universiteit Brussel. In accordance with the studies of Perlis et al. [66, 67] analysis were performed on the first screening night. The recording montage consisted of 3 EEG electrodes referenced to a single mastoid (F3-A2, C4-A1, O1-A2), 2 EOG electrodes referenced to a single mastoid (LOC, ROC), a bipolar submentalis EMG, tibialis EMG, and EKG. A 32 channel Embla N7000 recording system was used (Medcare) with a DC offset of 500 mV max and a fixed DC low cut filter at 0.3 Hz. The signal was digitized at a sampling rate of 500Hz using Somnologica Software. The EEG and EOG signals were high pass filtered at 0.5 Hz and low pass filtered at 40 Hz, EMG channels were high pass filtered at 5 Hz and low pass filtered at 70 Hz. All data was scored in 30-second epochs according to the Rechtschaffen & Kales [88] rules by a trained specialist, unaware of group allocation. Outcome variables were Total Sleep Time (TST), Sleep Onset Latency (SOL) defined as lights out to the first minute of stage 1 sleep, Wake After Sleep Onset (WASO), Sleep Efficiency (SE), % Slow Wave Sleep (SWS) of the Sleep Period Time (SPT), % REM sleep of the SPT, % Stage 1 sleep (S1) of the SPT and % Stage 2 sleep (S2) of the SPT. Furthermore, the arousal index defined as the amount of arousals (3-15 seconds) per hour and number of awakenings was calculated. Additionally, the EMG level (Root Mean Square ^V) of the first period of wakefulness during the sleep onset period was also analyzed as a measure of baseline tension level. Movement artefacts were excluded from analysis.
Spectral analysis was performed on C4-A1 to evaluate both the sleep onset period (SOP) and NREM and REM sleep. SOP was defined as lights-out to the first 5 minutes of stage 2 sleep [60]. Artefacts were removed and the SOP was divided into four quartiles to evaluate the EEG dynamics. FFT analysis was performed using Neuroguide software (Applied Neuroscience, Inc.), in which standard EEG frequency bands were defined: delta (1-3.5 Hz), theta (4-7.5 Hz), alpha (8-12 Hz), beta1 (12-15 Hz), beta2 (15-17.5 Hz), beta3 (18-25 Hz), and high beta (25.5-30 Hz).
Regarding the sleep EEG, all epochs containing movements, EMG artefacts, sleep stage transitions or arousals (3-15sec) were excluded from analysis. All artefact-free epochs underwent high-pass filtering and hanning windowing followed by Fast Fourier Transformation in 2-second epochs. Delta (0.5 – 3.5 Hz), theta (4 – 8 Hz), alpha (8.5 – 12 Hz), sigma (12.5 – 16 Hz), beta (16.5 – 30 Hz) and gamma (30.5 – 60 Hz) were the analysed frequency bands. Analyses were performed using Somnologica Science software and data was exported to an excel file. The definition of NREM and REM cycles was adopted from the study of Perlis and colleagues [67]. Relative power spectra were calculated by dividing each frequency band by the calculated total power (sum of power of all frequency bands).
Arousal Parameters
The somatic subscale of the PSAS will be used as a measure of subjective physiological arousal, both retrospective, as well as during their stay in our sleep laboratory. Secondly, EMG levels during sleep onset, as well as a cortisol sample the evening of the scheduled polysomnography will be used as an objective measure of physiological arousal. The cognitive subscale of the PSAS will be used as a measure of subjective cognitive arousal. Finally, an evaluation of cortical arousal reflected by the spectral profile of the wake and sleep EEG (SOP-NREM-REM) will be performed.
Procedure
Before the polysomnography, participants were asked to fill in a sleep diary and wear an actigraphy during the night for 2 weeks, to check for irregular sleep-wake schedules. Subjects came to our sleep lab for the first PSG measurement at the Vrije Universiteit Brussel. They came in around 8:00 pm and received information on the procedure of the evening and purpose of the measurement. Around 8:15 pm the EEG measurement in an experimental room was started. During the eyes open condition, subjects were asked to keep their eyes fixed on a white dot on the floor, approximately 1.5 m from their seat to minimize eye movements. In the eyes closed condition, subjects were asked to visualize the same white dot and try to keep their eyes as still as possible. Afterward the electrodes for the night were applied. Around 10:30 pm cortisol measurement was performed through a saliva sample. Subjects went to bed between 10:30 pm and 12:00 pm, depending on their usual bedtime. Time in bed was approximately 7 hours and 30 minutes and was kept stable for every subject. The next morning they were asked to fill in the Brussels Indices of Sleep Quality (BISQ) and PSAS to monitor their subjective sleep quality.
Statistical Analysis
Statistical analysis was performed using STATISTICA 8.0 software. Normality and homogeneity of variances were checked before analysis. To evaluate differences regarding clinical, demographical, PSG and sleep diary data an independent samples t-test was performed. If one of the assumptions was violated, a Mann-Whitney U test was used.
The wake EEG was evaluated using a 2×19 repeated measures ANOVA for every EEG frequency band, using group (insomnia vs. controls) as a between subject variable and electrode location (19 locations) as a within subject variable. A 2×4 repeated Measures ANOVA was used for the SOP, with group (insomnia vs. controls) as a between subject variable and quartile as a within subject variable. The first 3 NREM and REM cycles were also examined using an 2×3 repeated measures ANOVA with group (insomnia vs. controls) as a between subject variable and NREM/REM cycle as a within subject variable. The calculated effect size for the repeated measures ANOVA is partial-eta squared (np2). Finally, in order to examine possible associations between sleep and arousal, a Spearman Rank correlational analysis was performed.
Results
Clinical Characteristics
In addition to the data presented in table 1, our insomnia subjects reported significantly more anxiety, both as a state and trait characteristic (STAI-1: z = 2.81; p.<.005; STAI-2: z = 2.13; p.<.05). They reported increased presleep cognitive arousal during the past month in comparison to the control group (z = 2.24; p.<.05). No difference was found for somatic presleep arousal. Furthermore, state anxiety correlated significantly with PSAS-SOM (rs=.60) and PSAS-COG (rs=.51) in insomniacs, which was absent in healthy sleepers.
Objective and Subjective Sleep Parameters
Results from the polysomnography and sleep diaries are displayed in Table 2 (A). Objective sleep parameters show that the group of insomnia patients was characterized by significant objective disruptions of sleep.
Table 2. Objective and subjective sleep parameters
*indicates significant difference with control group (p. < .05)
It took them longer to fall asleep (z = 2.79; p.<.01; r = .51), they spend more time awake during the night (t(27)=3.06; p.<.005; r = .50), had less TST (t(27)=-2.51; p.<.05; r = .43) and a decreased SE (t(27)=-3.07; p.<.005; r = .50). Regarding sleep architecture, no significant differences were observed, except for a decreased REM sleep % (t(27)=-2.83; p.<.01; r = .47) in comparison to the group of healthy sleepers. Sleep was more fragmented in insomnia patients reflected by more awakenings (z = 2.09; p.<.05; r = .38) and a higher arousal index (z = 3.70; p.<.0005; r = .68). The morning after the PSG, subjects were asked to evaluate their sleep by filling in the BISQ, which revealed significant differences between both groups (Table 2 B). Insomnia patients reported longer SOL (z = 4.13; p.<.00005; r = .80), more WASO (z = 3.96; p.<.0001; r = .73), less TST (z = -3.85; p.<.0005; r = .71) and a decreased SE (z = -4.18; p.<.00005; r = .77). As was hypothesized, insomnia patients were characterized by a greater discrepancy between objective sleep parameters and perception of sleep (Table 2 C). They overestimated SOL by approximately 55 minutes (z = 2.74; p.<.01; r = .50) and WASO by an average of 41 minutes (z = 3.96; p.<.005; r = .52), while TST was underestimated by an average of 73 minutes (z = -3.63; p.<.0005; r = .67).
Cognitive and Physiological Arousal
To evaluate the two arousal components described by the behavioral model, our subjects completed the PSAS the morning after the PSG recording as a measure of subjective cognitive and physiological arousal. Results show that our insomnia sample reported significantly more cognitive arousal (z = 2.91; p.<.005; r = .54) during the SOP, but no increased physiological arousal was indicated. Markers for objective physiological arousal were obtained by a cortisol sample the evening of their stay in our laboratory, and analysis of the EMG level during the SOP. No indications of objective physiological arousal were found (table 3).
Table 3. Cognitive and physiological arousal.
*indicates significant difference with control group (p. < .05)
Cortical Arousal: Wake EEG, SOP and NREM/REM Wake EEG
To assess the possibility of increased cortical arousal in the evening outside the bedroom, a wake EEG was performed. A 2×19 repeated measures ANOVA revealed no differences between insomnia patients and healthy controls.
The SOP
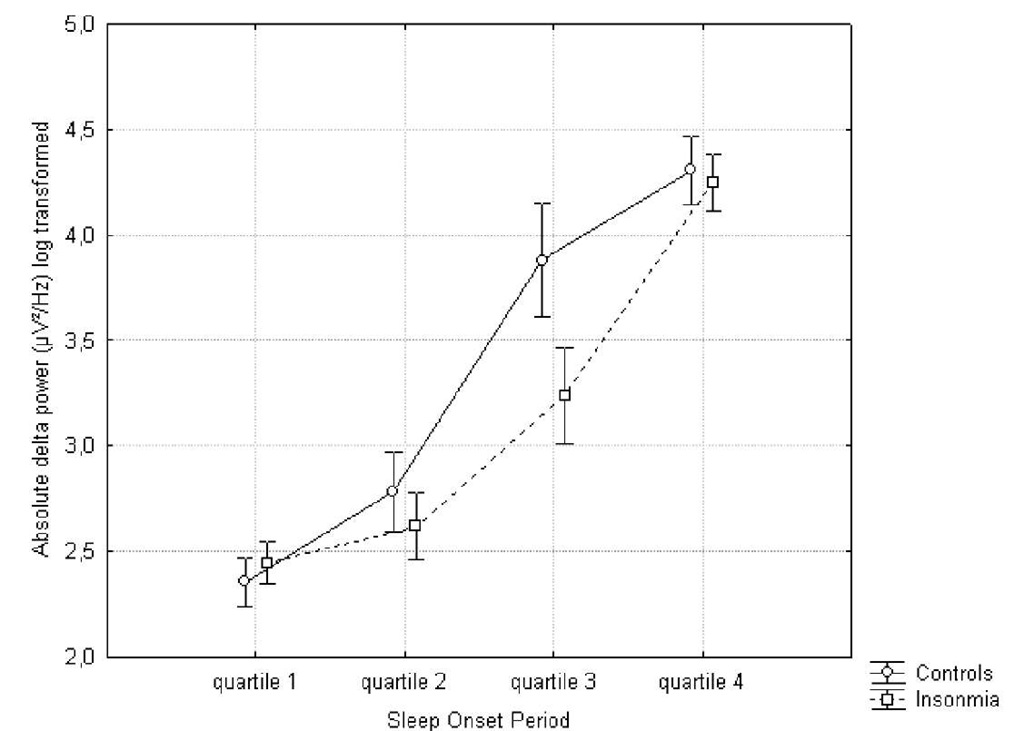
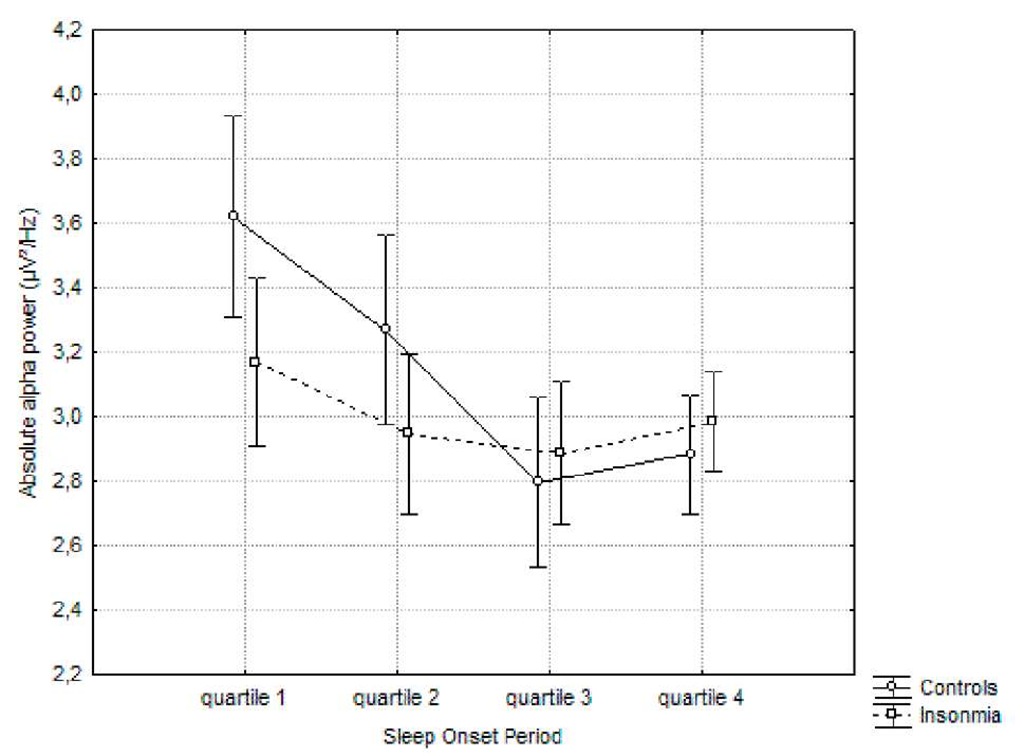
The SOP defined starting from lights-off to the first 5 minutes of stage 2 sleep was divided into 4 quartiles to evaluate the specific EEG dynamics between insomniacs and healthy controls. A 2×4 repeated measures ANOVA was performed for both relative and absolute power in 7 frequency bands. For all frequency bands, a main effect for quartile was observed. Absolute delta (F(27)=105.74; p.<.0000001; np2 = .79) and theta (F(27)=41.67; p.<.0000001; np2 = .60) and beta1 (F(27)=13.27; p.<.0000001; np2 = .32) power increased from the first to the last quartile, alpha (F(27)=9.20; p.<.00005; np2 = 25) , beta2 (F(27)=8.29; p.<.0001; np2 = .23), beta3 (F(27)=40.10; p.<.0000001; np2 = .59) and high beta (F(27)=26.26; p.<.0000001; np2 = 49) decreased. A small but significant group x quartile interaction effect was found for absolute delta![]() and alpha
and alpha
Figure 1. Evolution of the absolute delta power during the sleep onset period. A log transformation (ln) was performed.
Post-hoc Tukey showed that the controls had a steeper and faster increase in delta power (quartile 2 vs. quartile 3: p.<.0005; no significant difference between third and fourth quartile) in comparison to the insomnia group (significant difference between quartile 2 and 3: p.<..005; quartile 3 and 4: p.<.0005). In regard to the absolute alpha power, no significant difference between all quartiles was found for the insomnia group, whereas the controls showed a gradual significant decrease (quartile 1 versus quartile 3 and 4: p.<0005).
No significant differences were found for the beta EEG frequency bands.
Regarding the relative power, similar results were found: a significant main effect for quartile were delta![]() and theta (F(27)=17.17;
and theta (F(27)=17.17;
![]() power increases during SOP, while all other frequencies showed a decrease
power increases during SOP, while all other frequencies showed a decrease![]()
![]() high
high![]() Again, a significant interaction effect was found for relative delta
Again, a significant interaction effect was found for relative delta![]() and alpha
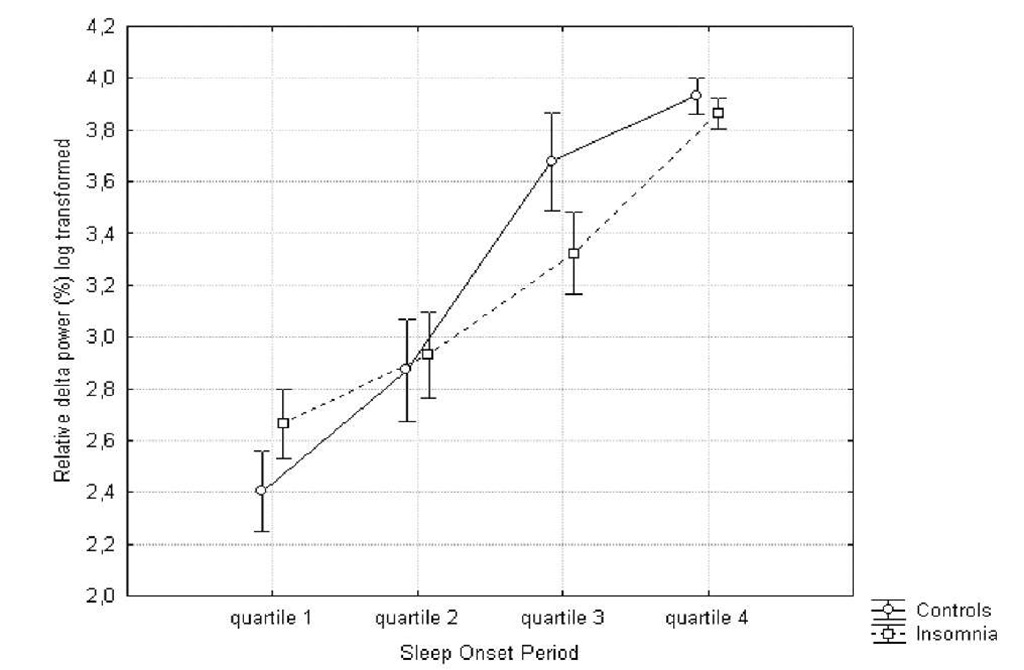
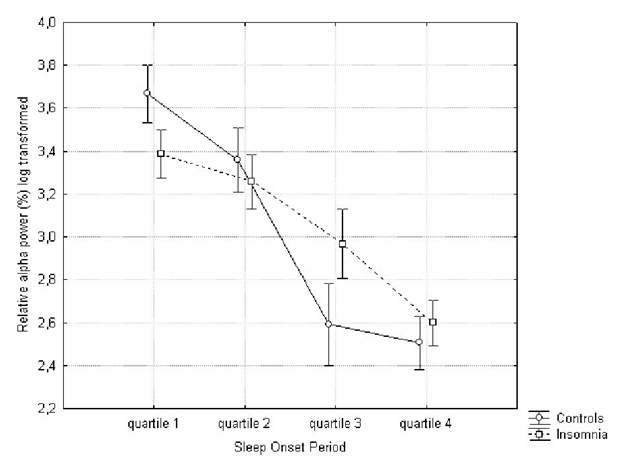
and alpha![]() .16) EEG power (figure 3 and 4).
.16) EEG power (figure 3 and 4).
Figure 2. Evolution of the absolute alpha power during the sleep onset period. A log transformation (ln) was performed.
Figure 3. Evolution of relative delta power (%) during the sleep onset period. Log transformation (ln) was performed.
Post-hoc Tukey analysis showed a faster and steeper increase in relative delta power in the healthy sleepers (quartile 2 vs. 3: p.<.0005) in comparison to insomniacs (quartile 3 vs. 4: p.<.005). The results for the relative alpha power show a gradual decrease for both groups, but this process is faster and steeper for controls (quartile 2 vs. 3: p.<.0005) in comparison to the insomnia group (quartile 3 vs. 4: p.<.05). The difference between absolute and relative alpha power, suggests that the decrease in relative alpha power is due to an increase in absolute power of one of the other frequency bands, as opposed to an actual decrease of absolute alpha power.
Figure 4. Evolution of relative alpha power during the sleep onset period. Log transformation (ln) was performed.
No significant interaction effects were found for the other frequency bands.


