Many micromechanics-based damage models were developed to mimic the macroscopic response of materials through matching measures such as toughness and failure strain [1]. However, there is a lack of microstructural experimental data to identify the roles of the initiation, growth and coalescence of voids to damage and failure. This paper is aimed to experimentally investigate the microstructure of the material and understand the damage processes leading to failure. Experiments using X-Ray Computed Tomography (XRCT) 3D imaging technique with in-situ loading were conducted [2 - 5].
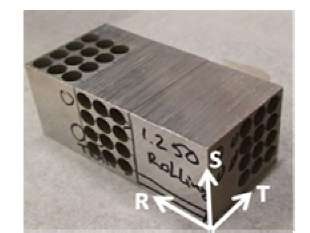
The material of interest is a rolled aluminum alloy, 7075-T7351, which shows the behavior of anisotropic ductile failure. To study the microstructure and damage evolution behind such phenomenon, smooth tensile specimens were extracted from three material primary directions, i.e. rolling (R), transverse (T), and short transverse (S). Figure 1 shows the aluminum plate and the original locations of the specimens. Figure 2(a) shows stress versus strain curves of these specimens. This alloy shows much more ductility in the rolling direction than in the transverse and short transverse direction.
Fig1: Specimen extrusion from different orientations;
Fig 2: (a) Stress versus strain curves; (b) A typical loading curve with marked scanned steps.
X-Ray tomography scans were performed in-situ during the incremental steps of loading. In order to interrupt the test at the desired deformation states for scanning, two critical modifications were done to the existing beam-line loading frame. (1) A new laser confocal displacement sensor with submicron resolution was installed to measure the crosshead displacement. (2) Tensile fixtures with ball joints were added for precise alignment. With these two improvements, we were able to take tomograms at a loading state very close to failure. Due to a large amount of time was needed per scan, only six tomograms were taken for each specimen. Typically, they were: the unloaded state, the yield point, one during hardening, the maximum load, one during necking, and after failure. The scanned states of the specimen loaded in the transverse direction are marked on the stress-strain curve shown in Fig 2(b).
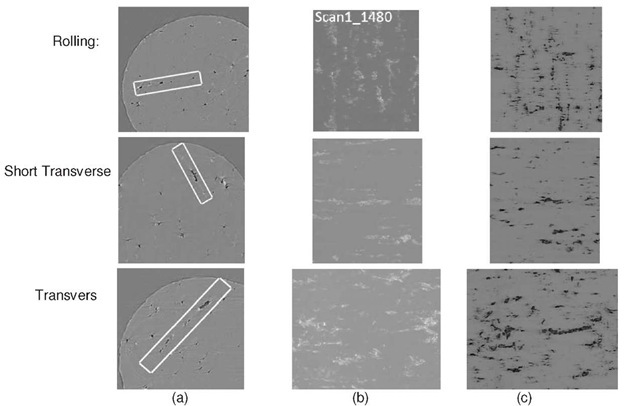
The tomograms were reconstructed using Octopus software. Figure 3 shows the void growth and coalescence from the horizontal slices for the transverse specimen, where the scan number corresponds to the marker in Fig 2(b). The voids growth and coalescence which leads to material failure can be viewed at steps of 5 and 6. Small sliced vertical sections were also selected to demonstrate various voids growth and coalescence mechanisms from specimens which are loaded in different directions, shown in Fig. 4. The voids initiation and growth appear to be closely associated with stringers.
Fig 3: Void growth and coalescence from the horizontal view for the specimen loaded in rolling direction
Fig 4: Void growth and coalescence in the sliced vertical section for the specimens loaded in different directions; (a) selected small vertical section, (b) map of constituent particle, (c) map of voids


