ABSTRACT
This paper presents experimental studies to examine stress-induced martensitic phase transformation during the superelastic deformation of the shape memory alloy Nickel-Titanium. The phase transformation, which is solid-to-solid and diffusionless, occurs between austenite, a B2 cubic crystal structure, and martensite, a monoclinic crystal structure during loading and unloading at constant ambient temperature. To examine the complex local thermo-mechanical interactions that affect transformation behavior, we utilize a temporally- and spatially- simultaneous combination of strain and thermal mapping using three-dimensional digital image correlation and infrared thermography, respectively. This combined experimental approach enables full-field, quantitative maps of strain and temperature fields over the specimen surface, allowing the investigation of factors including cycling, strain rate, texture, and local temperature variations. The effects of these factors on fundamental transformation properties, such as the stresses required for phase nucleation and propagation, accumulated residual plastic strain, total strain accommodated by phase transformation, the evolution of martensitic volume fraction, and the amount of hysteresis, are discussed.
INTRODUCTION
Shape memory alloys (SMAs) have been widely studied because of their high work density. NiTi, CuZnAl, CuAlNi, AuCd and other alloys are classified as SMAs. Among them, NiTi (Nitinol) is under rigorous investigation, since it is suitable for many applications, notably in the biomedical, aerospace, and civil engineering fields. SMAs have two unique properties, known as the shape memory effect and superelasticity (pseudoelasticity). The shape memory effect refers to the reversion of the material to its original shape after deforming, releasing and heating it above a critical temperature, known as the austenite finish temperature (Af). Superelasticity is the ability of the material to recover large amounts of strain in an elastic manner. Both the shape memory effect and superelasticity are caused by a solid-to-solid and diffusionless phase transformation between a cubic austenite phase and a monoclinic martensite phase, and are the result of different transformation paths between the austenite and martensite phases.
In spite of intensive research for more than 50 years, there is still much unknown about the complex local-thermo mechanical interactions that underlie phase transformation in this alloy. The ambient and local temperature, applied strain rate, and cycling show complex interactions with each other that are reflected in the macroscopic behavior. Many of the notable experimental results detailing various aspects of the behavior of this alloy are qualitative in nature and do not show the full-field strains. Thus, quantifying important parameters such as velocity of the phase front and the martensitic volume fraction has been difficult. These results are meant to fill this gap through the combination of simultaneous full-field strain mapping by three-dimensional digital image correlation (DIC) and full-field thermal mapping by infrared thermography. DIC is an in-situ optical technique used to quantify Lagrangian surface strains by tracking surface markers. The full-field strain map obtained by DIC facilitates quantitative characterization of the nucleation and propagation of the stress-induced martensitic phase transformation. In addition, the interaction between latent heat and the extent of transformation is observed by overlaying infrared thermography with local strain values. These results assist in understanding the phase transformation mechanism, including the relation between stress, strain, and temperature during phase transformation, and how important factors, such as the strain rate and latent heat, affect transformation.
LITERATURE BACKGROUND
Previous research (see for example [1-3] and the references therein) shows that martensitic phase transformation in Nitinol is inherently sensitive to both local and global temperature in the material. At temperatures T < Af, the initial phase is martensite and the superelastic effect is not observed. At temperatures T > Af, the initial phase is austenite, and phase transformation from austenite to martensite can be stress-induced at a constant ambient temperature. As the temperature increases, the stress necessary to nucleate phase transformation increases. The latent heat that is released (austenite to martensite) and absorbed by (martensite to austenite) by the stress-induced martensitic phase transformation also affects transformation characteristics due to local self-heating.
Tests on the effects of mechanical cycling have determined that hard cycling causes a decrease in the applied stress needed to nucleate the martensite phase (cNM) [4-7]. It is hypothesized that this decrease in cNM is caused by a change in dislocation structure and the retention of martensitic nuclei that helps form the stress-induced martensite in the subsequent cycles [8]. Thus, as cycling progresses, the stresses for the nucleation and propagation of the martensitic bands during loading decreases significantly, but the stresses for austenitic nucleation and propagation during unloading remain nominally the same. Another noticeable effect of cycling is the stabilization of the stress-strain curve [4]. One postulate for stabilization is that dislocations accumulate around defects as cycling increases. Accumulated dislocations also contribute to the accumulations of the residual strain and increase internal stresses during cycling [2]. Because the higher internal stress state helps transform the stress-induced martensite, the stress for the nucleation of martensite decreases as cycling increases. The degree of stability can be characterized by factors such as the amount of accumulated residual deformation, the critical stress for nucleation of the martensitic bands, and the amount of hysteresis. Those factors stabilize as cycling increases, and the macroscopic curve can be considered as nominally constant after a certain number of cycles. Though the amount of residual deformation increases as the number of cycles increases, and the amount of hysteresis decreases, the incremental rates of these factors decrease as cycling progresses.
The applied strain rate is an important parameter in determining the quality of the phase transformation, and is closely related to the local self-heating and heat transfer. At slow strain rates (e.g. k = 10 5 s~’). the stress plateau that the macroscopic stress-strain curve exhibits during phase transformation is relatively flat. Typically only one martensitic band nucleates and propagates at slow strain rates, because the temperature increase is small and the strain rate is sufficiently low to allow heat to escape [1]. At a faster applied strain rate (e.g. s = \() 2s~’). the stress plateau during martensitic transformation becomes inclined, and more than one martensitic band can nucleate and propagate due to a high local temperature increase and a buildup of thermal energy. Thus, the martensitic phase transformation is more homogeneous at faster strain rates. Previous research shows that, at very fast strain rates, the phase transformation changes from a solid-to-solid, diffusionless and shearlike mechanism to a slip mechanism that is based on dislocation slip. It has been shown that when Nitinol is subjected to an applied compressive strain rate of 4200 s-1, the constant stress plateau disappears and the sample behaves in a purely austenitic manner [4], The stress required for martensite nucleation and the amount of dissipated energy increase, but the stress for reverse phase transformation and the strain energy decreases as the strain rate increases (s>1.667xlCr3s1) [1- 9], The strain rate effect was not shown at /v<3.333xl() ‘s 1 [9].
EXPERIMENTAL METHODOLOGY
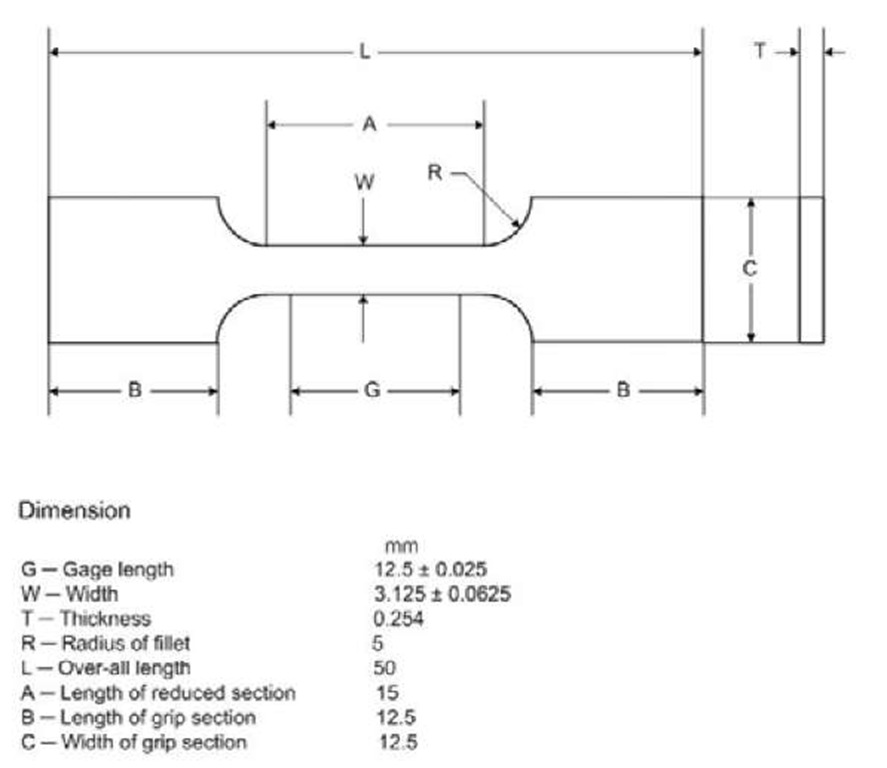
A cold-rolled flat polycrystalline Nickel-Titanium thin sheet, which has dimensions of 63.5 mm wide x 3048 mm length x 0.254 mm thickness, was received by Nitinol Devices & Components. The composition of the sample was 55 wt% Nickel and 45 wt% Titanium. The sheet was manufactured to have an austenite finish temperature Af = 2°C to ensure that the material was austenite at the ambient testing temperature. Differential scanning calorimetry (model TA-Q200) was used to measure the Af independently, and resulted in a value of 1.76 ± 0.45 °C. The dominant plane of the rolled sheet is NiTi (110) and the grain size of the plane is 45.8 nm, which was measured by X-ray diffraction using a Rigaku Rotating Anode X-Ray Diffractometer and Jade software. Dog-bone shape specimens following standard ASTM E8 were cut from the sheet along the rolling direction by electric discharge machining (shown in Figure 1), which prevented any property change of the material due to residual stress and temperature.
Full-field and quantitative maps of local strain and local temperature were obtained by digital image correlation (DIC) and infrared thermography, respectively. DIC is an in-situ optical method used to calculate surface displacements, and thus Lagrangian strains, by tracking a highly random and contrasting surface pattern. In this experiment, air brushing (model Iwata Custom Micron B) produced a fine, random and isotropic pattern at the appropriate length scale. A thin white titanium oxide layer was first applied and then followed by a random speckling with carbon black in order to produce a high contrast pattern. Two five megapixel gray scale CCDs (model Point Grey GRAS-50S5C) were used, each with a 2048×2448 pixel field of view and a spatial resolution of 9 |am/pixel at the chosen test field of view. An infrared camera, (model Inframetrics ThermaCam SC 1000) was placed between the two CCDs to get simultaneous and corresponding two-dimensional temperature map of the surface of the sample.
Hard cycling tests were performed under a ramp profile using a 45-kip Instron uniaxial load frame at three applied strain rates, ;: = 10 ,10 and 10 s . The specimen was cycled 50 times and the 1st, 2nd, 5th, 10th, 25th and 50th cycles were recorded.
Fig. 1 Tensile specimen geometry
The load values were obtained from the Instron load cell (model Instron 2525-805, maximum 1000 lb) through a custom LabVIEW data acquisition system collecting load, displacement, and the start time of CCD and IR images. The applied load, the acquisition time of the CCD images and the starting time of IR camera were recorded by the LabVIEW data acquisition system, with a trigger on the time domain. When CCD images were taken, the electric signal output dropped from 5 V to 0 V. When the IR camera began to capture thermal images, the trigger (connected between IR camera and LabVIEW) sent a signal to the LabVIEW data acquisition system to increase the signal output from 0 V to 5 V. The full-field strain was calculated by commercial VIC-3D software from Correlated Solutions, Inc. Through the use of this experimental setup, the full-field and quantitative maps of surface strain and temperature were obtained simultaneously and the properties of the stress-induced martensitic phase transformation were characterized.
RESULTS AND DISCUSSION
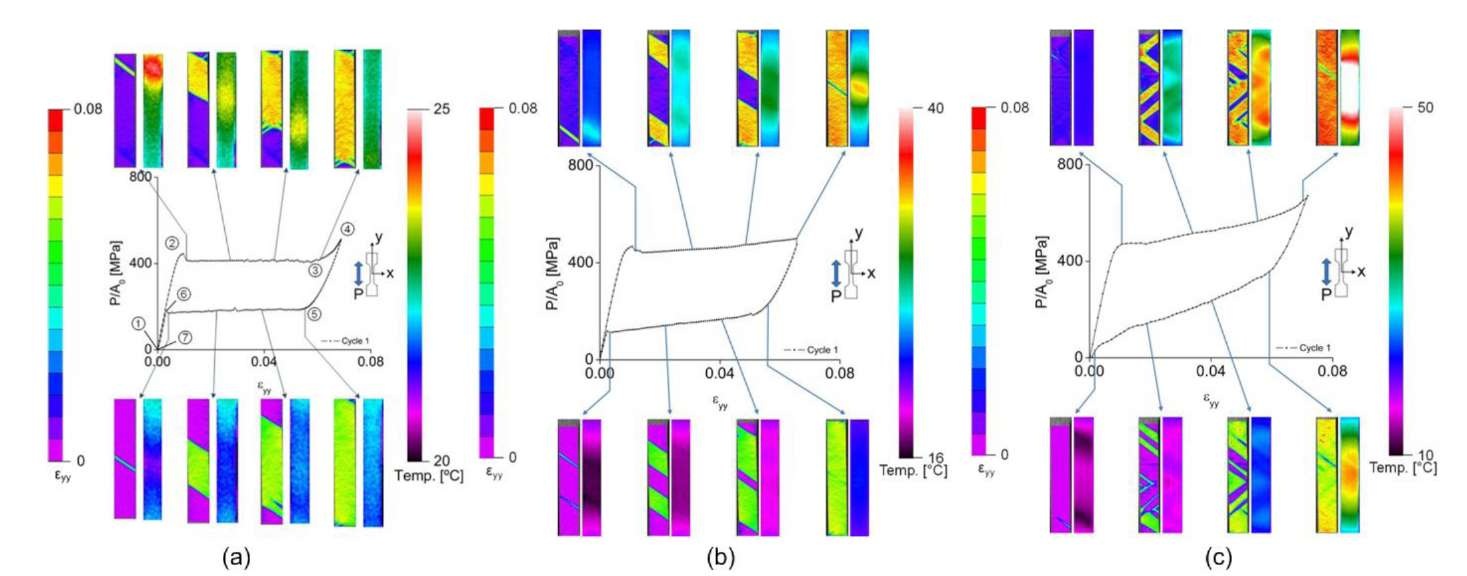
Three macroscopic stress-strain curves of Nitinol during cycle 1, with simultaneous images of the strain and temperature fields at the gage section at e = 10 ,10 and 10 V , are shown in Fig. 2. The strain values in the macroscopic stress-strain curve were calculated by averaging the values of approximately 600,000 pixels in the gage section. Fig. 2 shows the maps of local strain and temperature at eight points on the stress strain curve, during the first loading cycle, for three applied strain rates (s = 10", 10" and 10" s~1). In Fig.2 (a), the initial phase of the specimen is austenite. When the applied load reaches the critical stress for phase transformation, a large localized martensitic band of strain nucleates at point 2. Once phase transformation begins, the martensitic band propagates throughout the entire specimen until point 3, during which time the applied stress stays constant. After point 4, the martensitic band has completely propagated through the specimen and we observe elastic behavior between points 3 and 4. As the applied load is decreased, the stress-induced martensite reverts back to austenite because of the instability of martensite at this temperature. Small peaks in the stress, which are shown in Fig. 2(a) during loading (point 2) and unloading (point 6), indicate the critical stresses for the nucleation of the martensite or austenite phases. During loading, the transformation of the austenite phase to the martensite phase is affected by intragranular constraints. When the stress becomes large enough to overcome these constraints, localized martensitic bands of strain can nucleate. The existence of small stress peaks during unloading is due to a similar mechanism. Note that stress concentrations at the grips can facilitate phase transformation at the grip, which can effectively hide the nucleation peak. For example, the macroscopic stress-strain curve of a straight Nitinol wire does not have the peak [10]. The stress peak is also affected by strain rate and cycling. As the strain rate increases, the stress peak disappears because of internal friction resistance that interrupts the propagation of martensitic band. In addition, the peak diminishes as cycling increases [9]. Because the phase transformation is 1st order, the martensitic band incurs latent heat, which is shown in the temperature map in Fig. 2.
At an applied strain rate of s = 10 1 s_l. only one primary martensitic band nucleates and propagates and the slope of the transformation plateau is approximately 0 degrees as seen in Fig. 2(a). As the strain rate increases, more martensitic bands nucleate and the transformation plateau becomes increasingly inclined, as shown in Figs. 2(b) and (c). In Fig. 2(b), two martensitic bands nucleate and propagate during phase transformation in the strain field images. The temperature peaks are observed at the end of martensitic bands in the thermal images and the peak temperature is higher than in Fig. 2(a). The phase transformation plateau in Figure 2(b) is inclined with the slope of approximately 1094 MPa. At an applied strain rate of s = 10 2 s"1, approximately five martensitic bands nucleate, the temperature peak is more than 50 °C and the phase transformation plateau is the most inclined with the slope of approximately 2939 MPa. Observation of the strain maps at each strain rate shows increasing homogenization, and temperature maps show higher local and global temperature as the strain rate increases.
Fig. 2 Macroscopic stress-strain curves with full-field maps of strain and temperature![]() and
and ![]()
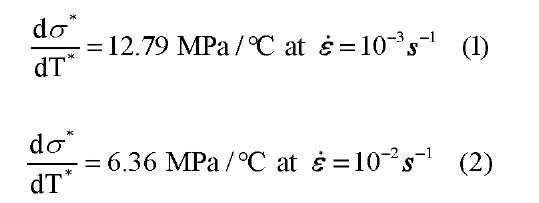
The reason that different numbers of martensitic bands nucleate is closely related to the latent heat [1]. Latent heat has a major role in phase transformation, as it can increase or decrease the stress required for transformation. In Fig. 2, the local temperature during loading increases as the applied strain rate increases, due to the latent heat that is released during the martensitic phase transformation. In order to see the effect of latent heat, the average temperature on the surface of the specimen was calculated and plotted on the macroscopic stress-strain curve in Fig. 3. In Fig. 3, the red line with round dot is the average temperature of the gage section and the blue line with the triangle dot is the peak temperature, taken as the maximum temperature during loading and the minimum temperature during unloading. When the martensitic band nucleates, the released latent heat increases the temperature of whole specimen. However, at a slow strain rate (Fig. 3(a)), there is a relatively small amount of latent heat which escapes easily, and the average temperature drops even though phase transformation is proceeding. As the strain rate increases (Fig. 3(b) and (c)), more latent heat occurs and is not able to escape to the environment, thus the average temperature increases. The increment of temperature makes the critical stress for phase transformation high, as seen through the Clausius-Clapeyron relation. Thus, the critical stress increases during transformation and the slope of plateau becomes stiffer than at low strain rates. The phenomena of the strain rate effect on the critical stress and temperature is shown clearly in Fig. 3. From the result, the ratio of the critical stress to critical temperature is obtained as:
Note that the small region marked by an arrow on the average temperature plot of![]() in Fig. 3(c) should be ignored, as the highest temperature at this region is more than 50°C which cannot be measured because of equipment limitations.
in Fig. 3(c) should be ignored, as the highest temperature at this region is more than 50°C which cannot be measured because of equipment limitations.
Fig. 3 Macroscopic stress-strain curve with corresponding average temperature and peak temperature of the specimen at applied strain rates![]()
Six hard cycles![]() were recorded by CCDs and IR imaging for three globally applied strain rates.
were recorded by CCDs and IR imaging for three globally applied strain rates.![]()
Macroscopic stress-strain plots of these cycles at each strain rate are shown in Fig. 4. Note that the phase transformation becomes increasingly homogenized as cycling increases. In a recent paper by the authors [11], the effect of cycling is discussed in detail, particularly evidence of a microscale pattern memory in the manner that the martensite is accommodated, both within a loading cycle and from cycle to cycle. Comparison of Fig. 4(a), (b) and (c) shows the effect of strain rate, and each plot individually shows the effect of cycling at a chosen strain rate. Both faster strain rates and cycling result in increased homogenization of the phase transformation. In Fig. 4, the macroscopic stress-strain curve of 50th cycle at e = 10 2 s 1 has the smoothest shape, smallest stress required to nucleate phase transformation the largest amount of residual strain, and the largest amount of hysteresis. This is due to increased internal stress, accumulated dislocations around defects, and the highest local and global temperature at this strain rate because of the accumulation of released latent heat.
Fig. 4 Macroscopic stress-strain curves of all cycles at applied strain rates![]()

One of the advantages of this experimental approach is that the nucleation stress of the martensitic band can be accurately obtained through full-field strain mapping. However, the exact nucleation stress cannot be determined at select points, due to the inherently fuzzy and criss-cross character of the martensitic band under certain loading conditions (for example, at a strain rate of = 10 2s~ and the 50th cycle, where transformation is highly homogenized). Instead of comparing the critical stress, we therefore compare the amount of dissipated energy in a cycle, in Fig. 5. When the specimen is under applied load, energy is dissipated, and then absorbed in unloading as evidenced by the release/absorption of latent heat. The amount of dissipated (loading) and absorbed (unloading) energy is shown in Fig. 5(a) and (b). The hysteresis is obtained as the difference of the dissipated and absorbed energies, and is shown in Fig. 5(c). In the first cycle, the largest dissipated energy is observed at e = 10 2 s and quickly drops as cycling increases. A significant amount of energy is dissipated by the latent heat at this strain rate in the first cycle, but a large decrease in the stress for phase transformation dominantly affects the dissipated energy, lowering it in the fiftieth cycle due to accumulated martensite retention. Thus, in Fig. 5(a), temperature dominates the stress required for transformation in cycle 1 at different strain rates, but the dominant reason for the decrease in nucleation stress within a strain rate can be attributed to the amount of accumulated martensite retention. These different dominant reasons result in the line of s = 10 2s~ crossing the e = 10 3s_1 and e = Io 1 lines. However, the dissipated energy at strain rates e =l0 3s_1 and e =10"s_1 lias nearly same character. The absorbed energy at the three different strain rates during unloading shows a similar pattern, but note that the absorbed energy at an applied strain rate of s = 10 s is shifted vertically to a lower value. This corresponds with previous research, which has found that reverse phase transformation is minimally affected by cycling. The reason that line of i: = 10 3 s_1 is lower than other strain rates is that the maximum elongation is shorter. Because of this, the amount of both dissipated and absorbed energy of ,<; = 10 3 s_1 should be vertically shifted upwards. However, because the strain level at which the specimen gage section can be considered as fully martensite depends on the applied strain rate, it is difficult experimentally to set the same maximum elongation. In Fig. 5(c), the amount of dissipated and absorbed energy at e = 10 3 s"1 can be compensated because the hysteresis is calculated by sum of them. Thus, the overall tendency of the hysteresis is similar to the dissipated energy because of the minimal effect in the reverse phase transformation (unloading).
Fig. 5 Strain rate effect on hysteresis (a) energy dissipation during loading, (b) energy absorption during unloading, (c) hysteresis during one cycle
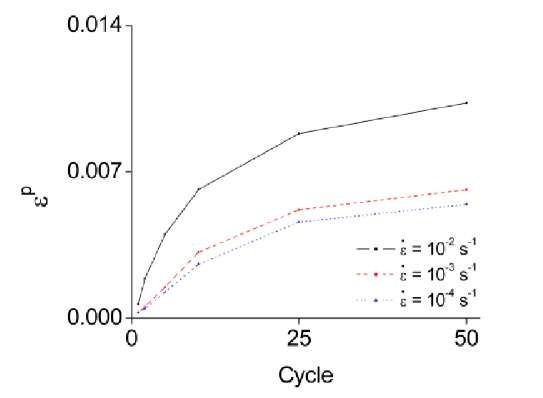
As seen in Fig. 4, the residual strain (eP) accumulates as cycling increases. As cycling increases, dislocation hardening results in a rise of the stress required for slip (cS), but the transformation stress (cNM) decreases for the reasons previously discussed. Thus, the transformation stress becomes dominant as cycling increases. The increment of residual strain decreases as cycling increases, though the total amount of the residual strain increases. Secondly, the amount of incurred residual strain (eP) increases as the applied strain rate increases. Fast strain rates cause both an overall and local temperature increase of the specimen. By the Clausius-Claypeyron relation, the temperature increase causes the transformation stress to increase. However, the resolved shear stress for slip decreases as temperature increases because of thermal activation of dislocation motion. As a result, the relative difference between cS and cNM becomes lower as the strain rate increases [5, 10]. Consequently, cycling decreases the amount of residual strain, but increasing the applied strain rate acts to increase the residual strain.
Fig. 6 Residual strain at applied strain rates 
The cycling and strain rate effects on the residual strain are shown in Fig. 6. In this figure, the increment of the residual strain at each strain rate decreases as cycling increases, and a larger amount of residual strain is evident as the strain rate is increased.
CONCLUSIONS
In this paper, the effects of cycling and strain rate in stress-induced martensitic phase transformation during superelasticity in shape memory alloy, Nitinol, are examined through full-field maps of Lagrangian strain and temperature fields by simultaneous digital image correlation and IR cameras. Different amounts of latent heat at various strain rates incur a global and local temperature increase of the specimen and affect the stress for phase transformation, which leads to interesting results in the number of the martensitic bands, the slope of the plateau during phase transformation, the energy dissipation and the residual strain. The stress for phase transformation and the average and local temperature of the specimen increase as the strain rate increases, and the relation between the stress and temperature is coincident with Clausius-Clapeyron relation. To examine both effects of strain rate and cycling, the amount of hysteresis and residual strain are calculated. At ,<; = 10 2s~’. the largest hysteresis occurs and decreases rapidly as cycling increases. The residual strain increases as the strain rate increases, but decreases as the cycling increases due to changes in the stresses required for phase transformation and slip.


