Building a Test Plan
The Test Plan is the main container where you will run your tests. It is basically made up of a minimal set of components:
1. You need to define the number of Threads running your test so you need to define a Thread Group.
2. Then you need to define the format of the request which will be used to run the test, so you need to define a Sampler. Even though JMeter has been originally built for web applications now you can also send FTP, SOAP/ XML, JDBC, or LDAP requests.
3. Finally you need an interface (named Listener) which is able to save the benchmark to a file or illustrate the results with a chart.
Step 1: Create a Thread Group
Let’s begin by creating a Thread Group which will contain sub elements like the Sampler. Right-click on the Test Plan icon to see the context menu and choose Add | Thread Group. The Thread Group GUI will be displayed:
The fields in this window allow you to define:
• Number of Threads (that is the number of users)
• Ramp-Up Period (that is how long it takes to start each user)
• Number of times to execute the test
If you enable the Scheduler field, in the lower part of the GUI, you will be able to define a startup time and a stopping time for your test, which can be thus deferred to a later time.
Step 2: Create a Sampler
Once you are done with the Thread Group GUI we will move to the Sampler. From the Thread Group element right-click and choose Add | Sampler | HTTPRequest. The HTTP Request Sampler control panel looks like the following figure:
At first, define a meaningful name for the HTTP Request like "Homepage". Then in the Web Server section you need to define the server name and the port where the web application is running
If you plan to add several HTTP Requests to your Project then you should consider adding HTTP Request Defaults (this option is reachable from the menu Add | Config Element | HTTP Request Defaults).
By setting HTTP Request Defaults you can avoid entering elements multiple times (like the Server Name or the Port), which are common to every request.
Finally, you need to define the Path of the HTTP Request which can carry additional parameters/files as well. In our example, we will set the path field to "/" which means to load the default welcome page.
Step 3: Create a Listener
Finally, we will add a simple Listener like the Aggregate Graph. This element will store all results of your HTTP Requests and will display the statistical information in table and graph format.
From the Thread Group element select Add | Listener | Aggregate Graph. The only field we will populate is the Write results to a file section which will select where to save the graph data.
Before running the test, JMeter requires us to save a Test Plan: click on the Save Test Plan button from the File menu and then, from the Run menu, select Run.
The following screenshot shows how your Aggregate Graph panel should look at the end of a profiler session. In case you have selected to run benchmark forever, then you need to manually stop the run by selecting Stop from the Run menu.
The column headings are explained briefly as follows:
|
Column |
Description |
|
Label |
The label of the sample |
|
# Samples |
The number of samples for the URL |
|
Average |
The mean time of a set of results |
|
Median |
The time in the middle of a set of results |
|
90% Line |
The maximum time taken for the fastest 90% of the samples |
|
Min |
The lowest time for the samples |
|
Max |
The longest time for the samples |
|
Error % |
Percent of requests with errors or failures |
|
Throughput |
Throughput measured in requests per unit of time |
|
Kb/sec |
The throughput measured in kilobytes per second |
The preceding fields can be used to generate a graph in the lower section of the GUI: choose one meaningful field like Average and click on the Display Graph button. A tiny portion of the graph will be displayed in a panel which can be saved in graphical format by clicking on Save Graph or in CSV format if you choose Save Table Data.
Use Listeners with parsimony!
As you can see from the Listener menu, there are many other available listeners besides the Aggregate Graph. You might be tempted to add every kind of listener to improve your analysis: don’t do it! JMeter will considerably slow down if you have many listeners active. Therefore, use a minimum set of the most appropriate listeners.
Making your test plan a bit more realistic
By default, JMeter sends one request immediately after the other: this could potentially saturate the server and also produce a test which is not close to real world cases. As a matter of fact user requests are usually separated by a variable amount of time, which can be thought as constant or following a statistical pattern like a gaussian curve.
In order to introduce a delay between requests you can introduce Timers in your Test Plan. Choose Add | Timer from the Thread Group context menu and select one timer from the available. In the following screenshot, we have added a Constant Timer to our Thread Group, which introduces a constant delay of 300 ms between requests:
How to create a complex Test Plan
With the notions you have learnt until now you are able to create a simple web load test. In theory, you could build a more complex one by including a set of HTTPRequest, each one targeted at a different URL and carrying the appropriate parameters.
In practice, that would require quite a lot of time and would also be prone to human error (ironically you would end up testing the composition of the test too!). Luckily, there’s a handy option which allows for using JMeter as proxy server, thus recording every request made to the application.
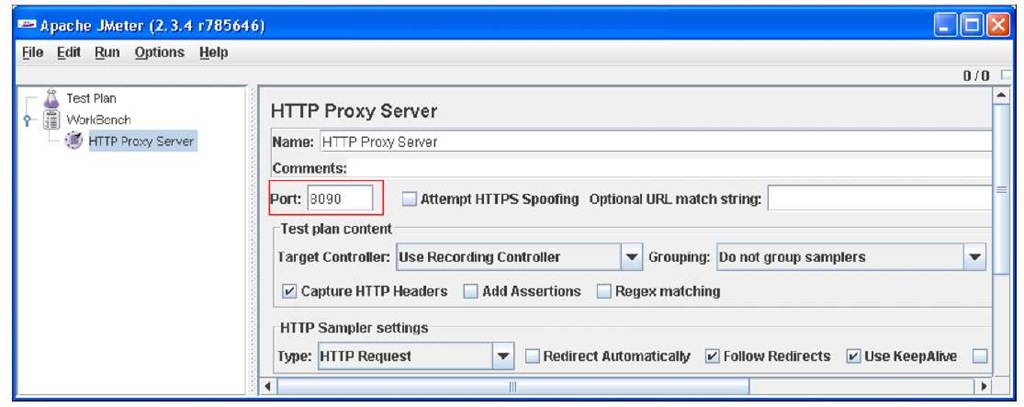
A proxy server can be added by right-clicking on Workbench and select Add | Non Test Elements | HTTP Proxy Server. As shown in the following image, JMeter proxy server sits in between the client (browser) and the web server:
In order to configure the proxy server, you need to specify the Port on which the proxy will be started.
As in this example we have started the proxy server on the same machine where the web server is running, we cannot use the default port 8080 which is already engaged. So we will start the proxy on port 8090.
As in this example we have started the proxy server on the same machine where the web server is running, we cannot use the default port 8080 which is already engaged. So we will start the proxy on port 8090.
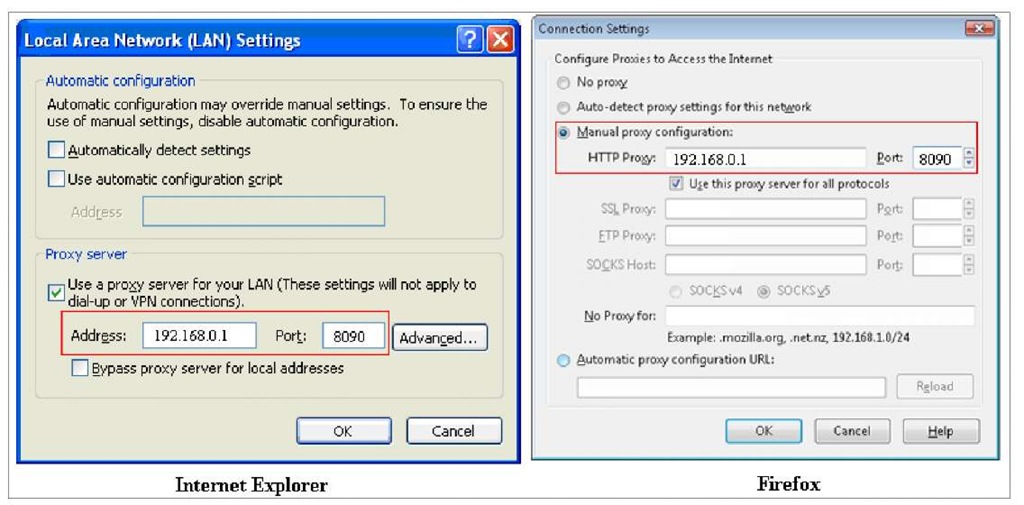
Now you need to configure your browser so to that the proxy server will actually direct the proxy request to the web server. The following screenshots depict how to set up a proxy on your favorite browser (Internet Explorer/Firefox);
Now start up JBoss AS, taking care to bind it to the available network interfaces (starting it with localhost might not work if you have configured the browser not to use the proxy for localhost):
Finally start the HTTP Proxy Server by clicking on the Start Button in the lower part of the panel and start surfing on your JBoss AS.
In the following example we are pointing our browser to the JBoss AS’s jmx-console:
When you enter this information in the navigation bar, the browser understands that the request needs to be proxied to the address 192.168.0.1.8090 first. There, JMeter HTTP Proxy records the request which will be finally forwarded to the original address where JBoss AS is running (port 8080).
That is what the Workbench contains after you have navigated through the JBoss AS jmx-console:
When you have completed your recording, click on the Stop button in the HTTP Proxy Server panel. The HTTP Request items created in WorkBench can be eventually dragged into your test plan.
![tmp39-34_thumb[1] tmp39-34_thumb[1]](http://what-when-how.com/wp-content/uploads/2011/09/tmp3934_thumb1_thumb.jpg)
![tmp39-35_thumb[1] tmp39-35_thumb[1]](http://what-when-how.com/wp-content/uploads/2011/09/tmp3935_thumb1_thumb.jpg)
![tmp39-36_thumb[1] tmp39-36_thumb[1]](http://what-when-how.com/wp-content/uploads/2011/09/tmp3936_thumb1_thumb.jpg)
![tmp39-37_thumb[1] tmp39-37_thumb[1]](http://what-when-how.com/wp-content/uploads/2011/09/tmp3937_thumb1_thumb.jpg)
![tmp39-38_thumb[2][2][2] tmp39-38_thumb[2][2][2]](http://what-when-how.com/wp-content/uploads/2011/09/tmp3938_thumb222_thumb.jpg)


![tmp39-41_thumb[2][2][2] tmp39-41_thumb[2][2][2]](http://what-when-how.com/wp-content/uploads/2011/09/tmp3941_thumb222_thumb.jpg)
![tmp39-43_thumb[2][2][2] tmp39-43_thumb[2][2][2]](http://what-when-how.com/wp-content/uploads/2011/09/tmp3943_thumb222_thumb.jpg)
