Welcome to scientific tuning
Today tuning has evolved to the rank of "science", first and foremost because it’s supported by a vast collection of tools which can help you to systematically fix your performance issues.
So, before entering the tuning arena, we will install some nice software on your machine which will be used across the examples of this topic. As we are embracing the open source philosophy, we have chosen to focus on high quality open source software, so your only investment will be the price paid for this topic. You can still consider vendor alternatives, which often provide sales support and engineering staff trained to make the software have a less-daunting road to getting up and running.
In the first part of this topic, we will learn about profiling the Java Virtual Machine (JVM), focusing on VisualVM, a powerful tool developed by Sun engineers.
In the next section of the topic, we will learn about the Eclipse Test and Performance Tools Platform suite (Eclipse TPTP) which can be used to measure all critical parameters of your applications such as memory usage, CPU time, total threads used, and so on.
In order to do load testing on your applications we will then download and try Jakarta JMeter, a well-liked Java application which was originally built to test the performance of web applications. Since then it has expanded and can thus be used to test many type of protocols such as JDBC, JMS, web services, and so on.
We will then conclude our overview by looking at the most popular operating system tools and commands which can be used to complete our analysis.
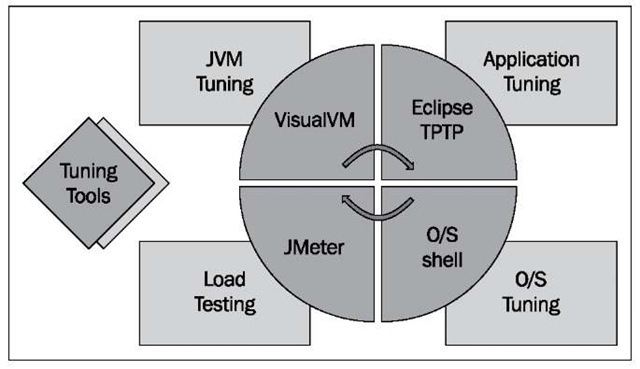
As a picture is often better than many words, the following image will give you a better idea as to how the topic is organized:
The rationale behind the choice of the tools
A small preamble is necessary before we begin. The list of tuning tools available today is quite bulky and most of the tools, originally built with one task in mind, have evolved to cover many aspects of the tuning process.
All the products introduced in this topic can do, by any means, much more than we will reveal in a single section, so the competent reader might ask why don’t we focus on just one tool and use it all around the topic?
The reason behind our choice is certainly influenced by the author’s personal tastes or programming styles; however we do believe that it’s worthy to have more than one option available in your stock because a single tool might not be an appropriate solution for all scenarios. Specifically, even if all the software described here are excellent in many ways, maybe they lack ease or flexibility in some other ways.
So summing up, our suggested strategy will be to learn the best features of three tools, using the smallest learning curve. In the end, what will actually drive your performance tests is a solid tuning methodology and not the choice of the tool which is, after all, just an instrument to reach your goals.
Profiling the Java Virtual Machine
Profiling the JVM is an essential task to make sure the virtual machine is performing well and also to check the health of your application server.
Before we start profiling our applications it’s a prerequisite that you have installed Java Virtual Machine v.1.6 on your computer: if you already have got one working you can safely skip the following section and move to the Installing VisualVM section.
Installing the JVM
In order to install Java, let’s move to the Oracle/Sun download page:
http://www.oracle.com/technetwork/java/javase/downloads/index.html
Choose to download the latest JDK/JRE, which is, at the time of writing, the JDK 1.6 update 20. Once the download is complete, run the executable file to start the installation.
You can accept all the defaults given to you by the set up wizard. When the installation is completed, we need to update a couple of settings on the computer so it can interact with Java.
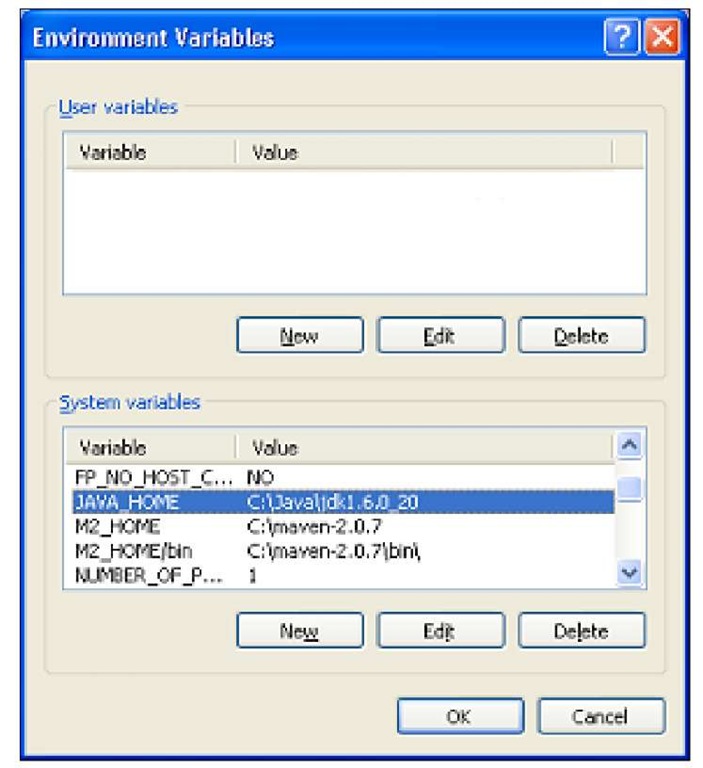
The most important setting is java_home, which is directly referenced by the JBoss startup script. We recommend also including to the system variable path, the path to the new JDK/JRE so that you are guaranteed to use the same JDK across your scripts.
Windows users should right-click on My Computer and select Properties from the context menu. On the Advanced tab, click on the Environment Variables button. Then in the System Variables box, click on the New button. Give the new variable a name of java_home, and a Value of the path to your JDK installation: for example, something like C:\Java\jdk1.6.0_20.
Now execute the same steps for the Path variable: double click on the Path System variable. In the box that pops up, navigate to the end of the Variable Value line, add a semicolon to the end, then add the path to your JDK. This will be something like C:\Java\jdk1.6.0_20\bin.
Unix/Linux users can add the following commands in the user’s profile scripts.
Installing VisualVM
One of the best JVM profilers available in the market is VisualVM. This great tool will allow you to generate and analyze heap data, track down memory leaks, monitor the garbage collector, and perform memory and CPU profiling; all this with a single tool!
What about JConsole ?
Some of you might argue why we have chosen VisualVM and not JConsole which has been included in the J2SE since release 5.0. As we said, the choice of the tool is often a matter of personal taste, however, we have chosen VisualVM because it provides all the nice functionalities that JConsole has, without the need to use additional utilities such as jinfo, jmap, jstack, jstat which are included in the JDK distribution.
At the same time, VisualVM can be extended to use all the plugins that have been added to JConsole, so we believe it’s worth upgrading to VisualVM.
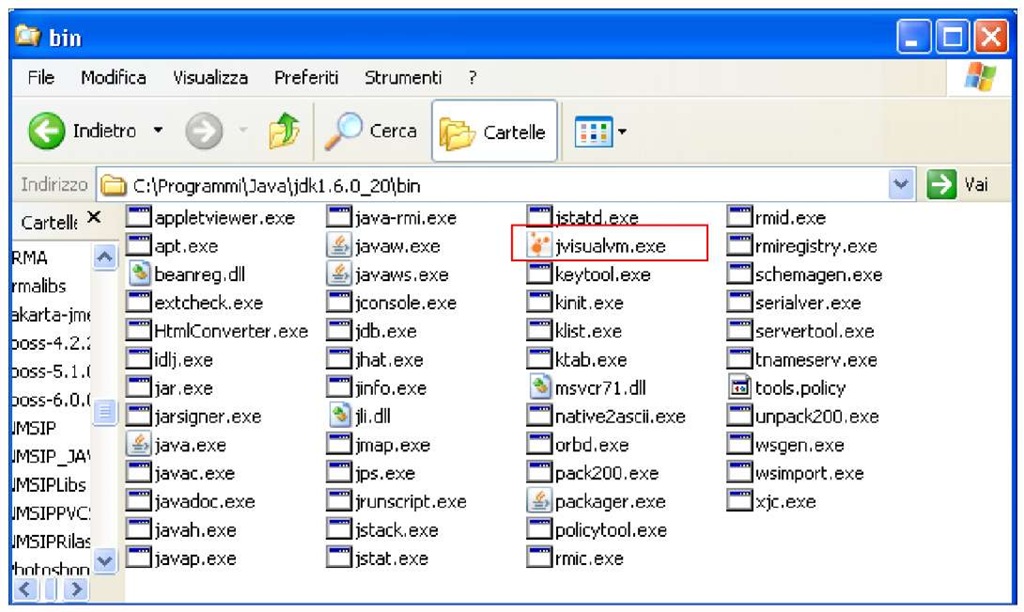
VisualVM comes out of the box if you have got a JDK 1.6 update 7 or later. As you can see from the following image, it is included in the JAVA_HOME/bin folder. Just click on the jvisualvm.exe icon if you are using Windows or simply visualvm for Linux OS.
If you have got an earlier JDK 1.6 release then you can still download and install a fresh copy of VisualVM at the distribution main page: https://visualvm.dev.java.net/.
Connecting to a local server
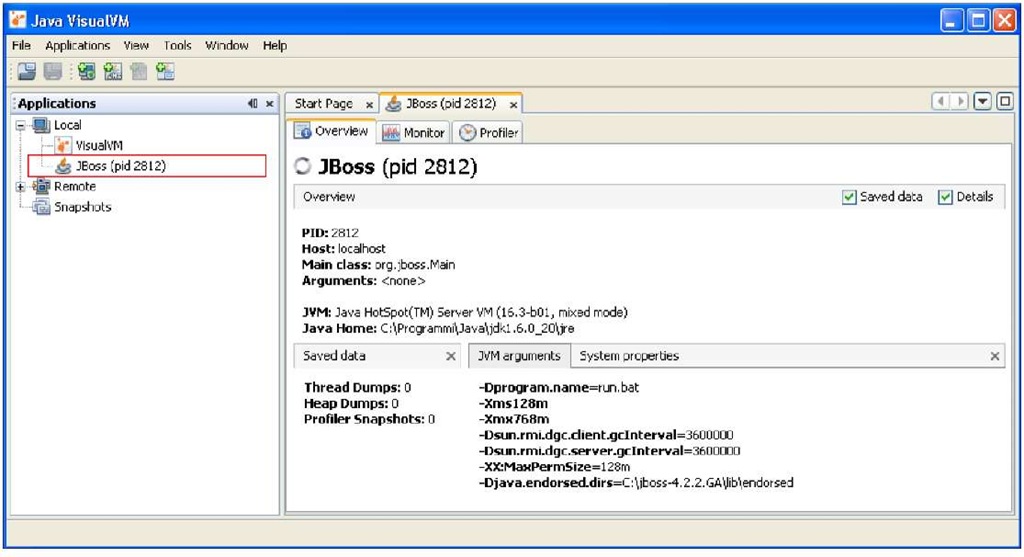
When you start VisualVM, the Applications window is visible in the left side of the VisualVM window. The Applications window uses a tree structure to enable you to quickly view the applications that are running on local and remote JVM software instances.
In the following image, you can see the list of local Virtual Machines detected by VisualVM. The most relevant entry is the JBoss application server running with process id (pid) 2812:
Connecting to a remote server
VisualVM can also reach a Java Virtual Machine that is running remotely. For this purpose, you need to use a tiny RMI service named jstatd to let VisualVM connect to your remote host. The advantage of this approach is that it doesn’t require any change in the remote server’s startup script, just start the service and connect to the remote JVM.
The jstatd RMI service is located in the JAVA_HOME/bin distribution folder.
Starting up jstatd requires setting up a security policy file for granting permissions to run jstatd and other JVM tools located in tools.jar:
Create the following tools.policy file in the JAVA_HOME/bin folder:
Then, you can start jstatd using the security policy contained in tools.policy and set an available port as TCP port (In our example, we will be using port 1234).
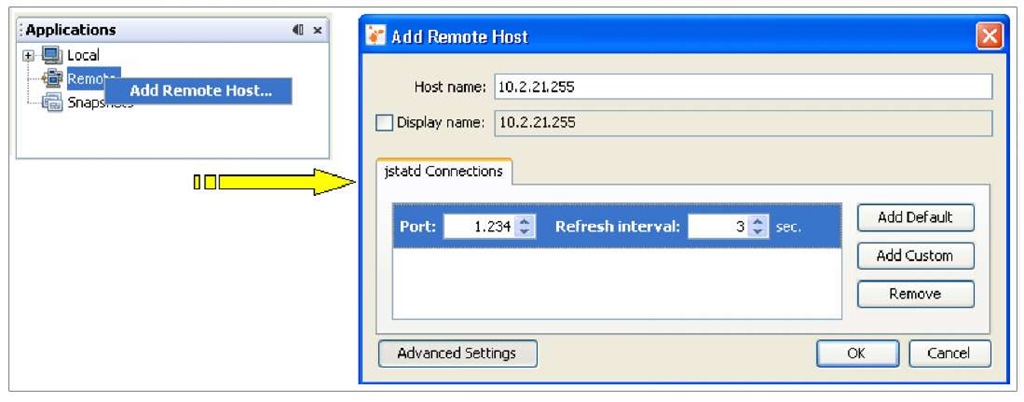
Now connect VisualVM to your remote server by right-clicking on the Remote icon on the Applications view. Choose Add Remote Host….
In the pop up displayed, enter the Host Name/Address and select Advanced Settings where you will specify the port where jstatd is running and the Refresh interval.
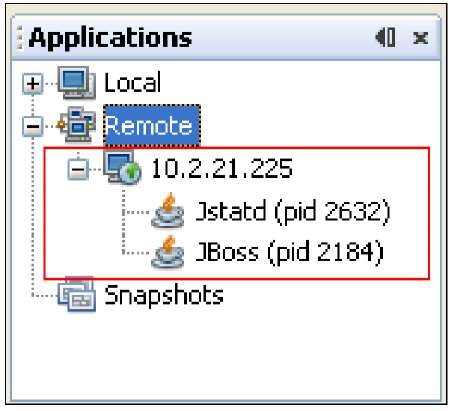
At this point, VisualVM should automatically detect both the jstatd Remote service and the JBoss AS running on the host 10.2.21.225. The following image shows how the Applications panel should look:
