What operations you perform on any given set of data as well as how you choose to visualize it are usually determined by the source of the data and by which aspects of it you wish to emphasize. In general, all the data you will ever work with will either be the result of some generating function, i.e., function data, or will be a measurement of some real-world property, i.e., measured data.
Function Data
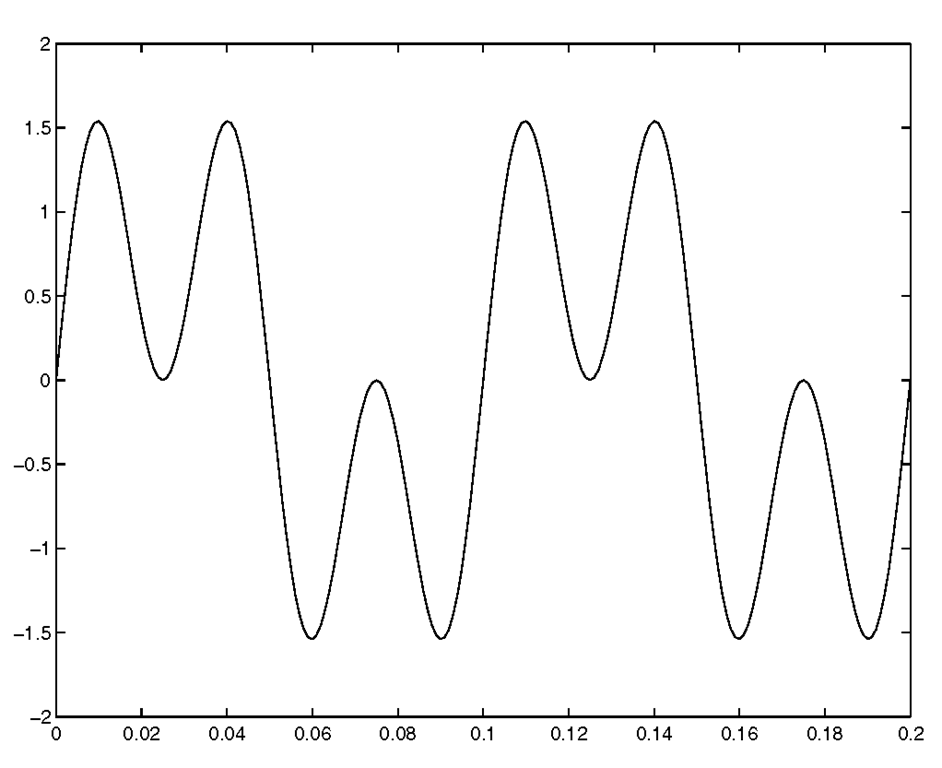
Function data is data that is created by some mathematical operation. Its typical characteristics include: 1) data-uniformity, i.e., the data is not sparse or riddled with discontinuities, 2) free of corrupting noise, and 3) controllability, i.e., you can vary parameters, change algorithms, etc., and so re-create data in any form you desire. However, such ideal data rarely is representative of the real world, and in the case where generated data is intended to represent real-world phenomena a great deal of energy is expended in making generated data look like measured data. You can think of function data as any data which is the result of an algorithm, and in short you have complete control over the range, quantity, and values of the data. A simple example of function data is the mixing of two sinusoidal waves such as that described by the expression  and shown in 0.
Figure 3.1 An example of function data.
Measured Data
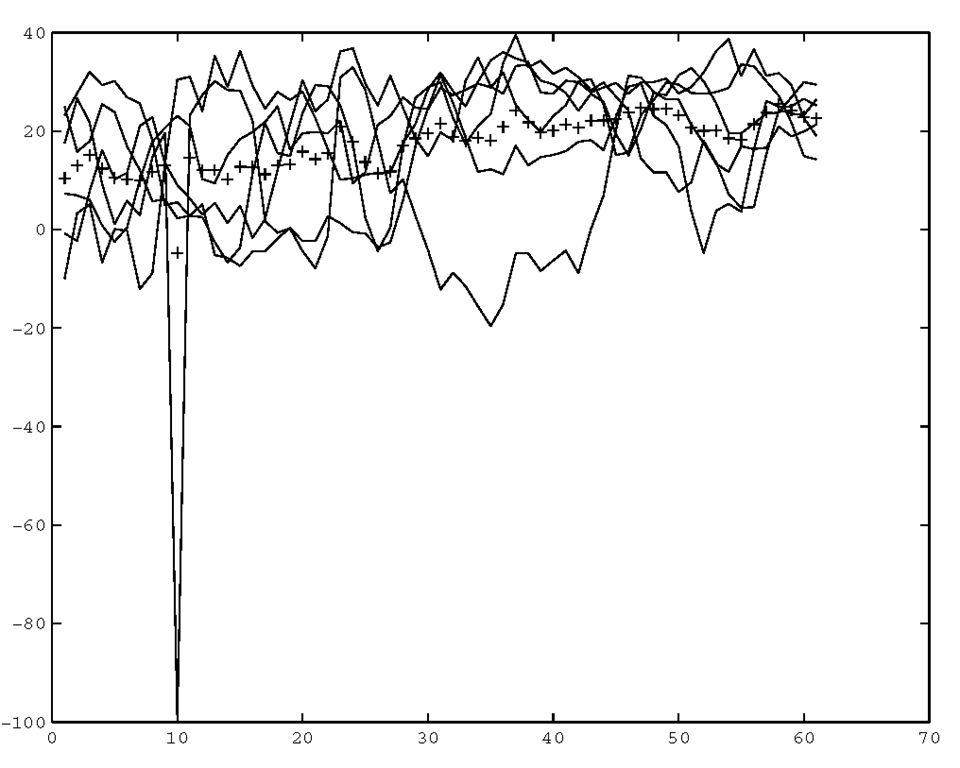
Measured data results from some real-world sensing or probing. Examples of measured data include data such as daily temperature highs, g-force, velocity, etc.. The principal characteristics of measured data are: 1) measured data is only as accurate as the device making the measurement, 2) there is always some degree of uncertainty associated with the data, 3) data may take extreme excursions, and 4) measured data might be incomplete or have gaps. This last characteristic is a particularly interesting one in that it is more common than one might at first think. Consider daily temperature readings. It is common that readings do not exist for many days for a given year or in some cases, data might only be taken sporadically. (Either way, such data is called "sparse" and MATLAB provides a memory efficient means of dealing with such data.) However, it is up to you as the programmer, analyst, scientist, or engineer to determine how to deal with gaps in your data and how you choose to visualize such data is highly dependent on the intended use of it. Figure 3.2 shows a plot of average daily temperatures for the first sixty days of the years 1995 through 2000 for Anchorage, Alaska.1 The ‘o’ data marker indicates the 6-year mean for that day. In this data a value of -99 indicates that no data is available, i.e., a data gap. You can see that on about the 10th day of one of the years no data was taken.
Figure 3.2 Example of measured data.


