Receiver measurement noise
The receiver measurement noise results from the limitations of the receiver’s electronics. A good GPS system should have a minimum noise level. Generally, a GPS receiver performs a self-test when the user turns it on. However, for high-cost precise GPS systems, it might be important for the user to perform the system evaluation. Two tests can be performed for evaluating a GPS receiver (system): zero baseline and short baseline tests [12].
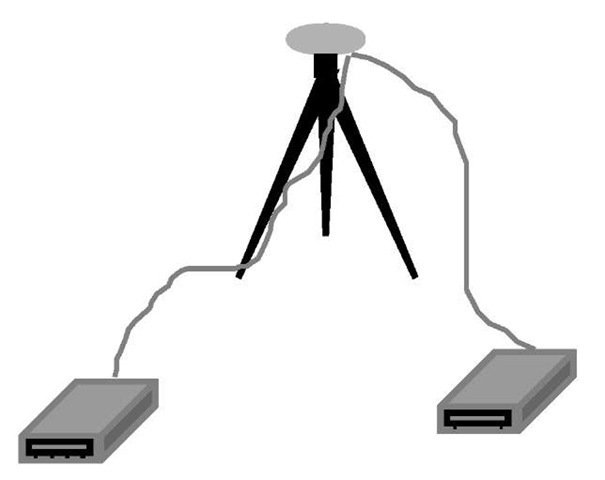
A zero baseline test is used to evaluate the receiver performance. The test involves using one antenna/preamplifier followed by a signal splitter that feeds two or more GPS receivers (see Figure 3.5). Several receiver problems such as interchannel biases and cycle slips can be detected with this test. As one antenna is used, the baseline solution should be zero. In other words, any nonzero value is attributed to the receiver noise. Although the zero baseline test provides useful information on the receiver performance, it does not provide any information on the antenna/preamplifier noise. The contribution of the receiver measurement noise to the range error will depend very much on the quality of the GPS receiver.
Figure 3.5 Zero baseline test for evaluating the performance of a GPS receiver.
According to [2], typical average value for range error due to the receiver measurement noise is of the order of 0.6m (1s-level).
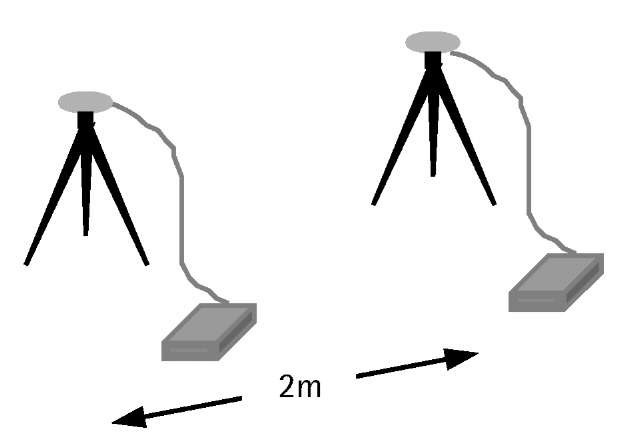
To evaluate the actual field performance of a GPS system, it is necessary to include the antenna/preamplifier noise component [12]. This can be done using short baselines of a few meters apart, observed on two consecutive days (see Figure 3.6). In this case, the double difference residuals of one day would contain the system noise and the multipath effect. All other errors would cancel sufficiently. As the multipath signature repeats every sidereal day, differencing the double difference residuals between the two consecutive days eliminates the effect of multipath and leaves only the system noise.
Ionospheric delay
At the uppermost part of the earth’s atmosphere, ultraviolet and X-ray radiations coming from the sun interact with the gas molecules and atoms. These interactions result in gas ionization: a large number of free "negatively charged" electrons and "positively charged" atoms and molecules [13]. Such a region of the atmosphere where gas ionization takes place is called the ionosphere. It extends from an altitude of approximately 50 km to about 1,000 km or even more (see Figure 3.1). In fact, the upper limit of the ionospheric region is not clearly defined [14, 15].
Figure 3.6 Short baseline test for evaluating the performance of a GPS system.
The electron density within the ionospheric region is not constant; it changes with altitude. As such, the ionospheric region is divided into subregions, or layers, according to the electron density. These layers are named D (50-90 km), E (90-140 km), F1 (140-210 km), and F2 (210-1,000 km), respectively, with F2 usually being the layer of maximum electron density. The altitude and thickness of those layers vary with time, as a result of the changes in the sun’s radiation and the Earth’s magnetic field. For example, the F1 layer disappears during the night and is more pronounced in the summer than in the winter [14].
The question that may arise is: How would the ionosphere affect the GPS measurements? The ionosphere is a dispersive medium, which means it bends the GPS radio signal and changes its speed as it passes through the various ionospheric layers to reach a GPS receiver. Bending the GPS signal path causes a negligible range error, particularly if the satellite elevation angle is greater than 5°. It is the change in the propagation speed that causes a significant range error, and therefore should be accounted for. The ionosphere speeds up the propagation of the carrier phase beyond the speed of light, while it slows down the PRN code (and the navigation message) by the same amount. That is, the receiver-satellite distance will be too short if measured by the carrier phase and too long if measured by the code, compared with the actual distance [3]. The ionospheric delay is proportional to the number of free electrons along the GPS signal path, called the total electron content (TEC). TEC, however, depends on a number of factors: (1) the time of day (electron density level reaches a daily maximum in early afternoon and a minimum around midnight at local time); (2) the time of year (electron density levels are higher in winter than in summer); (3) the 11-year solar cycle (electron density levels reach a maximum value approximately every 11 years, which corresponds to a peak in the solar flare activities known as the solar cycle peak—in 2001 we are currently around the peak of solar cycle number 23); and (4) the geographic location (electron density levels are minimum in midlatitude regions and highly irregular in polar, auroral, and equatorial regions). As the ionosphere is a dispersive medium, it causes a delay that is frequency dependent. The lower the frequency, the greater the delay; that is, the L2 ionospheric delay is greater than that of L1. Generally, ionospheric delay is of the order of 5m to 15m, but can reach over 150m under extreme solar activities, at midday, and near the horizon [5].
This discussion shows that the electron density level in the ionosphere varies with time and location. It is, however, highly correlated over relatively short distances, and therefore differencing the GPS observations between users of short separation can remove the major part of the ionospheric delay. Taking advantage of the ionosphere’s dispersive nature, the ionospheric delay can be determined with a high degree of accuracy by combining the P-code pseudorange measurements on both L1 and L2. Unfortunately, however, the P-code is accessible by authorized users only. With the addition of a second C/A-code on L2 as part of the modernization program, this limitation will be removed [2]. The L1 and L2 carrier-phase measurements may be combined in a similar fashion to determine the variation in the ionospheric delay, not the absolute value. Users with dual-frequency receivers can combine the L1 and L2 carrier-phase measurements to generate the ionosphere-free linear combination to remove the ionospheric delay [5]. The disadvantages of the ionosphere-free linear combination, however, are: (1) it has a relatively higher observation noise, and (2) it does not preserve the integer nature of the ambiguity parameters. As such, the ionosphere-free linear combination is not recommended for short baselines. Single-frequency users cannot take advantage of the dispersive nature of the ionosphere. They can, however, use one of the empirical ionospheric models to correct up to 60% of the delay [13]. The most widely used model is the Klobuchar model, whose coefficients are transmitted as part of the navigation message. Another solution for users with single-frequency GPS receivers is to use corrections from regional networks [15]. Such corrections can be received in real time through communication links.
Tropospheric delay
The troposphere is the electrically neutral atmospheric region that extends up to about 50 km from the surface of the earth (see Figure 3.1). The troposphere is a nondispersive medium for radio frequencies below 15 GHz [16]. As a result, it delays the GPS carriers and codes identically. That is, the measured satellite-to-receiver range will be longer than the actual geometric range, which means that a distance between two receivers will be longer than the actual distance. Unlike the ionospheric delay, the tropospheric delay cannot be removed by combining the L1 and the L2 observations. This is mainly because the tropospheric delay is frequency independent.
The tropospheric delay depends on the temperature, pressure, and humidity along the signal path through the troposphere. Signals from satellites at low elevation angles travel a longer path through the troposphere than those at higher elevation angles. Therefore, the tropospheric delay is minimized at the user’s zenith and maximized near the horizon. Tropos-pheric delay results in values of about 2.3m at zenith (satellite directly overhead), about 9.3m for a 15°-elevation angle, and about 20-28m for a 5°-elevation angle [17, 18].
Tropospheric delay may be broken into two components, dry and wet. The dry component represents about 90% of the delay and can be predicted to a high degree of accuracy using mathematical models [18]. The wet component of the tropospheric delay depends on the water vapor along the GPS signal path. Unlike the dry component, the wet component is not easy to predict. Several mathematical models use surface meteorological measurements (atmospheric pressure, temperature, and partial water vapor pressure) to compute the wet component. Unfortunately, however, the wet component is weakly correlated with surface meteorological data, which limits its prediction accuracy. It was found that using default meteorological data (1,010 mb for atmospheric pressure, 20°C for temperature, and 50% for relative humidity) gives satisfactory results in most cases.
Satellite geometry measures
The various types of errors and biases discussed earlier directly affect the accuracy of the computed GPS position. Proper modeling of those errors and biases and/or appropriate combinations of the GPS observables will improve the positioning accuracy. However, these are not the only factors that affect the resulting GPS accuracy. The satellite geometry, which represents the geometric locations of the GPS satellites as seen by the receiver(s), plays a very important role in the total positioning accuracy [5]. The better the satellite geometry strength, the better the obtained positioning accuracy. As such, the overall positioning accuracy of GPS is measured by the combined effect of the unmodeled measurement errors and the effect of the satellite geometry.
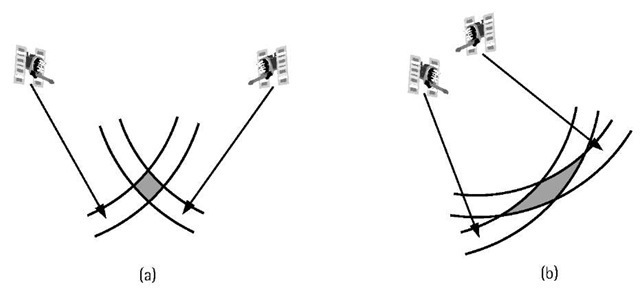
Good satellite geometry is obtained when the satellites are spread out in the sky [19]. In general, the more spread out the satellites are in the sky, the better the satellite geometry, and vice versa. Figure 3.7 shows a simple graphical explanation of the satellite geometry effect using two satellites [assuming a two-dimensional (2-D) case]. In such a case, the receiver will be located at the intersection of two arcs of circles; each has a radius equal to the receiver-satellite distance and a center at the satellite itself. Because of the measurement errors, the measured receiver-satellite distance will not be exact and an uncertainty region on both sides of the estimated distance will be present. Combining the measurements from the two satellites, it can be seen that the receiver will in fact be located somewhere within the uncertainty area, the hatched area. It is known from statistics that, for a certain probability level, if the size of the uncertainty area is small, the computed receiver’s position will be precise. As shown in Figure 3.7(a), if the two satellites are far apart (i.e., spread out), the size of the uncertainty area will be small, resulting in good satellite geometry. Similarly, if the two satellites are close to each other [Figure 3.7(b)], the size of the uncertainty area will be large, resulting in poor satellite geometry.
The satellite geometry effect can be measured by a single dimensionless number called the dilution of precision (DOP). The lower the value of the DOP number, the better the geometric strength, and vice versa [3, 8]. The DOP number is computed based on the relative receiver-satellite geometry at any instance, that is, it requires the availability of both the receiver and the satellite coordinates. Approximate values for the coordinates are generally sufficient though, which means that the DOP value can be determined without making any measurements.
Figure 3.7 (a) Good satellite geometry; and (b) bad satellite geometry.
As a result of the relative motion of the satellites and the receiver(s), the value of the DOP will change over time. The changes in the DOP value, however, will generally be slow except in the following two cases: (1) a satellite is rising or falling as seen by the user’s receiver, and (2) there is an obstruction between the receiver and the satellite (e.g., when passing under a bridge).
In practice, various DOP forms are used, depending on the user’s need [19]. For example, for the general GPS positioning purposes, a user may be interested in examining the effect of the satellite geometry on the quality of the resulting three-dimensional (3-D) position (latitude, longitude, and height). This could be done by examining the value of the position dilution of precision (PDOP). In other words, PDOP represents the contribution of the satellite geometry to the 3-D positioning accuracy. PDOP can be broken into two components: horizontal dilution of precision (HDOP) and vertical dilution of precision (VDOP). The former represents the satellite geometry effect on the horizontal component of the positioning accuracy, while the latter represents the satellite geometry effect on the vertical component of the positioning accuracy. Because a GPS user can track only those satellites above the horizon, VDOP will always be larger than HDOP. As a result, the GPS height solution is expected to be less precise than the horizontal solution. The VDOP value could be improved by supplementing GPS with other sensors, for example, the pseudolites.Other commonly used DOP forms include the time dilution of precision (TDOP) and the geometric dilution of precision (GDOP). GDOP represents the combined effect of the PDOP and the TDOP.
To ensure high-precision GPS positioning, it is recommended that a suitable observation time be selected to obtain the highest possible accuracy. A PDOP of five or less is usually recommended. In fact, the actual PDOP value is usually much less than five, with a typical average value in the neighborhood of two. Most GPS software packages have the ability to predict the satellite geometry based on the user’s approximate location and the approximate satellite locations obtained from a recent almanac file for the GPS constellation. The almanac file is obtained as part ofthe navigation message, and can be downloaded free of charge over the Internet (e.g., from the U.S. Coast Guard Navigation Center [20]).
GPS mission planning
Even under the full constellation of 24 GPS satellites, there exist some periods of time where only four satellites are visible above a particular elevation angle, which may not be enough for some GPS works. Such a satellite visibility problem is expected more at high latitudes (higher than about 55°) because of the nature of the GPS constellation [4]. This problem may also occur in some low- or midlatitude areas for a particular period oftime. For example, in urban and forested areas, the receiver’s sky window is reduced as a result of the obstruction caused by the high-rise buildings and the trees. Because the satellite geometry changes over time, the satellite visibility problem may be overcome by selecting a suitable observation time, which ensures a minimum number of visible satellites and/or a particular maximum DOP value. To help users in identifying the best observation periods, GPS manufacturers have developed mission-planning software packages, which predict the satellite visibility and geometry at any given location.
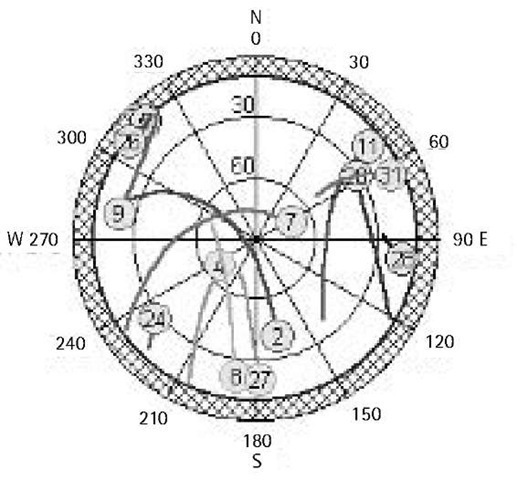
Mission-planning software provides a number of plots to help in planning the GPS survey or mission. The first plot is known as the sky plot, which represents the user’s sky window by a series of concentric circles. Figure 3.8 shows the sky plot for Toronto on April 13, 2001, which was produced by the Ashtech Locus processor software.
Figure 3.8 GPS sky plot for Toronto on April 13, 2001.
The center point represents the user’s zenith, while the outer circle represents his or her horizon. Intermediate circles represent different elevation angles. The outer circle is also graduated from 0° to 360° to represent the satellite azimuth (direction) at any time. Once the user inputs his or her approximate location and the desired observation period, the path of each satellite in his or her view will be shown on the sky plot. This means that relative satellite locations, the satellite azimuth and elevation, can be obtained. The user may also specify a certain elevation angle, normally 10° or 15°, to be used as a mask or cutoff angle. A mask angle is the angle below which the receiver will not track any satellite, even if the satellite is above the receiver’s horizon.
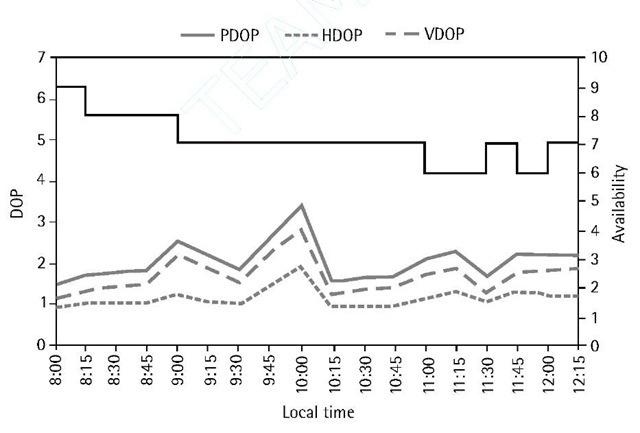
Other important plots include the satellite availability plot, which shows the total number of the visible satellites above the user-specified mask angle, and the satellite geometry plot. Figure 3.9 shows the satellite availability and geometry for Toronto on April 13, 2001. The satellite geometry plot is normally represented by the PDOP, HDOP, and VDOP.
Figure 3.9 Satellite availability and geometry for Toronto on April 13, 2001.
User equivalent range error
It has been shown that the GPS positioning accuracy is measured by the combined effect of the unmodeled measurement errors and the effect of the satellite geometry. The unmodeled measurement errors will certainly be different from one satellite to another, mainly because of the various view angles. In addition, the ranging errors for the various satellites will have a certain degree of similarity (i.e., correlated). To rigorously determine the expected GPS positioning accuracy, we may apply an estimation technique such as the least-squares method [8, 18]. The least-squares method estimates the user’s position (location) as well as its covariance matrix. The latter tells us how well the user’s position is determined. In fact, the covariance matrix reflects the combined effect of the measurement errors and the satellite geometry.
A more simplified way of examining the GPS positioning accuracy may be achieved through the introduction of the user equivalent range error (UERE). Assuming that the measurement errors for all the satellites are identical and independent, then a quantity known as the UERE may be defined as the root-sum-square of the various errors and biases discussed earlier [3]. Multiplying the UERE by the appropriate DOP value produces the expected precision of the GPS positioning at the one-sigma (1-s) level. To obtain the precision at the 2-s level, sometimes referred to as approximately 95% of the time, we multiply the results by a factor of two. For example, assuming that the UERE is 8m for the standalone GPS receiver, and taking a typical value of HDOP as 1.5, then the 95% positional accuracy will be 8 X 1.5 X 2 = 24m.
