Earth Tide Displacements of the GPS Station
The Earth tide is a phenomenon of the deformation of the elastic body of the Earth caused by the gravitational attracting force of the Moon and the Sun. Such a deformation depends not only on the changing of the force, but also on the physical structure and motion of the Earth (Melchior 1978).
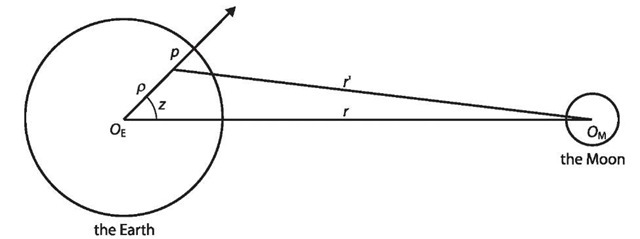
Generally, the Sun-Moon-Earth system may be separated into two two-body systems for discussing the effects of the Sun and the Moon on the Earth, respectively. For the Moon-Earth system, the mass centre can be found out according to the definition. It lies on a straight line between the centres of the Earth and the Moon, and has a distance to the centre of the Earth of about 0.73RE, where RE is the radius of the Earth (Fig. 5.7). For the point-mass p (with unit mass) on the Earth, the tidal potential generated by the Moon can be derived as
where r is the geocentric distance of the Moon, p is the geocentric distance of point p, ![]() is the gravitational constant of the Moon, z is the geocentric zenith angle of the Moon, and r’ is the distance between the point p and the centre of the Moon. The 1 / r’ in Eq. 5.140 can be developed by Legendre polynomials, and then
is the gravitational constant of the Moon, z is the geocentric zenith angle of the Moon, and r’ is the distance between the point p and the centre of the Moon. The 1 / r’ in Eq. 5.140 can be developed by Legendre polynomials, and then
where![]() is the conventional Legendre polynomials of n degree. Applying the well-known formula of spherical astronomy (cf., e.g., Lambeck 1988),
is the conventional Legendre polynomials of n degree. Applying the well-known formula of spherical astronomy (cf., e.g., Lambeck 1988),
to Eq. 5.141 and using the addition theorem (cf., e.g., Lambeck 1988), Laplace’s formula of the tidal potential can be obtained by
where![]() is the latitude of computing point
is the latitude of computing point![]() are the declination and local hour angle of the Moon, and
are the declination and local hour angle of the Moon, and![]() is the associated Legendre polynomials of degree n and order k. Laplace’s formula shows the significant geometric and periodic characters of the tidal potential.
is the associated Legendre polynomials of degree n and order k. Laplace’s formula shows the significant geometric and periodic characters of the tidal potential.
Fig. 5.7. The Earth-Moon system
Similar discussions can be made for the Earth-Sun system, and the related tidal potential can be obtained by substituting the gravitational constant of the Sun![]() and geocentric distance of the Sun into Eq. 5.143. The total tidal potential is the summation of both potentials generated by the Moon and the Sun. The truncating order of the summation can be selected due to the precision requirement and the truncating errors can be estimated by considering
and geocentric distance of the Sun into Eq. 5.143. The total tidal potential is the summation of both potentials generated by the Moon and the Sun. The truncating order of the summation can be selected due to the precision requirement and the truncating errors can be estimated by considering![]() and the ratio
and the ratio![]() of the Moon and the Sun.
of the Moon and the Sun.
The tidal displacements resulting from the tidal potential are then
where![]() are the tidal displacements in the radial, north and east directions,respectively; h and l are the Love and Shida numbers (in more detailed words,
are the tidal displacements in the radial, north and east directions,respectively; h and l are the Love and Shida numbers (in more detailed words,![]() are the Love and Shida numbers of degree n);
are the Love and Shida numbers of degree n);![]() is the tidal potential of degree n,
is the tidal potential of degree n, ![]() is the gravitational constant of the Earth; and .
is the gravitational constant of the Earth; and .![]() is the radius of the Earth. It is notable that the tidal potential includes a permanent (i.e., time independent) part. This part of the tide is now included in the geoid definition, which has already been accepted by IAG in 1983 (Poutanen et al. 1996). Therefore, such a term has to be carefully dealt with. Examples to move or to keep the permanent tidal term from the above formulas may be found in IERS standard (McCarthy 1996).
is the radius of the Earth. It is notable that the tidal potential includes a permanent (i.e., time independent) part. This part of the tide is now included in the geoid definition, which has already been accepted by IAG in 1983 (Poutanen et al. 1996). Therefore, such a term has to be carefully dealt with. Examples to move or to keep the permanent tidal term from the above formulas may be found in IERS standard (McCarthy 1996).
Simplified Model of the Earth Tide Displacements
The vector displacement of the station due to degree 2 of the tidal potential is (McCarthy 1996; Zhu et al. 1996)
where![]() is the gravitational constant of the Earth,
is the gravitational constant of the Earth,![]() is the equatorial radius of the Earth, j =1, 2 are indices for the Moon and Sun, respectively,
is the equatorial radius of the Earth, j =1, 2 are indices for the Moon and Sun, respectively,![]() are the geocentric identity vectors of the Moon (or Sun) and station,
are the geocentric identity vectors of the Moon (or Sun) and station,![]() are the magnitude of the related geocentric vectors, and
are the magnitude of the related geocentric vectors, and![]() are nominal degree 2 Love and Shida numbers (for an elastic Earth model, the nominal values are 0.6078 and 0.0847). In Eq. 5.147, the terms factorised by
are nominal degree 2 Love and Shida numbers (for an elastic Earth model, the nominal values are 0.6078 and 0.0847). In Eq. 5.147, the terms factorised by![]() are the radial and transverse components of the tidal displacement. Taking the latitude dependence into account,
are the radial and transverse components of the tidal displacement. Taking the latitude dependence into account,![]() shall have the forms of
shall have the forms of
The vector displacement of the station due to degree 3 of the tidal potential is (McCarthy 1996)
where![]() Here only the radial component of the Moon is considered.
Here only the radial component of the Moon is considered.
As discussed in Sect. 5.4.1, there is a permanent part of the tidal deformation included in the degree 2 tidal potential. The projects of the permanent displacement into the radial and north directions are
This must be removed from the computation of Eq. 5.147 according to the IERS standard. Generally, the tidal displacements computed using the model given above have accuracy on a mm level.
In GPS applications, the computing time is usually the GPS time, and the coordinates of the stations are given in the CTS system. However, the ephemerides of the Sun and Moon are given in the CIS coordinate system with time TDT. Therefore, time and coordinates have to be transformed to a unique time-coordinate system. The details of the time-coordinate system can be found in Chap. 2.
Usually the ephemerides of the Sun and the Moon are computed or forecasted every half day (12 hours). The ephemerides of the Sun and the Moon at a required epoch are interpolated from the data of the two adjacent epochs![]() ‘ by using a 5-order polynomial:
‘ by using a 5-order polynomial:
For data at two epochs, e.g.:
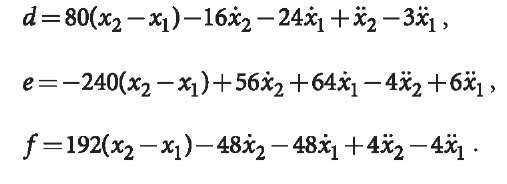
where x and x are the velocity and acceleration components related to x. Considering the formulas of![]() and letting
and letting![]() one gets
one gets![]() and
and![]() Letting
Letting![]() coefficients of d, e, f can be derived theoretically, e.g., in the case of
coefficients of d, e, f can be derived theoretically, e.g., in the case of![]()
For y and z components, the formulas are similar. Such an interpolating algorithm is accurate enough for using the given half day ephemerides of the Sun and Moon to get the data at the required epoch. The computation of the ephemerides of the Sun and Moon will be discussed in Sect. 11.2.8.
Numerical Examples of the Earth Tide Effects
The Earth tide effects could reach up to 60 cm world-wide (Melchior 1978; Poutanen et al. 1996) and, e.g., 30 cm in Greenland.The effect of the Earth tide on the GPS positioning is a well-known correction term, which has to be taken into account in many cases as soon as the Earth tide effect is greater than the accuracy requirement of GPS results. The tidal parameters (Love and Shida numbers) can be also determined through global GPS observations.
Only the GPS positioning, which is carried out on the air without fixed reference on the Earth, is free from the Earth tide effects. For the GPS relative positioning of a small regional area, the tidal effects may be neglected because of the small differences in the tidal displacements. In the relative airborne kinematic GPS positioning, the airborne antennas are free from Earth tide effects. However, the static references fixed on the Earth are not free from tidal effects. In this case, the tidal displacements are independent from the size of the applied area or lengths of the baselines and have to be taken into account.
Three examples are given to illustrate the tidal displacements.The IERS standards are used as the principle of the Earth tide effect computation (McCarthy 1996).
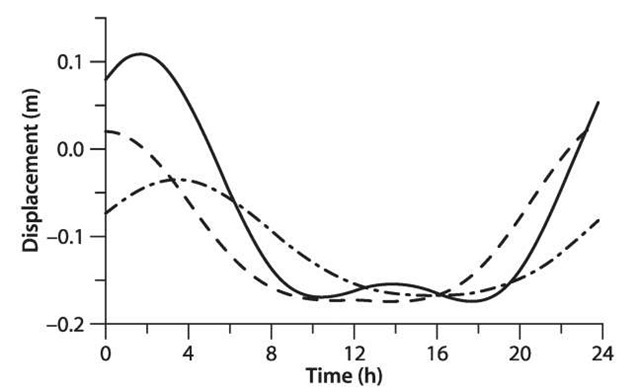
Three stations in Greenland were selected for computation of a whole day (GPS time used) of tidal displacements on 31 December 1998. Coordinates were quite roughly selected for Narsarsuaq (60°, 315°), Scoresbysund (70°, 339°) and Thule (77°, 290°). Heights were selected as 50 meters. Results of the vertical components are illustrated as 2-D graphics with the 1st axis time in hours and the 2nd axis displacement in meters. Continuous, broken-dot, broken lines represent the results of the 1st, 2nd and 3rd stations, respectively (Fig. 5.8, units: meters). The tidal displacements of the three stations in Greenland have a maximum difference of about 15 cm. The size of the triangle of the three stations is about 2 000 km. The change of the tidal displacements in the vertical component is about 27 cm. That change could happen within the duration of 4 to 5 hours.
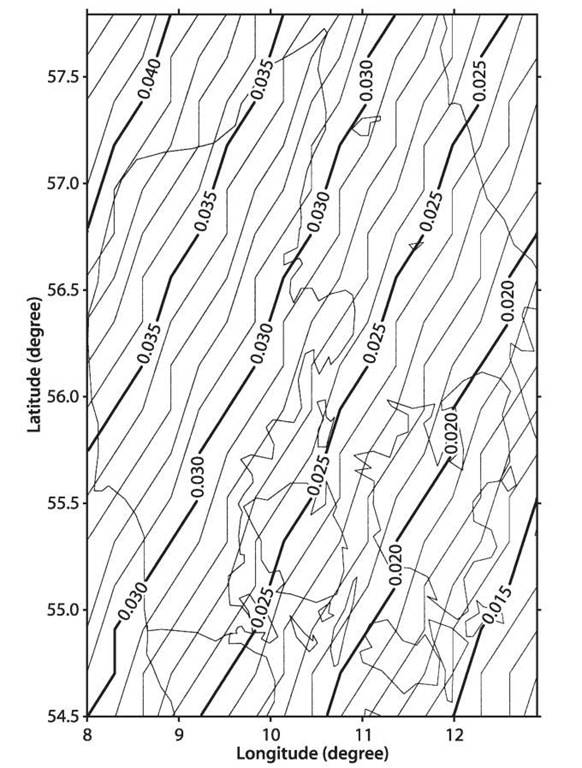
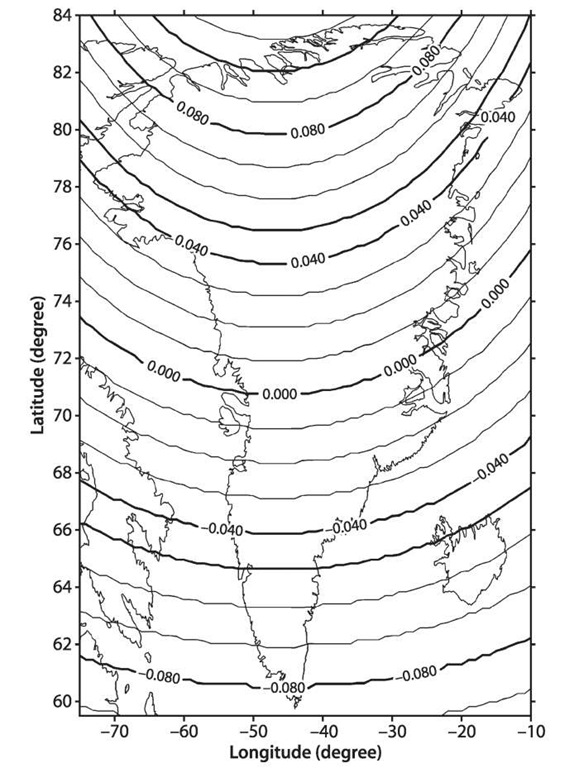
Two grid data of 0.2 x 0.3 degrees for Denmark![]() and 1 x 1 degrees for Greenland
and 1 x 1 degrees for Greenland![]() with real topography height are used to compute vertical tidal displacements at time 1:00 and 1:45, respectively.
with real topography height are used to compute vertical tidal displacements at time 1:00 and 1:45, respectively.
The displacements are illustrated with contour lines (units: meters) plotted in Fig. 5.9 and Fig. 5.10 with the 1st axis longitude in degrees and the 2nd axis latitude in degrees. In Fig. 5.9 there is a tidal difference of 15 mm, which shows that within an 80 km distance or area in Denmark the tidal difference can reach up to 5 mm. Figure 5.10 shows that there is a vertical tidal difference of about 17 cm in Greenland.
Fig. 5.8.
Earth tide displacements at three stations in Greenland.
Fig. 5.9.
Earth tide displacement (in meters) in Denmark
Fig. 5.10.
Earth tide displacement (in meters) in Greenland
These computations indicate that in differential GPS kinematic airborne (not touching the Earth) applications, a lack of the Earth tide correction could cause an accuracy of less than 30 cm in Denmark and Greenland. For the Earth-touched kinematic and static differential GPS applications, a lack of Earth tide correction would cause an accuracy of less than 2 cm in Denmark and 15 cm in Greenland.
It is worth mentioning that the average value of the Earth tide effects on a GPS station during 24 hours is generally not zero (it may be up to a few cm). This is because the Earth tide is an effect that includes many periodical components. This indicates that the Earth tide effects cannot be eliminated through daily averaging.
Ocean Loading Tide Displacement
The ocean tide is a time varying load on the Earth’s surface. The displacement of the Earth’s surface due to loading is called the ocean tide loading effect. Similar to the Earth tide, the loading Love numbers are introduced to describe the relationships of the loading potential and the loading displacement as
where![]() are the loading tide displacements in the radial, north and east directions, respectively,
are the loading tide displacements in the radial, north and east directions, respectively,![]() are the loading Love numbers (in more detail,
are the loading Love numbers (in more detail,![]() are the loading Love numbers of degree n),
are the loading Love numbers of degree n),![]() is the loading potential of degree n,
is the loading potential of degree n, ![]() is the gravitational constant of the Earth, and RE is the radius of the Earth. It is notable that the zero degree loading Love number and 1 degree loading displacement exist and in the case of
is the gravitational constant of the Earth, and RE is the radius of the Earth. It is notable that the zero degree loading Love number and 1 degree loading displacement exist and in the case of![]() Loading Love numbers can be obtained from a theoretical model.
Loading Love numbers can be obtained from a theoretical model.
The loading displacement shall fulfil the elastic balance equation under the boundary condition of loading. This is called the Boussinesq boundary value problem. The response of the spherical Earth under the loading of a point-mass (or unit mass) is called the Green function. In other words, the Green function is the solution of the partial differential equation of the Boussinesq problem under a certain spherical boundary condition of a point-mass loading. For a related boundary condition, the related Green function can be derived. Farrell derived the following loading displacement Green functions (Farrel 1972):
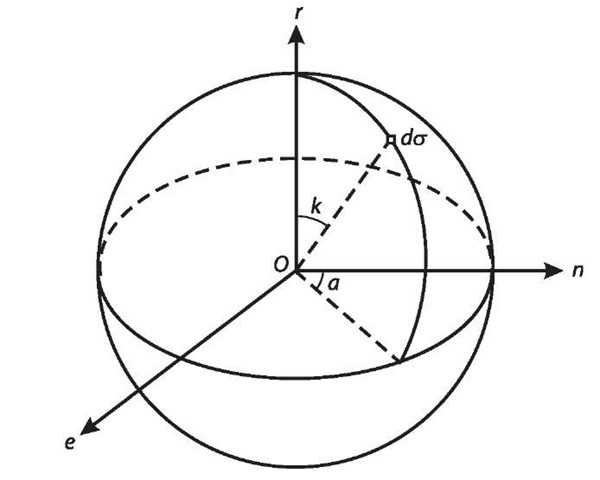
where R is the radius of the Earth, Me is the mass of the Earth, k is the geocentric zenith distance of the loading point (related to the computing point, see Fig. 5.11), Pn(cos k) is the Legendre function, and u(k) and v(k) are the radial and tangential loading displacement Green functions, respectively.
According to the definition of the Green function, the loading displacements of the ocean tide of the whole Earth can be obtained by multiplying the tidal mass to the Green function and integrating that over the whole ocean
Fig. 5.11.
Ocean loading
where a is the azimuth of the integrating surface element![]() is the density of the oceanic water
is the density of the oceanic water![]() H is the height of ocean tide, and
H is the height of ocean tide, and![]() are the loading displacements of radial, north and east components, respectively. It is obvious that an ocean tide model is needed here.
are the loading displacements of radial, north and east components, respectively. It is obvious that an ocean tide model is needed here.
The Schwiderski global ocean tide model is one of the most used models, which has a resolution of![]() and represents the tidal amplitude and phase (Schwiderski 1978, 1979, 1980, 1981a-c). The accuracy of the loading tide modelling depends on the accuracy of the loading response and ocean tide model. Because of the irregularity of coastlines and because the loading response is more dependent on the local variable properties of the lithosphere (Farrel 1972), modelling of the loading effects cannot be done very accurately.
and represents the tidal amplitude and phase (Schwiderski 1978, 1979, 1980, 1981a-c). The accuracy of the loading tide modelling depends on the accuracy of the loading response and ocean tide model. Because of the irregularity of coastlines and because the loading response is more dependent on the local variable properties of the lithosphere (Farrel 1972), modelling of the loading effects cannot be done very accurately.
Let
where![]() is the ocean tide constituent with angular velocity
is the ocean tide constituent with angular velocity![]() is the truncating wave number, F is any to be integrated function,
is the truncating wave number, F is any to be integrated function,![]() are the functional value and the size of the
are the functional value and the size of the![]() surface element, and N is the total elements number. If one changes the order sequence of the summations then Eqs. 5.155-5.157 turn out to be
surface element, and N is the total elements number. If one changes the order sequence of the summations then Eqs. 5.155-5.157 turn out to be
In other words, the loading displacements can be represented by summations of displacements of the different wave of frequencies, and the amplitude and phase of the related wave are dependent on the computing position.
Computation of the Ocean Loading Tide Displacement
Computation of the loading displacement depends on which ocean tide model is used. Because of the strong dependence of the loading on the coast near tide, besides a global ocean tide model a modified model near the coastlines is added quite often to raise the precision of computation. Taking advantage of the fact that the amplitude and phase of the related wave depends only on the computing position, the computation can be greatly simplified. Generally, only 11 tidal constituents are taken into account. These are the semi-diurnal waves![]() , the diurnal waves
, the diurnal waves![]() and the long-period waves
and the long-period waves![]() The loading displacement vector in IERS standard (McCarthy 1996) is
The loading displacement vector in IERS standard (McCarthy 1996) is
where j =1, 2, 3 represent the displacement in radial, west and south directions, respectively, ampj(i) and phasej(i) are the amplitude and phase of the ith wave related to the computing station of jth component, arg(i, t) is the argument of ith wave at the computing time t, a>i is the angular velocity of the ith wave, xi is the astronomical argument at time of 0 hour, and f and ui depend on the longitude of the lunar node. a>i, f and u{ can be found in Table 26 of Doodson (1928). The ampj(i) and phasej(i) are computed for a list of stations by Scherneck (McCarthy 1996). The coefficients and software are available by Scherneck.
Numerical Examples of Loading Tide Effects
Loading tide effects could reach up to 10 cm at some special coast regions (cf., e.g., Andersen 1994; Khan 1999). The loading displacements affect mostly only the GPS stations near the coast. The displacements at most continental stations are less than 1 cm. Loading correction has not been commonly considered in GPS data processing because the computation is more complicated, and modelling is less accurate. However, for precise applications, loading effects have to be taken into account. Using software, e.g., designed by Scherneck, the loading amplitude and phase of the significant waves can be obtained for static stations. The coefficients can be computed beforehand and used for even real time applications. Kinematic GPS receivers on the air are free of loading effects. Car-borne kinematic GPS applications are generally limited within regional areas, and the relative effects are generally very small. For exactness, the loading effects can be interpolated from that of the surrounding static stations.
Fig. 5.12.
Ocean loading tide effects of two GPS stations (height components)
An example is given to illustrate the loading tide displacements of a vertical component (Fig. 5.12). The AG95 model is used as the principle of the loading effects computation (Andersen 1994). Loading displacements of two stations are computed for a whole day (GPS time used) on the 18 March 1999. Coordinates are quite roughly selected for station Brst (48.3805°, 355.5034°) and IGS station Wtzr (49.1442°, 12.8789°). Results of the height components are illustrated as 2-D graphics with the 1st axis as time in hours and the 2nd axis displacement in meters. Continuous and broken lines represent the results of the 1st and 2nd stations, respectively. The loading displacements of the two stations have a maximum difference of about 6 cm.
This computation indicates that a lack of loading tide correction could cause an accuracy of a few centimetres for some applications. Even for differential applications, a lack of loading tide correction could cause an accuracy of less than 6 cm in the given example.
It is worth mentioning that the average value of the loading effects on a GPS station during 24 hours is generally very small. This indicates that the loading effects could be eliminated through daily averaging. In a static case, either loading correction or no loading correction may cause a difference of the standard deviation of the length of a baseline up to 0.5 cm (Khan 1999).
Analogue to the tropospheric model parameterisation, a loading parameter may be introduced for a static station near the coast due to less accuracy of the loading modelling. The parameter (e.g., a factor of the total loading vector) may be determined through GPS data processing.


