The code observables provide a noisy but complete measurement of the pseudorange while the phase observables provide a relatively noise-free but biased measurement of the pseudorange. Carrier-smoothing is one approach that has been to achieve an unbiased and smooth pseudorange estimate. In this section, we present the approach for non-differential wide-lane phase and narrow-lane code observables. This approach can also be used directly with L1 code and phase for a single frequency receiver, but the designer should be careful due to the issue of code-carrier divergence. Eqns. (8.106) and (8.108) have the form
![]() Note the C is a constant and that
Note the C is a constant and that![]() is an integer. Eqns. (8.109-8.110) are (again) of the exact form considered in Example 5.4; therefore, C can be estimated as
is an integer. Eqns. (8.109-8.110) are (again) of the exact form considered in Example 5.4; therefore, C can be estimated as
 The carrier-smoothed pseudorange
estimate is
where![]() so the code noise and multipath effects are significantly reduced over time; however, by its definition following eqn.(8.110),
so the code noise and multipath effects are significantly reduced over time; however, by its definition following eqn.(8.110),![]() is still (fully) affected by
is still (fully) affected by![]() The ionospheric term can be estimated as in eqn. (8.98) and compensated. This leaves the tropospheric, ephemeris, and SV clock errors as the dominant elements of the range error.
The ionospheric term can be estimated as in eqn. (8.98) and compensated. This leaves the tropospheric, ephemeris, and SV clock errors as the dominant elements of the range error.
The carrier-smoothing approach is also applicable to differentially corrected pseudorange and phase measurements, in which case the residual tropospheric, ephemeris, and SV clock errors would be small.
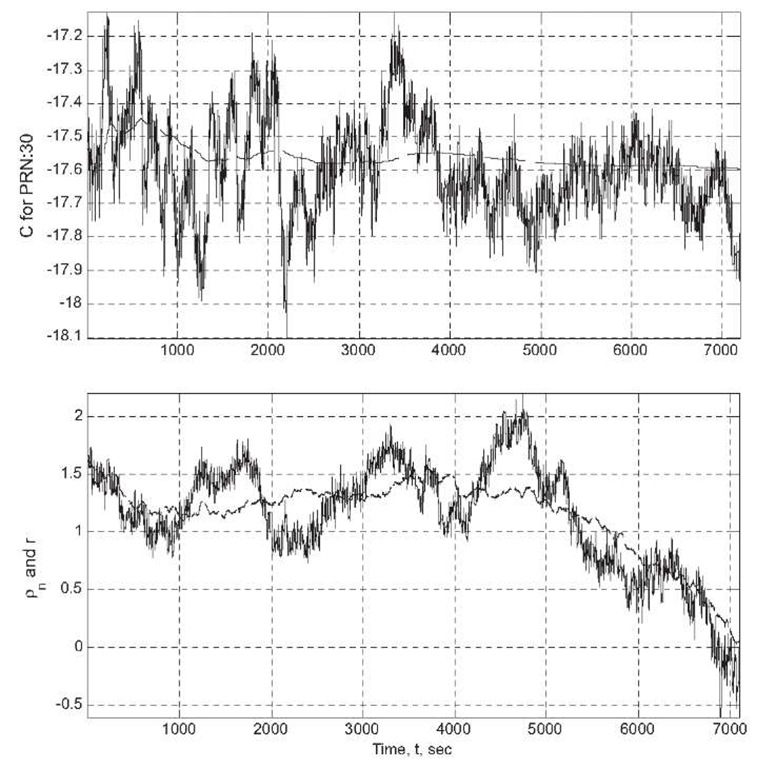
Figure 8.12: Carrier smoothed code results for Example 8.5. Top – Results for PRN 30. The solid line is![]() The dashed line is
The dashed line is![]() Bottom The solid line is
Bottom The solid line is![]() The dashed line is r.
The dashed line is r.
Example 8.5 Figure 8.12 displays results of the carrier smoothed code operation. The top graph displays (solid) and C (dashed). The estimate of the constfnt C is significantly smoother than the instantaneous value of
![]()
The variable r is the pseudorange plus the ionosphere and common mode errors. In particular, for the i-th SV, r contains the range![]() and the receiver clock error which are large and change rapidly relative to the other terms in r.
and the receiver clock error which are large and change rapidly relative to the other terms in r.
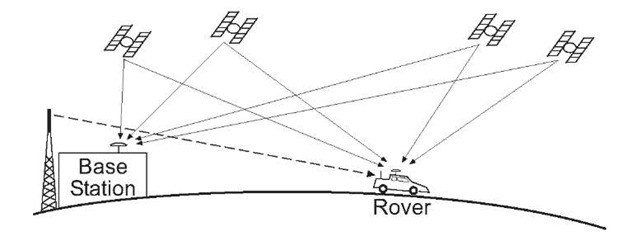
Figure 8.13: Differential GPS scenario with GPS signals indicated by solid lines and DGPS correction signals indicated by dashed lines.
Therefore, a comparison of the graphes of![]() and
and![]() is not informative due to the large vertical scale. Therefore, the lower graph in Figure 8.12 instead plots
is not informative due to the large vertical scale. Therefore, the lower graph in Figure 8.12 instead plots
and
where p0 is a fixed position selected to be near the receiver location. The differences within the parentheses remove the effects of satellite motion. The difference between the two terms in parentheses removes the effect of the receiver clock. These differences result in a convenient scale factor for the plot, without changing the characteristics of the comparison. The graph of eqn. (8.113) is the solid line. The graph of eqn. (8.114) is the dashed line. A


