Stochastic Processes
Navigation systems combine uncertain information related to a vehicle to construct an accurate estimate of the vehicle state. The previous topic discussed deterministic models of dynamic systems that are appropriate for modeling the vehicle dynamics or kinematics. In navigation applications, the information uncertainty does not typically arise from the vehicle dynamics; instead, it arises from noise and imperfections in the sensors. To optimally combine the information from sensed quantities, we will use the vehicle model, quantitative descriptions of uncertainty in the sensed quantities, and models of the relation between the sensed quantities and the vehicle states. Development of the required models and quantitative descriptions is the realm of stochastic process. The objective of this topic is to introduce the relevant concepts from the field of stochastic processes. This field is quite large; therefore, the topic must be selective in the information that it presents and will focus on the material required for the implementation of aided navigation systems. It is assumed that the reader already has some background knowledge of statistics and probability theory.
Knowledge of stochastic processes is required for navigation system design and analysis, yet many students find the topic difficult. This is in part due to the lack of familiarity with the role and utility of stochastic processes in daily life. After introducing a few basic concepts, this section presents a few motivational examples that should be understandable to readers with an engineering background.
Random variables are functions that map random experimental outcomes to real numbers. The idea of a random variable can be more clearly motivated after a few key terms are defined. A random experiment involves a procedure and an observation of an experimental outcome. There is some degree of uncertainty in either the procedure or the observation, which necessitates the experiment. The uncertainty often arises from the extreme complexity of modeling all aspects of the experiments procedure and observation with sufficient detail to determine the output. Consider the example of a coin toss. The procedure involves balancing the coin on the thumbnail, flicking the thumb, allowing the coin to land and settle to a stationary position on a flat surface. The observation involves determining which surface of the coin is on top. Most people have performed this experiment numerous times. Almost nobody would seriously consider trying to determine the initial forces and torques applied by the thumb to the coin, the aerodynamics during flight, or the impact forces and torques upon landing that would be required to predict the result of any given toss. The complexity of such a deterministic prediction motivates the use of a (fair) coin toss as an unbiased tool in many decision making situations.
The utility of probability theory and stochastic processes is that it provides the analyst with the ability to make quantitative statements about events or processes that are too complicated to allow either exact replication of experiments or sufficiently detailed deterministic analysis. For example, even though an analyst might be incapable of predicting the outcome of a single coin toss, by analyzing a sufficiently large number of experiments, the analyst might be able to predict which surface of an unfair coin has a higher likelihood of landing upwards. To be useful, the theory for this analysis should allow quantitative statements concerning the number of observations required to achieve any desired level of confidence in such a prediction. In fact, such analysis is quite commonplace.
The efficacy of random analysis has motivated a mathematically sophisticated theory for probability and probabilistic reasoning. This theory is based on measure theory. Using probability theory, we analyze models of experiments instead of the experiments themselves. Therefore, the analyst must be careful to consider whether the probabilistic model is a sufficiently accurate model of the experiment.
Examples
The topic of stochastic processes is very important to the study of navigation system design as it is the foundation on which we build our ability to quantitatively analyze the propagation of uncertainty through the navigation system as a function of time. A thorough presentation of the related topics of statistics, probability theory, random variables, and stochastic processes is well beyond the scope of this text. Several excellent texts are mentioned at the conclusion of this topic. Instead, this topic focuses on topics selected for their relevance to the design and analysis of navigation systems. The following examples are intended to motivate the topics discussed in the balance of this topic.
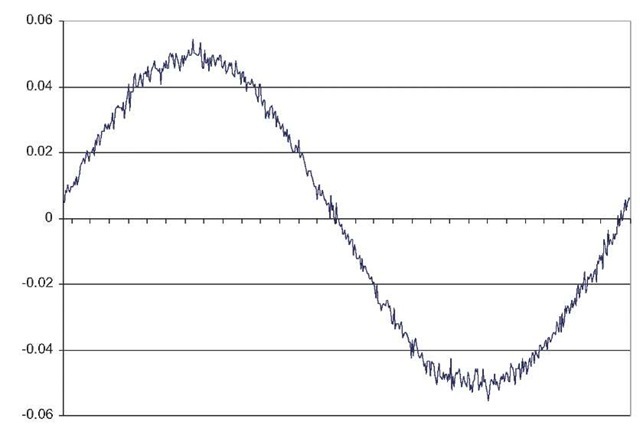
Figure 4.1: Oscilloscope image of a sinusoidal input.
Example 4.1 Most engineers have used an oscilloscope at some point in their careers. An example image from an oscilloscope screen is shown in Figure 4.1. This image is created by directly connecting the output of a sinusoidal source to the oscilloscope input. The image clearly shows a noisy version of a sinusoidal signal. This figure is included to clearly exemplify the concept of measurement noise. The noise is the result of several complex physical processes, e.g., thermal noise in the probes and electronic parts. Quite often it is accurate to describe a measurement in the form
where y represents the measurement, x represents the actual value of some physical property, S is a scale factor, and v represents measurement noise. Typically, the manufacturer of the instrument is careful to design the instrument such that the scale factor S is constant and accurately known and that the measurement noise v is not related to the signal x. In addition, the manufacturer will often provide the purchaser with the quantitative description of v suitable for further analysis. To be able to communicate with sensor manufacturers and other navigation engineers and to be able to perform quantitative analysis, the analyst must be familiar with stochastic process definitions and methods. A
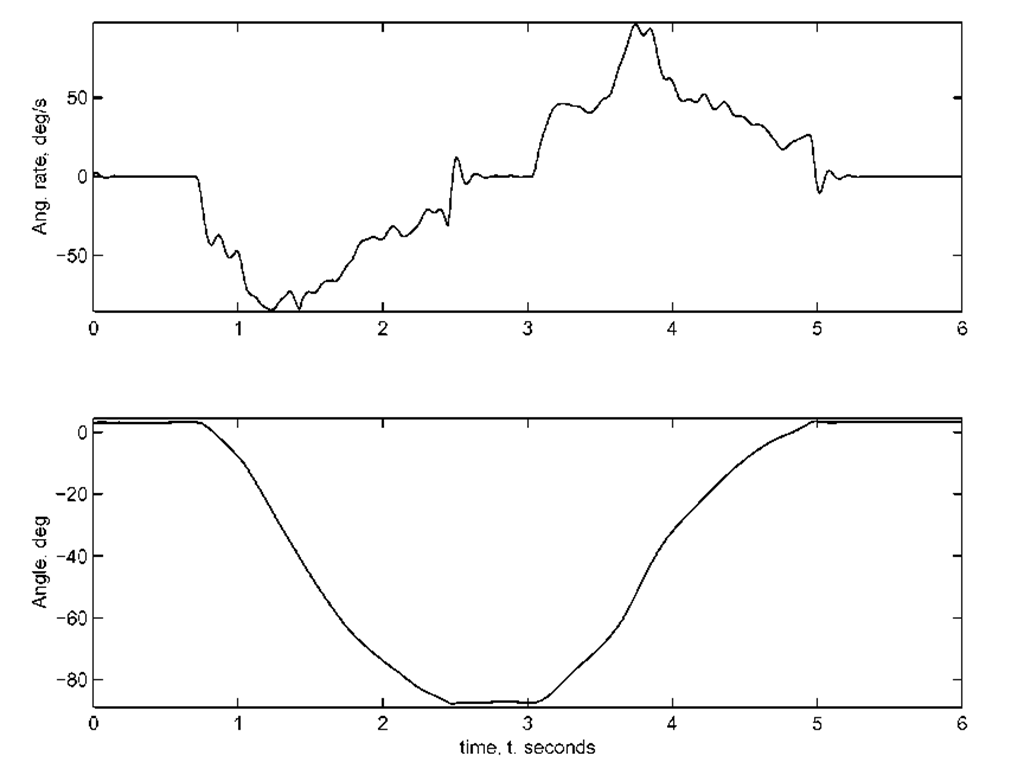
Figure 4.2: Angular rate (top) and integrated angle (bottom) for Example 4.2.
Example 4.2 This example illustrates the types of processes and signals that occur in navigation systems and some possible questions that are of interest via stochastic analysis methods.
An angular rate measurement![]() from a gyro is shown as the top graph of Figure 4.2. The gyro is mounted in such a way that it can only rotate about a single axis that corresponds to the gyro sensitive axis. The analyst would like to understand the nature of the error between the true angle and the angle estimate computed by integration of the gyro output.
from a gyro is shown as the top graph of Figure 4.2. The gyro is mounted in such a way that it can only rotate about a single axis that corresponds to the gyro sensitive axis. The analyst would like to understand the nature of the error between the true angle and the angle estimate computed by integration of the gyro output.
To begin, we determine a model for the sensor signal. The model can either be determined by laboratory experiments performed by the analyst or, more typically, provided by the sensor manufacturer. The methodology for estimating the error model is discussed in Section 4.9.2. For this example, assume that the angular rate sensor is accurately modeled as
where r represents the real rotation rate around the sensitive axis of the gyro, bg represents a very slowly changing component often referred to as a bias, and v corresponds to measurement error that has a distinct value at each measurement instance. Although we would prefer to integrate r(t) to compute 0, we only have available the signal r. Our integration of r yields the angle estimate![]() We will assume that
We will assume that![]() A model for the error
A model for the error
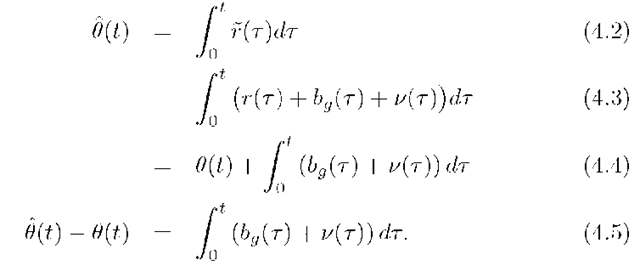
In this set of equations, eqn. (4.2) shows the actual computation of![]() as the integral of the sensor output
as the integral of the sensor output![]()
Eqns. (4.3-4.5) show analysis. The conclusion from eqn. (4.5) is that the error between the computed estimate![]() and the actual angle
and the actual angle![]() is the integral of the unknown quantity
is the integral of the unknown quantity![]()
For a well designed instrument, the bias and noise terms should be determined completely by events within the instrument (i.e., unaffected by external fields or by the motion of the device). In addition, although the values of bg and v may change with time in a nondeterministic manner, the characteristics of the change should be in a form that enables accurate quantitative characterization of the growth of the angle error. The desire to make accurate quantitative statements about characteristics of nonde-terministic signals motivates the introduction to and study of stochastic processes.
Returning to Figure 4.2, the integrated gyro signal![]() is shown as the bottom graph of Figure 4.2. We have returned to this figure to state an important point. During this experiment, the gyro was rotated by —90deg, left stationary, rotated by 90deg, and left stationary again. This motion is performed by a human. The erratic nature of the angular rate r is due to the human experimenter and is not the object of the stochastic analysis. The objects of the stochastic analysis are the sensor imperfections bg and v, and the error
is shown as the bottom graph of Figure 4.2. We have returned to this figure to state an important point. During this experiment, the gyro was rotated by —90deg, left stationary, rotated by 90deg, and left stationary again. This motion is performed by a human. The erratic nature of the angular rate r is due to the human experimenter and is not the object of the stochastic analysis. The objects of the stochastic analysis are the sensor imperfections bg and v, and the error![]() that they cause. Although we do not know the true values of
that they cause. Although we do not know the true values of![]() based on stochastic analysis we will be able to quantitatively predict the expected magnitude of
based on stochastic analysis we will be able to quantitatively predict the expected magnitude of![]() as a function of time, see Exercises 4.19. This example is further discussed in Exercise 5.7.
as a function of time, see Exercises 4.19. This example is further discussed in Exercise 5.7.
Plan of Study
The previous discussion and examples have been provided to motivate the material presented in this topic.
The primary objective for this topic is to present methods to model and analyze the behavior of the navigation error state as a function of time. The state space error models of such stochastic processes will be generalized versions of eqn. (4.6):
where the vector x represents the error in the navigation state. The vectors w and v are random variables determined in part by the navigation instruments. The matrices F(t) and H(t) are determined by the design of the navigation system. Such models are discussed in considerable detail in Sections 4.6-4.10. To understand and analyze such models requires knowledge of several additional concepts. Therefore, the topic first defines several concepts and quantities that have proven to be useful for analysis of stochastic processes. The main topics to be discussed include: definitions of important statistics, definitions of theoretical concepts (e.g., independence, random variables, stationarity), definition of white and colored noise processes, and properties of linear systems with random inputs. Readers already familiar with these topics should skip directly to Section 4.6, while only using Sections 4.2-4.5 for reference.


