An Aerial Photo That Can Be Used as a Map:The Digital Orthophoto
A digital orthophoto image is an aerial photograph, in digital form, with a very useful special property: It has been calibrated so that it may be used as a map; the coordinates of the map are precisely specified. As you may know, most aerial photographs, even when taken with the camera pointed vertically downward, have considerable distortion, due to several factors such as uneven terrain and lens distortion. Thus, if you measure a length on a conventional photograph that corresponds to a distance on the ground, an identical length measured elsewhere on the photograph usually will not correspond to the same distance on the ground. Said concisely, a standard aerial photograph does not have a consistent scale. In a digital orthophoto image, however, objects shown on the photograph at ground level are related by a points on objects above ground level (for example, on the roofs of buildconsistent scale, even if the terrain is dramatically uneven. (The locations of ings) are not, however, shown in their correct locations.)
Digital orthophotos may come in many forms. The one we look at here is called a "tiff" (which stands for "tagged image file format." Pathfinder Office has the capability of displaying such files as background files. The extension of tiff names is usually "tif." If a tiff file is keyed to a geographical location it may be called a "geotiff"; geotiffs contain the parameters to anchor the image to the proper points on the earth’s surface. If a tiff image is keyed to a geographic location but contains no geographic parameters then it must be accompanied by a world file; world files usually end in the extension "tfw." Pathfinder office requires that a tiff be a nongeotiff and that it be accompanied by a world file.18
In the directory ByeByeSA are the following files:
No_sa_ncr_doq.tif—a tagged image file—the special kind of digitized aerial photograph that can be used as a map, showing the highway the automobile was traveling at the time of transition. The term DOQ in the name stands for digital ortho quadrangle; quadrangle is just another term for an "almost rectangular" map.19
No_sa_ncr_doq.tfw—the "world file" for No_sa_ncr_doq.tif containing numeric parameters that tell Pathfinder Office where to place the image No_sa_ncr_doq.tif.
NoSA_Moving.SSF—a subset of a file taken in a moving automobile covering the minutes of transition when SA was discontinued.
{__ } Open __:\GPS2GIS\ByeByeSA\NoSA_Moving.SSF. Represent the file with a medium yellow line. Set the Time Zone to Eastern Daylight. Bring up the time line and note the time span of the file. If you look at Position Properties you will note that a number of fixes have been deleted. The idea was to capture just the time surrounding the transition.
{_} Prepare the map of the GPS track so that the digital orthophotowill be properly positioned: Before the aerial image can be displayed the geographic parameters of the map must be properly set. The DOQQQQ20 (stands for digital ortho quarter quarter quarter quadrangle—since it is one sixty-fourth of a standard USGS 7.5 minute quadrangle) is in the U.S. State Plane 1983 coordinate system, Kentucky North Zone (1601). The datum is NAD 1983 (Conus). The coordinate units, altitude units, and distance units are Survey Feet. Using the Units and Coordinate System choices under the Options menu, make sure these parameters are set up correctly.
{__ } Bring up a digital orthophoto image as a background to thefiles you have selected: From the File menu select Background. In the Load Background Files window remove any files that show up and then click Add. The window that appears (Add Background Files) might or might not represent the folder __ : \GPS2GIS\ByeByeSA. (If it doesn’t, navigate to that folder.) Select the file no_sa_ncr_doq.tif and click on Open. Read and okay a reminder if it shows up. Back in the Load Background Files window review the System, Zone, and Datum specifications. It probably appears that all is well, but it may not be. Click on Change to examine and correct parameters so they match the ones given in the previous step. Be particularly careful regarding Coordinate Units. In Kentucky they are in Survey Feet! Okay the Coordinate System window. Okay the Load Background Files window. An image should appear in the Map window.
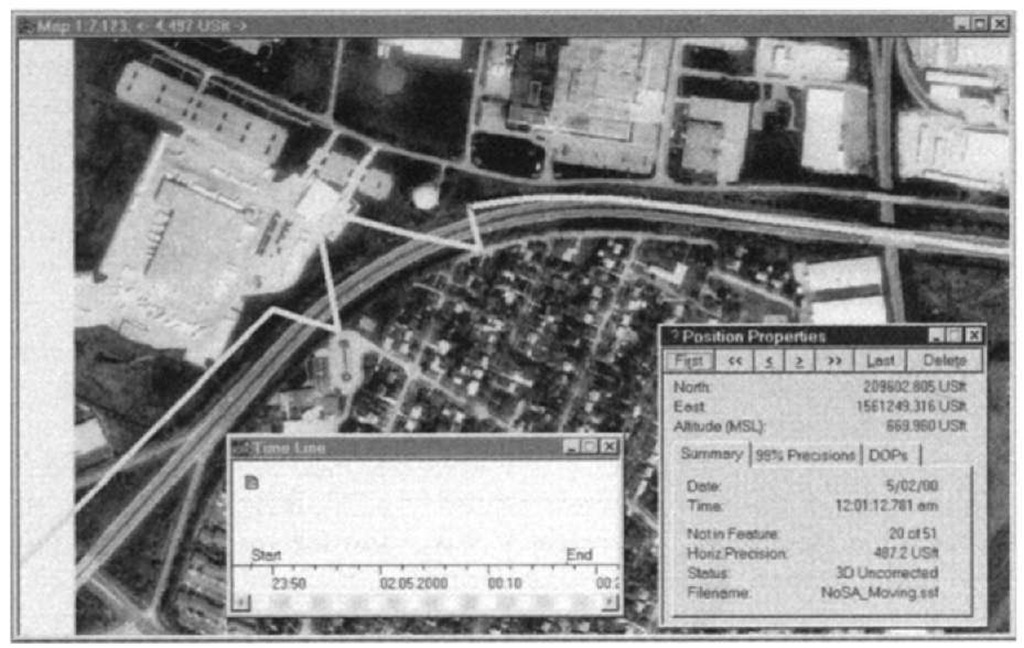
{__ } Make the main Pathfinder Office window occupy the full screen. Make the Map window wide as in Figure 3—8, so you can have Position Properties and Time Line up also. Zoom up on the part of the yellow track that crosses the DOQ. Look at the GPS tracks that represent the part of the trip on the divided highway that took place during the transition from "SA on" to "SA off." First the track, coming from the west, is way off the road, then you see some jagged spikes that occurred probably due to the transition, and finally the trace is at least in the right-of-way of the highway. With Position properties you can ascertain that the transition was completed at about 13 seconds after 12:01 AM on 2 May 2000.
PROJECT 3E—Your Data
Now that you have a good idea of how to use Pathfinder Office to display and analyze data taken with a GPS receiver.
{__ } Before beginning the computer work:
• Unless your instructor tells you otherwise, you must use the machine onto which you loaded your data;
Figure 3-8. Watch selective availability go away.
• Recall the name of the Project to which you transferred your data. It is probably DATA_yis (where "yis" indicates your initials). The folder in which you will work is __:\GPS2GIS\ DATA_yis.
• Bring with you the full name(s) of the file(s) you collected. Also have with you the values you calculated by hand in Project 1C.
• Bring the detailed map(s) of the area(s) where you took the data so you can compare what appears on the screen with the features shown on the map.
{__ } If necessary, start the Pathfinder Office software. Select Projects in the File menu. Make sure that the Project name is "DATA_yis." Click on the Open Folder icon on the Project toolbar. Click the "Details" button to see the dates on the files and folders. Review the files that are there to be sure that you are in the right folder. You should see a Backup, Base, and Export folder as well as your files. Select, with a single click, the first of the files you took. Look at the information about that file at the bottom of the window. Close the window without opening the file.
{__ } Examine the map you used in Project 2A to determine the correct units, coordinate system, and datum to use. Set up the software with these parameters.
{_} The representation now on the screen should be of the points (fixes) you collected, connected in the time order in which they were logged by the receiver.
The following steps assume that you took point data.
{__ }You set the GeoExplorer rover options before that session according to:
• Coordinates ~ Deg & Minutes (and decimal fractional parts thereof)
• Datum: (set to your map)
• Units ~ Custom ~ Distance: (set to your map)
• Units ~ Custom ~ Altitude Units: (set to your map)
• Units ~ Custom ~ Altitude Reference: Geoid (MSL)
• Date & Time ~ Set Local Time: (adjust to local time)
Set the Pathfinder Office options to the equivalents.
{__ } Select Position Properties. Click on a fix that is toward the middle of the cluster of points. Read its location at the bottom of the screen and write it down here.
• Latitude _____________
• Longitude ____________
• Altitude_
Is it about where you expected it to be? Compare its coordinate values against the averaged values in PROJECT 1C that you wrote down at that time.
We could make a Point_generic file (average all the fixes into a single point) as we did in Project 3B, but let’s look at another way of getting the average. The data collected by the GPS receiver and downloaded into the machine take the form of records, which are numbered strings of text. A given GPS file will have quite a few records—at least one for every fix taken, and usually a lot more. You can look at these records with a Trimble Utility called the SSF Record Editor. When the Record Editor is invoked it automatically averages the coordinates of all the fixes and appends additional statistical records to the file at the end. In the step below you will open the file in the Record Editor, look briefly at a few records, and then read the coordinates of the "average" point.
{__ } Go into the file menu and pick "Close" to close the current file. (The Record Editor will not calculate statistics on a file if the file is open.) You have already set up the proper parameters of datum, coordinate system, and units. In the Utilities menu select Other, then SSF Record Editor. The appropriate window will come up. Under File in that window click Open. You should then be able to select the file you have been working with from the window that shows up. Click Open. Make the SSF Record Editor window occupy the full screen.
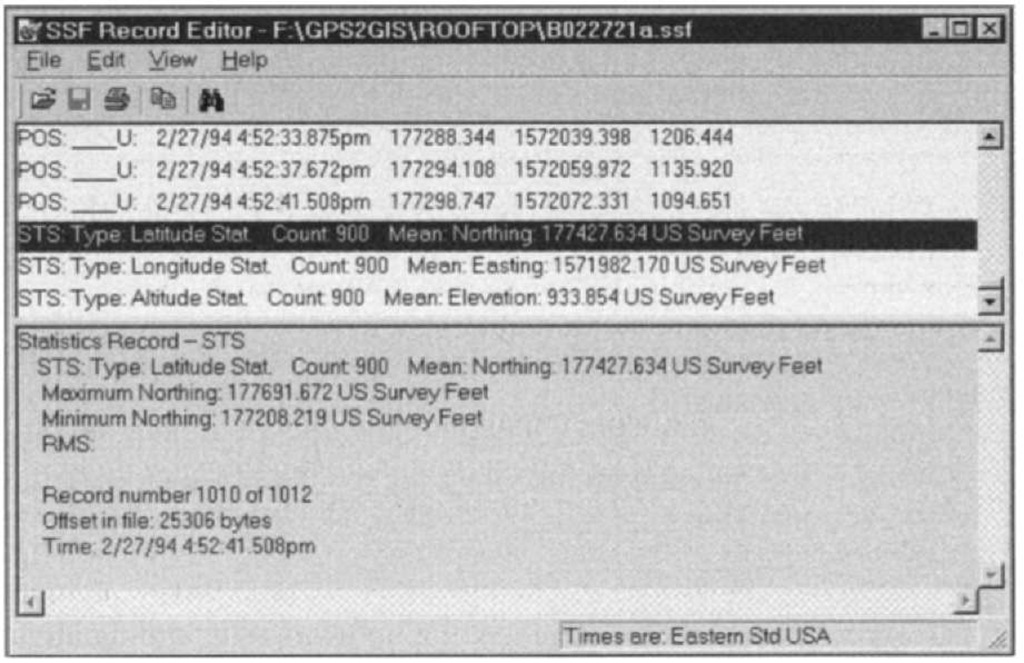
The resulting window is divided into two parts. (You can vary the position of the dividing line between them by dragging it with the mouse; "Split" in the View menu also works.) In the top part are the records of the file, beginning with a header record whose three letter designation is HDR. The HDR record is highlighted. In the lower part of the window are details in a more readable format relating to that highlighted record. Also, some records, like HDR, contain information not shown on the upper part of the window. This information appears in the bottom portion of the window. Make sure that the bottom part of the window is large enough to see all the text lines. Please see Figure 3—9.
Most SSF files have several types of records. Shortly you will see that toward the middle of the file you will find position (POS) records that tell you the time and position of each separate fix. At the end of the file are statistics records (STS).
{__ } Look at the information in the HDR record. Then use the down arrow key and/or Page Down to look at records further down in the file. Finally, drag the vertical slider to the bottom so that the STS records that were added to the end of the file show up. Use the "up arrow" key to select the "Latitude Stat" record. Write the coordinates of that and the following records here.
• Mean Latitude ————————
• Mean Longitude: ———————
• Mean Altitude:21-
{_} From the File menu exit the SSF Record Editor.
{__ } Some of the questions below have several blanks. Assuming you took data for both PROJECT 1B and PROJECT 2A in the same location, record the calculations you made in PROJECT 1C.
Figure 3-9. Finding statistics from the Record Editor.
{__ } Set up the datum, coordinate system, and units to correspond to those of the map you used in PROJECT 2B (where you moved the antenna along a path).
{__ } Bring in the file of PROJECT 2B and display the path you took while moving the antenna. Now query various points on the display and compare their coordinates with those on the map. Does the display correspond to the actual path you took?
{__ } Add the file that contains the fixes you collected in PROJECT 2A. Are the two sites in the correct relative position? If not, you may be using different projections, different datums, or different coordinate systems.


