Starting a New Project…and Saving It
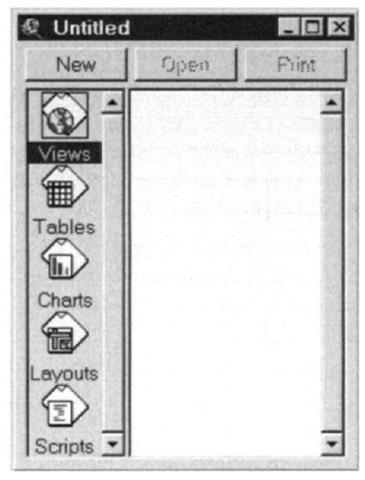
{_} Click on the only other Arc View menu item: "File."6 Click on "New Project." A window with the name "Untitled" will appear. See Figure 5—3.
{_} Start to save this empty project with a new title: From the "File" menu (note that the menu has changed, now that you have a project opened). Select "Save Project As.." A window of that name appears.
(Recall: The following instructions apply to Windows. They must be modified for UNIX systems; in particular, there is no "__ " drive and the slashes tilt the other way. Further, UNIX is case-sensitive. So when the text refers to "GPS2GIS" you may need to use "gps2gis"; "LXKX_yis" may be "lxkx_yis".)
{_} In Windows begin by selecting the "_:" disk drive by clicking in the "Drives:" box. (The little "down arrow" icon associated with the box indicates that options may be chosen.) Use the slider bar to look at all the available drives. Click on "_:".
{__} Put the project into the GPS2GIS \LEX_KNOX directory: Under "Directories" click on the "__:" folder. This will bring up all the subdirectories under the root. (If they don’t appear, double-click on the "_:" folder.) You can scroll through them (using the page and arrow keys—the entries are in alphabetical order) to find "GPS2GIS."
(You can make the process faster by highlighting any directory in the window, then typing a "g," which will take you to the top of the entries beginning with "g," typing "g" again will take you to the next entry beginning with "g," and so on.) When you locate "GPS2GIS," highlight it and press enter (double-click works also but is dangerous in this particular operation, for reasons to be explained shortly) to bring it to the top. It will show up directly under "__:\". The complete pathname, to which you will save the project, will also be shown under "Directories:"
{_} Click in the "File Name:" box. After clearing out any text already there (using delete and backspace), type the name
Figure 5-3. The ArcView Project window.
"LXKX_yis" (where "yis" stands for your initials, up to three) but don’t hit enter yet. Now click "OK." The project "LXKX_yis.apr"7 will have been saved to the directory C:\GPS2GIS. ("apr" stands for "Arcview PRoject") (It is dis concertingly easy to save a project in the wrong directory. If you just tap "Enter" without the correct name being under "Directories," or if you double-click on a folder that is the last one in the list, then ZAP— the project goes to that directory, correct or not. And since it is standard practice to doubleclick on folders to see what other folders are in them, it’s easy to make a mistake. And it is not particularly easy to delete a project from the wrong directory. But at least you get to make the mistakes using an empty project.)
{_} Dismiss the project window entitled "LXKX_yis." You may be asked if you want to save changes. Since you just saved the project, you do not.8 You should be back to the basic ArcView window with only "File" and "Help" as menu items.
Opening a Project
{__ } Select "File" and "Open Project," which is the way to bring up a previously saved project.
{__ } In the "Open Project" window you go through a procedure much like the one you used to save project LXKX_yis. You select the drive and directory, and file name. In this instance, ArcView probably will have made it easy for you by providing as defaults the drive, directory, and name of the project you just saved. Don’t be content with this. Experiment with all the options the window has to offer. Click on the arrow under "List Files of Type" to be certain you will be bringing up files of type "*.apr." Make the drive letter say "a:". (If there is no disk in the "a:" drive, abort the request.) Then choose "_:" again. Under "Directories" double-click on the "__:" folder. Then click on the "GPS2GIS" folder and hit enter. Now in the subwindow under "File Name" you should see (or be able to scroll to) "lxkx_yis.apr." Single-click on this, so that it appears directly under "File Name." Now everything is the way you want it, so click "OK." The project window, entitled "lxkx_yis.apr," will reappear. Along its left side will be icons called:
• Views
• Tables
• Charts
• Layouts
• Scripts
{__ } Only one of these icons may be active at a given time. The View icon has a box around it and its name is highlighted. Make "Charts" active with a single click. Now make "Views" active again.
{__ } Review the ArcView structure figure in the preceding section. Recall that a project may contain views, tables, charts, layouts, and scripts. A view contains themes.
Initiating a View
{_} Open a new view: With the View icon active, click "New."
Lots of things happen. A window appears, titled "View1." Also, two rows of icons appear across the top, just below the menu bar. They are called the button bar, on the upper level, and the toolbar, and we will make use of them shortly. (Briefly, the button bar invokes actions. The toolbar sets the tool you will be working with until you select another.) At this point you have several areas of the screen with which you can control ArcView. To summarize, they are:
• the menu bar (at the very top of the ArcView window),
• the button bar (next bar down),
• the toolbar (down again), and
• the icons representing the elements of a project (arrayed vertically down the left-hand side of the Project window).
{__ } A window that is active has a colored background in the title bar. You can make a window active by single-clicking on the title (or anywhere on the title bar). Make the Project window "lxkx_yis" active. Notice that the button bar changes and all icons on the toolbar disappear. Now make the "View1" window active.
{__ } As you know, you can move a window by dragging its title bar. Move "View1" so that it does not overlap "lxkx_yis." A window’s size may be changed by dragging a border or a corner of it. Enlarge "View1," making it tall, so it fills the right side of the screen. (By the way, it is not a good idea to maximize a window in ArcView. And don’t cover up the Project window completely—you’ll wonder where it went.)
Views and Coverages: Adding a GPS-Based Theme
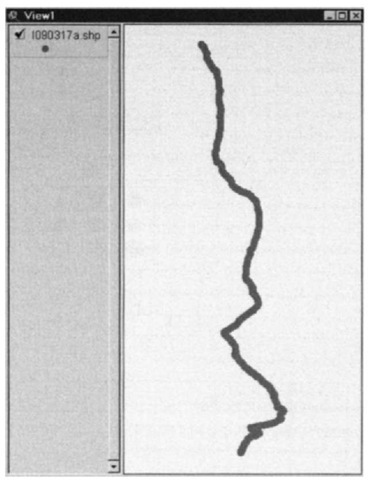
{_} Bring the shapefile named i090317a.shp into the "View1"window: Move the cursor (a pointer) to the menu bar and choose "View." Click on "Add Theme." Look in the _:\GPS2GIS \LEX_KNOX\ EXPORT directory for the shapefile. When you properly select that directory the file folder icon will appear as open and names of shapefile(s) will appear in the text box to the left. Single-click directly on the map icon next to the name I090317a.shp. Now click "OK." The "Add Theme" window will disappear and the shapefile name "I090317a.shp" will appear in the Table of Contents (referred to hereafter as the "T/C") of the View1 window.9 Also, you will see a fat dot in the T/C, which is the symbol that will be used to plot the points of the shapefile (which we will call a "theme" when it is opened in Arc View). Click on the little box next to the theme name. A check mark will appear there, and a solid line (actually composed of points representing the GPS fixes) will show up in the graphic area of View1. Please see Figure 5—4. This line represents the sequence of GPS fixes taken by the antenna of a car driven from Lexington, Kentucky to near Knoxville, Tennessee. The check mark next to the theme name means the theme is to be drawn in the View window. A checked box means the theme is on; unchecked is off. Turn the theme off and on a couple of times.
Editing the Legend
The dot that represents each GPS fix is so large that it overlaps the adjacent ones. We want to use a smaller symbol to represent the individual GPS points. Further, the color of the dot was picked "at random" by Arc View; you will change that also.
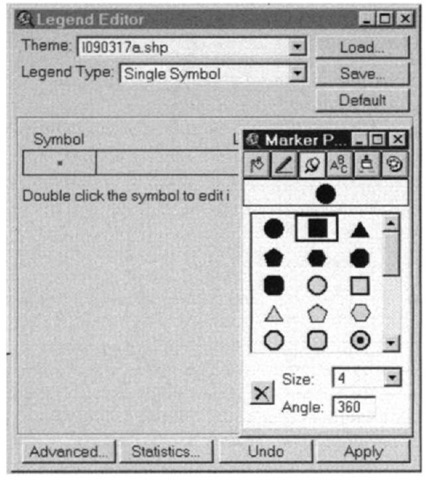
{__ } From "Theme" on the menu bar, choose "Edit Legend" to bring up the "Legend Editor" window, which will let you change the characteristics of a plotting symbol. Double-click directly on the circular symbol in the "Legend Editor" window. A window entitled "Marker Palette" appears. (You may want to move this window and enlarge it to see what you are doing.) Please see Figure 5—5. Click on the paint-brush icon to change the title to "Color Palette." Single-click on bright red and click "Apply" in the Legend Editor window. Note the change of color in the display.
{__ } In the "Color Palette," click on the "push pin" to change the title back to "Marker Palette." Select the square symbol at the top of the middle column. In the box designated "Size," click the size drop-down menu to get a list of possible sizes.
Figure 5-4. A GPS track—Laxington to Knoxville.
Pick 4. Click "Apply" to plot the data with this new symbol size. If you get confused, click "Undo," which changes things back to the way they were the last time you clicked "Apply." If you get really confused, close (dismiss) the editor and palette windows and start again.
{__ } It may not be obvious, but you now have a thin string of red boxes in the view window (we’ll look at zooming in Arc View later), so dismiss the legend and palette editors.
Projecting Coordinates
Had the earth been formed as a cube instead of a quasisphere, many things regarding representation of locations and features on it would be simpler. (Of course, many other things would be more complicated, but here we are just concerned with methods of representation of features on the earth’s surface.) The coordinate system that works best to represent a single location on earth is a spherical coordinate system.
Figure 5-5. Legend Editor & Marker Pallet windows.
It can be applied perfectly, producing no distortion. Unfortunately, if you have to deal with, say, two point locations, the mathematical formulas for determining the distance between them, or the direction one must travel to get from one to the other, are complex. For many reasons, it is useful to represent areas of the surface of the earth on a flat sheet in a Cartesian coordinate system. The distance and area formulas are simple; the medium of display (paper) is convenient. (A model globe, which could provide theoretically complete accuracy of representation, distance, shape, and size, would have to be astoundingly large to provide any reasonable level of detail for human-scale activity.) When you make a transformation (called a projection) from a spherical system to a Cartesian one, you inevitably introduce inaccuracies in the locations of points that were correct in the spherical coordinate system. So when dealing with large areas of real estate you are always caught in the dilemma of choosing (1) exact representation or (2) distorted representation which allows easy calculation and convenient display.
The image in the View—projected onto the (almost) flat screen of your monitor—is in latitude-longitude decimal degrees. (The coordinates are displayed toward the upper right-hand corner of the ArcView window.) Such images are wildly distorted because nowhere on earth (not even at the equator) does a degree of latitude represent the same distance as a degree of longitude. You cannot tell that this GPS track is distorted, because it is basically a line running from north to south. But if we put other data with it the distortion would become apparent. You will therefore change the view so that it shows data in Universal Transverse Mercator (UTM) coordinates. In UTM there is also distortion, but the effect is much reduced, especially over small areas.
{__ } Make certain the mouse pointer is a simple arrow by choosing the arrow symbol (it is on the toolbar, second from the left). Now slide the pointer around on the view. Note the coordinate values, reported on the right top of the screen, are something like -84.00 (for the east-west coordinate)10 and 37.00 (for north-south) toward the center of the view. These are the longitude and latitude, respectively, in decimal degrees. To reduce the distortion, you will convert the picture of the data you see, in the "View1" window, from the spherical coordinate system (the lat-lon graticule based on degrees and decimal fractions of a degree) to the UTM rectangular coordinate system for zone 16. The UTM units will be meters.
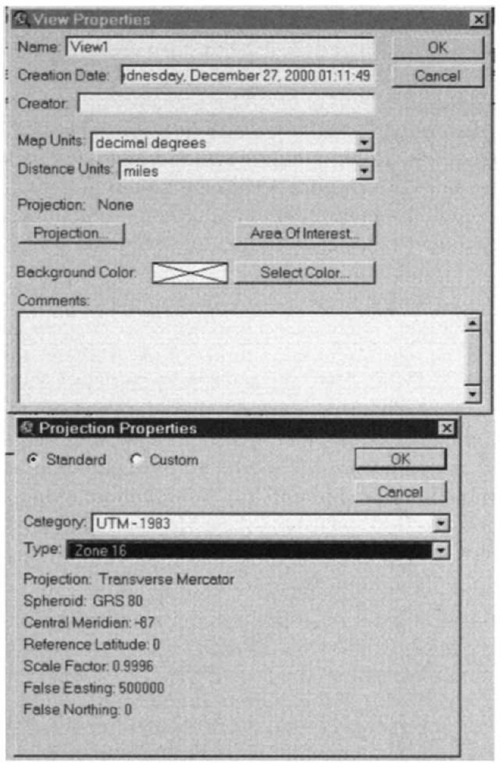
{__ } From the "View" menu, choose "Properties." Click on "Projection." A "Projection Properties" window should appear. Please see Figure 5—6.
{__ } Click in the box labeled "Category" to get a list. Choose UTM — 1983. Under "Type" choose Zone 16. (This is the UTM zone that contains the route delineated by the GPS fixes.) Note that the Central Meridian (the north-south line that bisects the zone) of the zone is 87 degrees west (-87°). Leave the standard option checked. Okay the "Projection Properties" window.
{__ } Back in "View Properties" do not change "Map Units" (from "meters") but do change "Distance Units" to kilometers. Choose a lime-green background color, just to remind yourself that the display is now in a different projection. Click "OK."
Figure 5-6. View & Projection Properties window.
{__ } Again slide the pointer around the view. Note that the coordinates toward the center of the window reported now are approximately 750,000 for the horizontal (that makes it 250,000 meters east of the central meridian of (-87°), right?) and 4,100,000 meters north of the equator for the vertical. It is important to understand that theoriginal data have not been converted— they are still in decimal degrees—but their visual representation in "View 1" has been alteredto reflect the UTM coordinate system.
{_} Click the title bar to make the lxkx_yis.apr window active.
Open the "File" menu by a single click. Move the cursor up and down the menu, noting that each highlighted menu item is explained in more detail at the bottom of the screen in a "message bar." When you have finished exploring, choose "Save Project" with a click. Again note the bottom of the screen for information.
Adding a Theme from ArcUSA
{_} Make the "View1" window active. In the "View" menu, choose "Add Theme." (Or use a shortcut: the second button from the left on the button bar performs the same function.) Construct the path to an ArcInfo coverage named "Cty2m" by doing the following:
Choose the drive "_:" (in Windows only; UNIX doesn’t have drive letters). Pounce11 on the "__:" file folder. Find the "GPS2GIS \Lex_Knox" file folder and double-click on it. Pounce on "arcusa." Pounce on "arcusa_d." Pounce on "usa_2mg"—the two-million-scale dataset in geographic (decimal degrees) format.
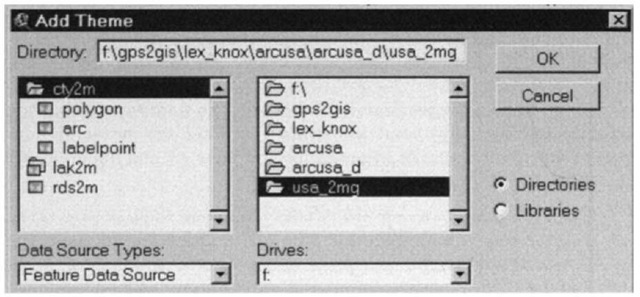
{_} In the left-hand part of the Add Theme window, find the file- folder-map-icon combination next to the name "Cty2m"; this represents a subset of the counties in the United States. A theme may be an ArcInfo coverage instead of a shapefile. A coverage might have both polygon and line features, as well as annotation. It gets a little subtle here. Carefully single-click directly on the icon next to the name. The folder should open to reveal its contents. See Figure 5—7.
Now single-click the icon again. Note that clicking like this opens and closes the folder. When it is open you can see what is in it. In this case, what is in it are geographic data sets labeled "polygon," "arc," and "labelpoint." With the folder open, click on "polygon." Then click "OK." After a brief time, "Cty2m" will appear in the T/C, along with a colored, solid rectangle that indicates that the theme is a polygon (areal12) one.
{__ } Turn Cty2m on by clicking in the box next to its name. Note that, after a bit, a number of polygons appear, representing counties which surround the GPS track. The GPS track itself does not appear, however. The reason is that it has been covered up by the polygon features. But a nice characteristic of ArcView is that you can specify the order in which themes in the T/C are drawn, and therefore control what themes are painted "on top of other themes.
Figure 5-7. Adding an ArcInfo coverage as an ArcView theme.
{__ } Draw the GPS track on top of the counties: Reverse the order of the two entries by placing the cursor on the T/C entry "Cty2m." and dragging it "south" of the "I090317a.shp" entry. View1 will be re-drawn, showing both themes.
The priority for drawing themes is directed by their order in the T/C. First, the theme at the bottom of the T/C list is "painted" on the view. Next to be painted is the theme second from the bottom, and so on. (Generally you would want to paint areal themes first, linear themes next, and point themes last.)
Themes in the T/C must be either on or off (drawn or not). They must also be active or not. A theme is active if the area in which its name and symbol appear is raised. You make a theme active by clicking on its name. A theme must be active for certain operations on it to take place (e.g., editing its legend). The importance of making a theme active—the right theme active—is illustrated next.
