Example: Subsets of Youth Violence
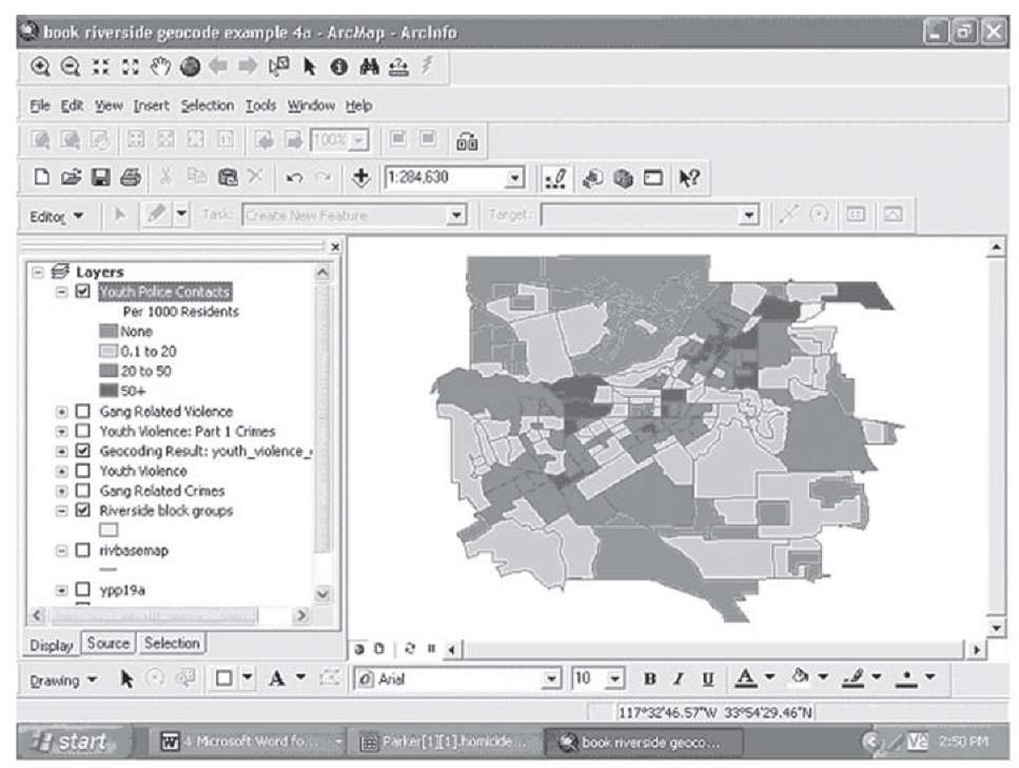
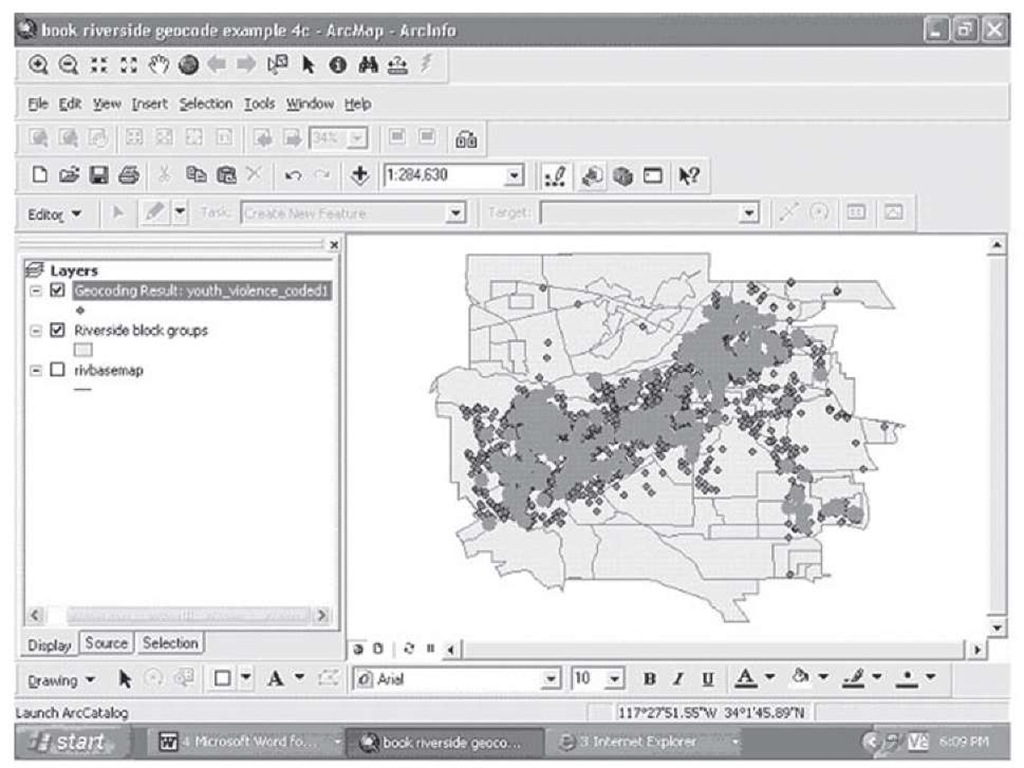
In Section 1 you learned to geocode by using an example from law enforcement: youth violent incidents in Riverside, CA (see Figure 1.31). Criminologists might be interested in the number of contacts youths in this area have with police as a method of finding effective policy implications. In this example, we will create a map showing the rate of youth violent contacts with police. Using the population of the block groups as a normalization factor (expressed as per 1000 population), the thematic map in Figure 2.13 can be displayed showing how the rates of youth violence vary across the city.
FIGURE 2.13 Rate of youth police contacts, Riverside
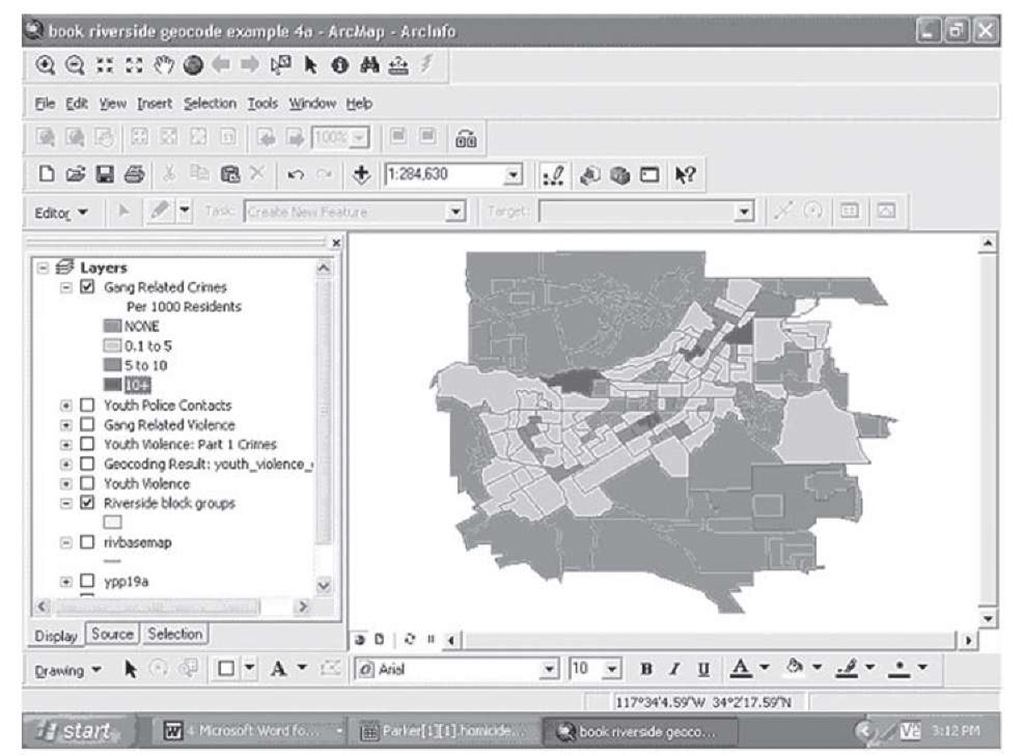
If you were working with the Riverside Police Department, you might want to use this map to decide how to allocate resources to combat youth violent criminal involvement by focusing your personnel, resources, and programs on the places with the highest rates (Figure 2.13). However, these data represent all the contacts and all types of violence that involve youth in the city. You might learn something different if you subset the data displayed here by different types of crime. Suppose, for example, that you are very concerned about youth gangs and their influence on youth violence in the city. These data contain information on whether or not the police contact was gang related or not. Subsetting the data on gang involvement and once again using the population per 1000 as a normalization factor yields the map in Figure 2.14.
FIGURE 2.14 Gang-related violence, Riverside
Comparing Figures 2.13 and 2.14, one difference is immediately apparent: the much lower rates of gang-related crimes compared to all youth crimes. In addition, different areas of the city have higher rates—there is some overlap, but notably an area in the lower right of the city seems to have a moderately high gang crime rate but a rather more modest overall youth crime rate. This would be an obvious target for enhanced prevention and enforcement activities targeted at gangs.
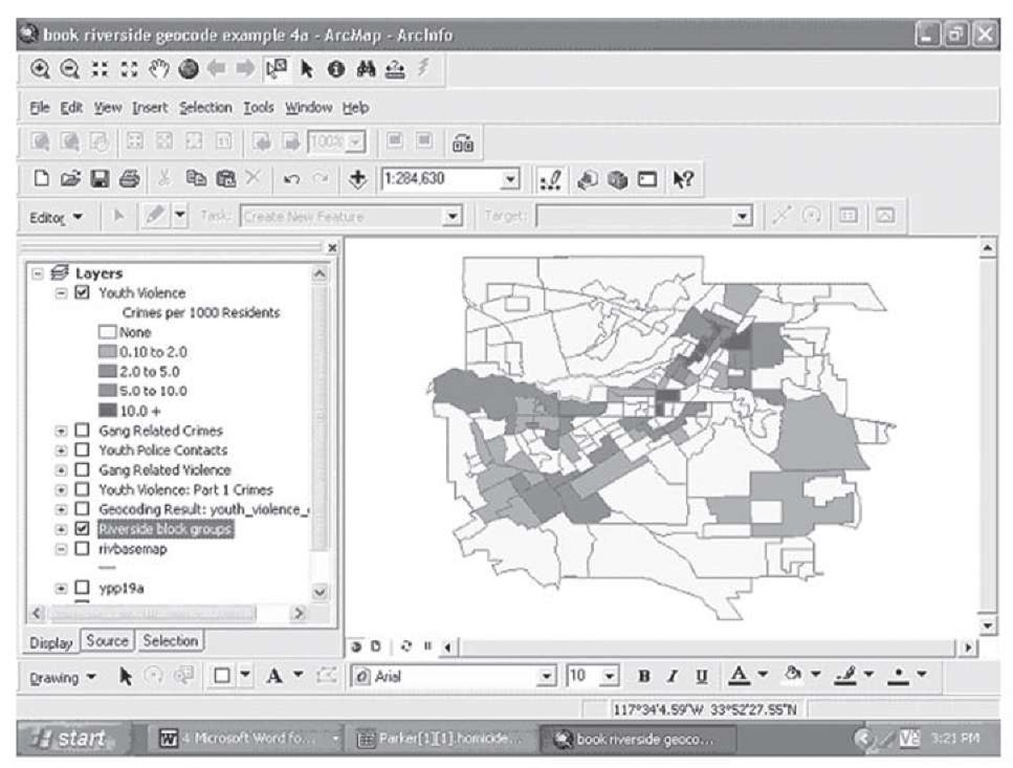
Some violent crimes are more serious than others. The FBI, the national internal police agency in the Federal government uses a system that classifies crimes into Part 1 and Part 2 crimes. Part 1 crimes are the most serious—in terms of violence, these include murder or homicide, robbery, rape, and aggravated assault. If we subset these data on these types of youth violence, the map of Riverside looks like that in Figure 2.15.
FIGURE 2.15 Youth violence Part 1 crimes; block group outlined
One block group is outlined to draw attention to it. If you compare this map with the previous two, you will note that in the overall map (Figure 2.13) and the gang-related incidents map (Figure 2.14) the block group highlighted in Figure 2.15 shows high rates in both overall and gang-related, but not in terms of Part 1, violence. It should be noted that Part 2 violence includes simple assaults, a crime that is often committed by gang members when they get in fights with other gang members; however, if your objective was to reduce Part 1 violence in the city, you would allocate resources and police officers differently than if you were focused on a different problem.
You can see from these examples the value of subsetting your data and examining the potentially different patterns that will emerge when you do so. In order to make informed decisions, you need to fully explore the different types of information available.
How do you subset data in ArcGIS? Beginning with the geocoding results from the overall youth violent incident data, the following steps will result in the subset maps shown in Figures 2.14 and 2.15.
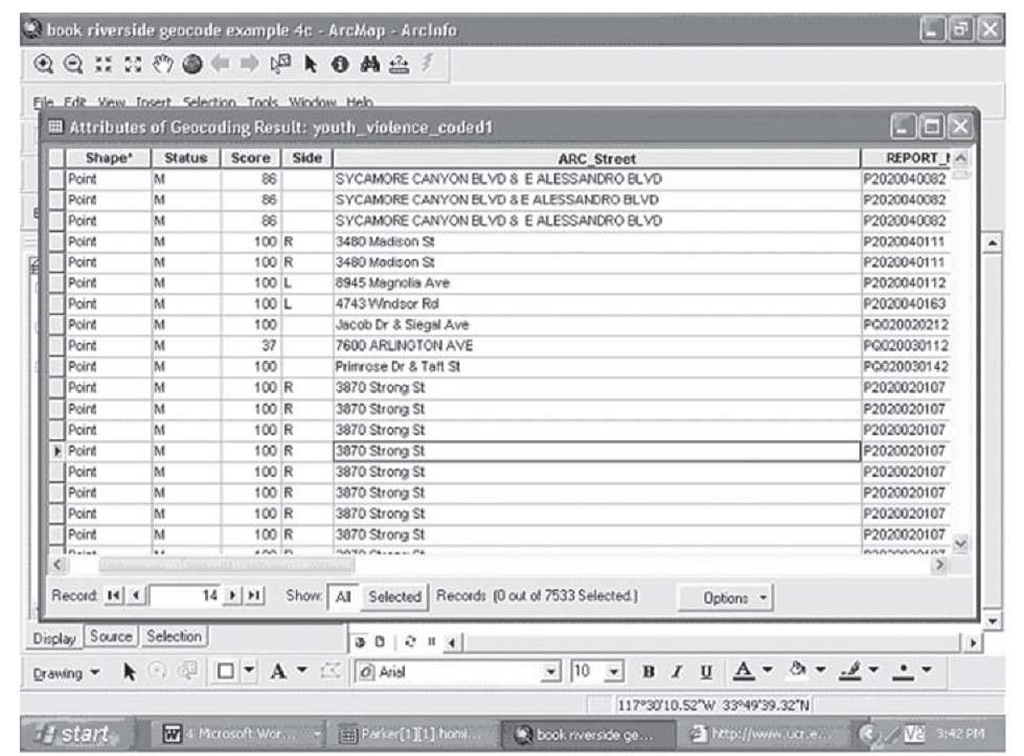
Step 1 Open the attribute table of the geocoded data layer, as in Figure 2.16.
Figure 2.16 Attribute table
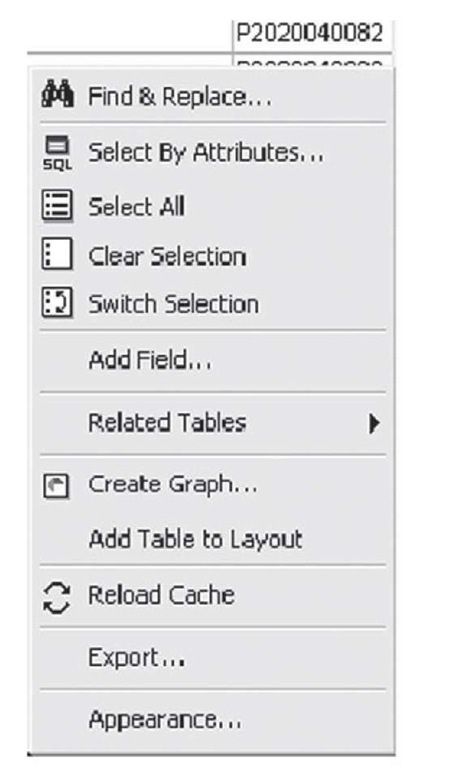
Step 2 Click on the Options button at the lower right to reveal a drop down menu (Figure 2.17).
FIGURE 2.17 The attribute table options drop down menu
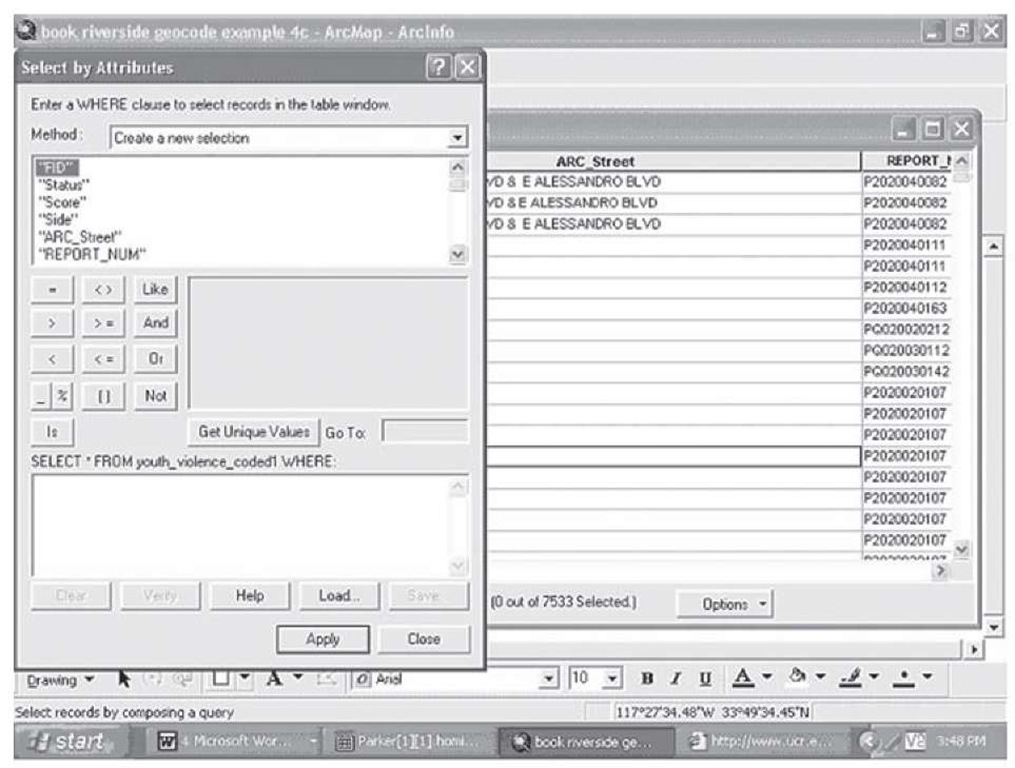
Step 3 Click on Select By Attributes, which brings up the window shown in Figure 2.18
FIGURE 2.18 Select by Attributes submenu
You will see that the fields from the attribute table are displayed in the selection submenu in the large window at the top.
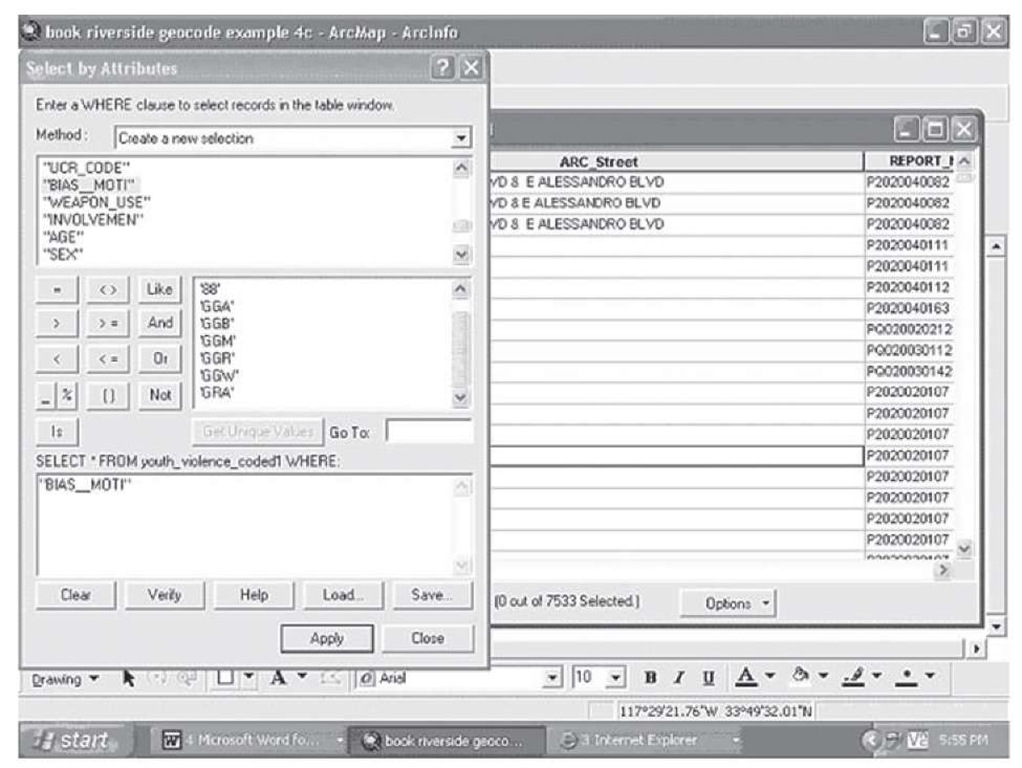
Step 4 Select the field you want to choose a subcategory from, and doubleclick it. The name of that field will appear in the box below the phrase, "SELECT *FROM youth_violence_coded1 WHERE:" (youth_violence_coded1 is the layer name of the attribute table you opened above).
Step 5 Click on the button Get Unique Values; this will display all of the values that are in the field you have selected to subset in the box above this button, as in Figure 2.19.
FIGURE 2.19 Building a selection formula
Step 6 Select an operator from those available in this submenu. In this case the values of the field are alphanumeric, that is letters and numbers are used as symbols for a category rather than using numbers mathematically (the latter are numeric fields), so that an equal sign is the appropriate operator; click on the equal sign above and it will appear in the Select *From box below.
Step 7 Now select the unique value you wish to subset your data on. Here we are interested in gang-related activity or GRA; select GRA, doubleclick, and it will appear to the right of the equal sign in the Select *From box below. You have now built a selection formula.
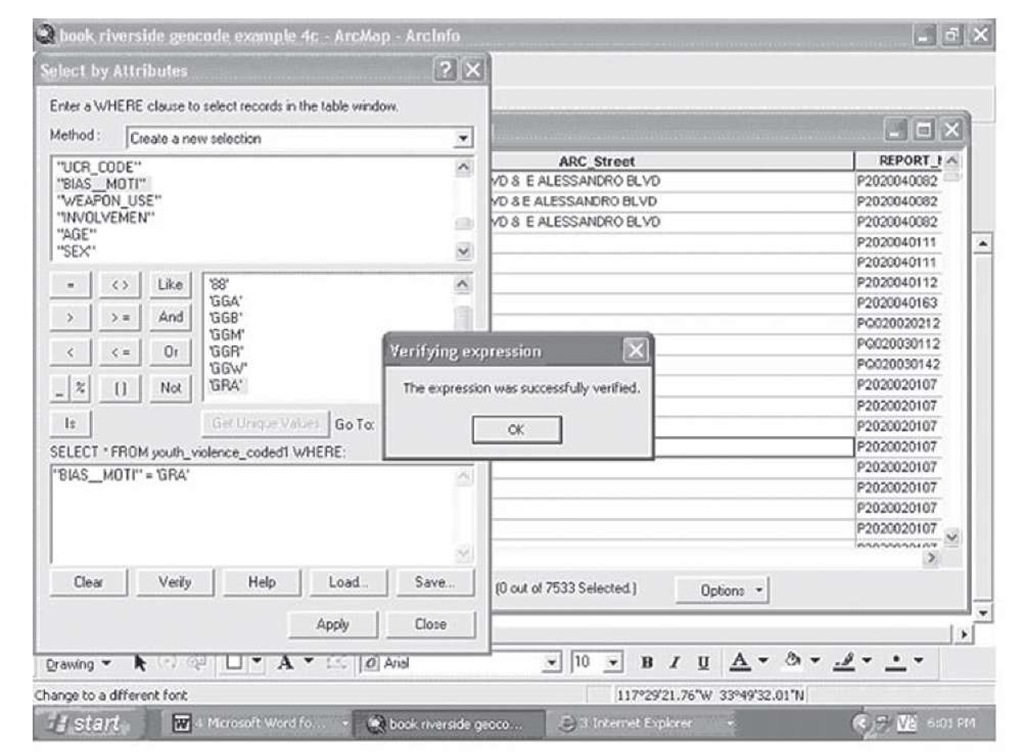
Step 8 Next you need to check if the formula is properly written according to the rules of logic that ArcMap uses. Click on Verify; if you have written the formula correctly, a box will appear telling you that the formula has been successfully verified, as in Figure 2.20.
Figure 2.20 Selection formula verification
If the formula is not successfully verified, ArcMap does not give you a reason; but if you try to apply such a formula, you will not successfully subset your data. Go back to the formula and look for logical errors, a missing parenthesis (every open parenthesis needs a closed parenthesis), misplaced operators, and so on. Keep revising the formula until it verifies successfully. Remember that successful verification, while a necessary condition for a successful subsetting of your data, is not sufficient. The logic of the formula could be correct, but it might still fail to select anything, or fail to select what you wanted it to. Make sure you check the selected data to make sure the selection has operated the way you intend by opening the attribute table of the newly selected data and examining it closely, comparing it to the attribute table you selected from.
Step 9 Click OK on the verification window, and click on the Apply button; close the attribute window and you will see the map with the selected events highlighted over the original map.
FIGURE 2.21 Results of selection on gang-related activities
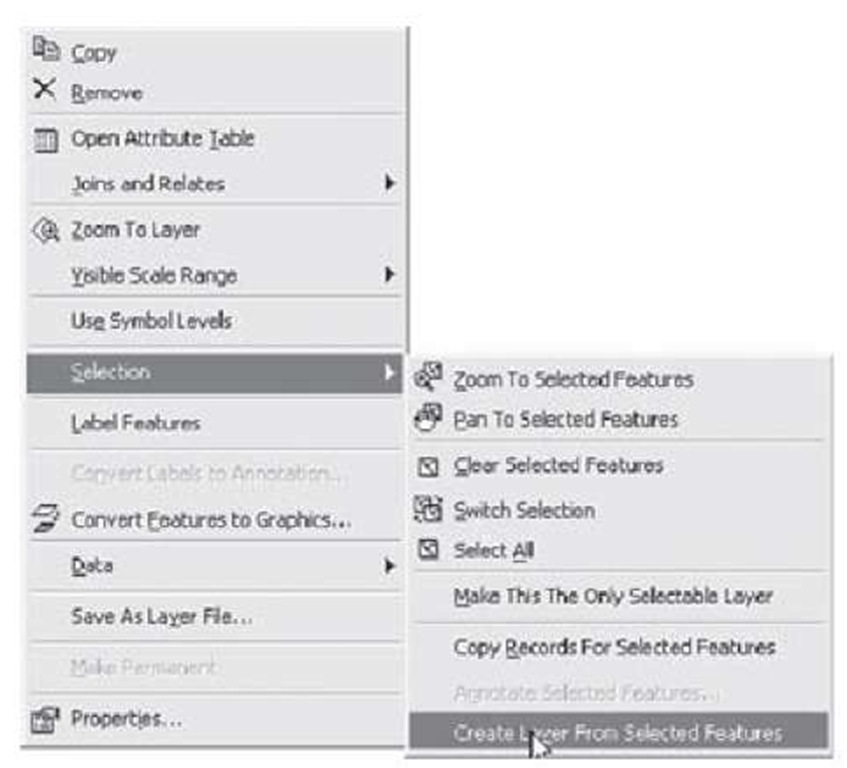
Step 10 To save the newly selected items into a new layer, left-click on the original layer, click on Selection and bring up the selection submenu, and click on Create Layer From Selected Features, as in Figure 2.22.
FIGURE 2.22 Selection and Create Layer From Selected Features submenus
The resulting new layer will appear in the table of contents window, and will have the same name as the original layer but with the word selected added to the end. Right-click twice on the name and give the new layer a more informative name, like Gang-Related Events, so as to keep track of the content of the new layer.
Step 11 Following the procedure in Section 1 for counting the number of events inside spatial units (see Figure 1.90 and related instructions), establish a count for gang-related activities in each block group, and create a thematic map; this map is shown in Figure 2.14.
As an exercise, create a thematic map of the Riverside block groups using the percent of the population that is Asian and Pacific Islander in origin. Add the gang-related selection layer you just created in the previous example. Create the same map with the percent of the population that is White, African American, and Latino. Do you see any possible relationship between ethnicity and gang activity?
Once you have learned to subset your data, you can see that the possibilities are nearly unlimited for gaining greater understanding of the geography of your data, and the ability to inform decision making about resource allocation, shifting priorities, and effective response to problems is significant from this effort.
