The principal activities of a portfolio (or fund) manager are portfolio structuring and adjustment on behalf of a client. The manager uses the client’s funds to purchase a portfolio of (generally) risky assets, based on the client’ s specified objectives and the fund manager’s assessment of asset risks and returns, with the aim of beating an agreed target or benchmark of performance. At the end of an agreed period (usually a year), the fund manager’s performance will be measured.
The Components of Portfolio Performance Measurement
The questions that are important for assessing how well a fund manager performs are how to measure the ex post returns on the portfolio, how to measure the risk-adjusted returns on the portfolio, and how to assess these risk-adjusted returns. To answer these questions, we need to examine returns, risks, and benchmarks of comparison.
Ex Post Returns
There are two ways in which ex post returns on the fund can be measured: time-weighted rates of return (or geometric mean), and money-weighted (or value-weighted) rates of return (or internal rate of return). The simplest method is the money-weighted rate of return, but the preferred method is the time-weighted rate o f return, since this method controls for cash inflows and outflows that are beyond the control of the fund manager. However, the time-weighted rate of return has the disadvantage of requiring that the fund be valued every time there is a cash flow.
Consider the following table on the value (V) of and cash flow (CF) from a fund over the course of a year:
Table 1 Fund Value and Cash Flow
| 0 | 6 months | 1 year | |
| value of fund | V0 | V! | V2 |
| Cash flow | CF |
Table 1 Fund Value and Cash Flow
The money-weighted rate of return is the solution to (assuming compound interest)
or to (assuming simple interest)
In the latter case, this implies that
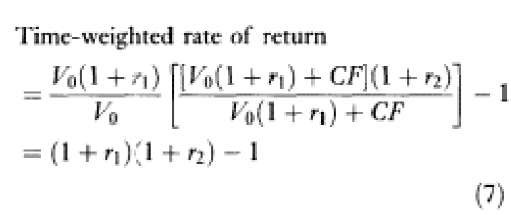
The time-weighted rate of return is defined as
If the semi-annual rate of return on the portfolio equals r for the first six months and r2 for the second six months, then we have
and
Substituting (5) and (6) into (4) gives
which is a chain-linking of returns between cash flows.
It is clear that the time-weighted rate of return reflects accurately the rate of return realized on the portfolio. This is because both cash inflows and outflows are beyond the control of the fund manager, and their effects should be excl uded from influencing the performance of the fund. This is the case for the time-weighted rate of return, but not the money-weighted rate of return.
Adjusting for Risk
The ex post return has to be adjusted for the fund’s exposure to risk. The appropriate measure of risk depends on whether the beneficiary of the fund’s investments has other well-diversified investments or whether this is his only set of investments. In the first case, the market risk (beta) of the fund is the best measure of risk. In the second case, the total risk or volatility (standard deviation) of the fund is best.
Benchmarks of Comparison
In order to assess how well a fund manager is performing, we need a benchmark of comparison. Once we have determined an appropriate benchmark, we can then compare whether the fund manager outperformed, matched, or underperformed the benchmark on a risk-adjusted basis.
The appropriate benchmark is one that is consistent with the preferences of the client and the fund’s tax status. For example, a different benchmark is appropriate if the fund is a gross fund (and does not pay income or capital gains tax, such as a pension fund) than if it is a net fund (and so does pay income or capital gains tax, such as the fund of a general insurance company). Similarly, the general market index will not be appropriate as a benchmark if the client has a preference for high-income securities and an aversion to shares in rival companies or, for moral reasons, the shares in tobacco companies, say. Yet again, a domestic stock index would not be an appropriate benchmark if half the securities were held abroad. There will therefore be different benchmarks for different funds and different fund managers. For example, consistent with the asset allocation decision, there will be a share benchmark for the share portfolio manager and a bond benchmark for the bond portfolio manager.
Measures of Portfolio Performance
There are two performance measures based on risk-adjusted excess returns, each distinguished by the risk measure used. The first is the excess return to volatility measure, also known as the Sharpe measure (Sharpe, 1966). This uses the total risk measure or standard deviation:
where rp is the average return on the portfolio (usually geometric mean) over an interval, ap is the standard deviation of the return on the portfolio, and rf is the average risk-free return (usually geometric mean) over the same interval.
The second performance measure is the excess return to beta measure, also known as the Treynor measure (Treynor, 1965). This uses the systematic risk measure or beta,
Figure 1 Excess return to beta
where fa is the beta of the portfolio.
The Sharpe measure is suitable for an individual with a portfolio that is not well diversified. The Treynor measure is suitable for an individual with a well-diversified portfolio.
The Treynor measure, for example, is shown in Figure 1: funds A and B beat the selected benchmark (BM) on a risk-adjusted basis, whereas funds C and D did not.
Performance Measures Based on Alpha Values
As an alternative to ranking portfolios according to their risk-adjusted returns in excess of the riskless rate, it is possible to rank them according to their alpha values. Again, two different performance measures are available depending on the risk measure used.
If the risk measure is total risk, the appropriate alpha value is defined with respect to the capital market line:
where ‘”is the expected return on the portfolio, ‘”is the expected return on the market, and <Jm is the standard deviation of the return on the market.
The corresponding alpha value is
If the risk measure is systematic risk, the relevant alpha value is defined with respect to the security ma1rket line:
The corresponding alpha value is
This is also known as the Jensen differential performance index (Jensen, 1969). Funds with superior investment performance will be those with large positive alpha values.
The Decomposition of Total Return
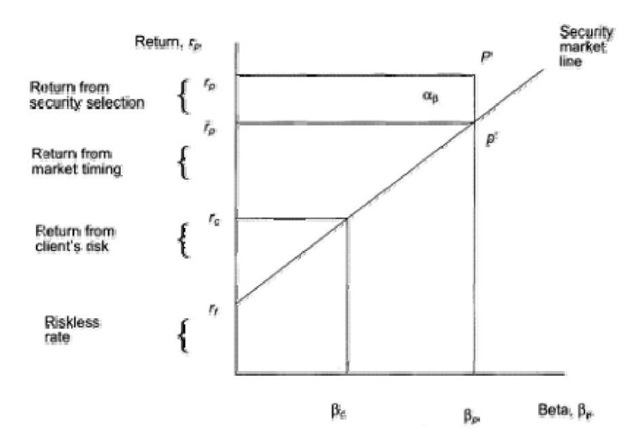
Having discussed various measures of the performance of a fund, the next task is to identify the sources of that performance. This involve s breaking down the total return into various components. One way of doing this is known a s the Fama decomposition of total return (after Fama, 1972): see Figure 2. Suppose that fund P generates a return rp and has a beta of ftp. The fund has performed well over the period being considered.
Figure 2 Fama decomposition of total return
The total return rp can be broken down into four components:
Return on the poitfoEiu — riskless rate + return from client1* risk + return from market [iming + reiurti from security selection (14)
The first component of the return on the portfolio is the riskless rate, r; all fund managers expect to earn the riskless rate. The second component of portfolio return is the return from the client’s risk. The fund manager will have assessed the client’s degree of risk tolerance to be consistent with a beta measure of ft, say. The client is therefore expecting a return on the portfolio of at least rc. The return from the client’s risk is therefore (rc – r)
The third component is the return from market timing. This is also known as the return from the fund manager’s risk. This is because the manager has chosen (or at least ended up with) a portfolio with a beta of ftp which differs from that expected by the client. Suppose the fund manager has implicitly taken a more bullish view of the market than the client by selecting a portfolio with a larger proportion invested in the market portfolio and a smaller proportion invested in the riskless asset than the client would have selected. In other words, the fund manager has engaged in market timing. With a portfolio beta of ftp, the expected return is rp, so that the return to market timing is P .
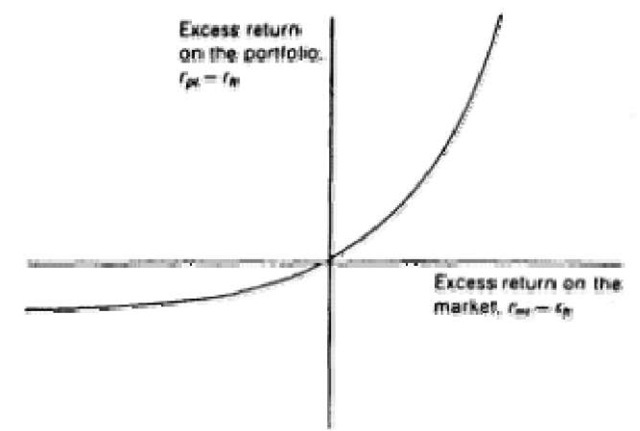
An alternative test for successful market timing is due to Treynor and Mazuy (1966). A successful market timer increases the beta of hi s portfolio prior to market rises and lowers the beta of his portfolio prior to market falls. Over time, a successful market timer will therefore have portfolio excess returns that plot along a curved line. To test this, a quadratic curve is fitted using historical data on excess returns on the portfolio and on the market:
where both b and c are positive for a successful market timer: see Figure 3.
Figure 3 Successful market timing
The fourth component is the return to selectivity (i.e. the return to security selection), which is equal to
The decomposition of total return can be used to identify the different skills involved in active fund management. For example, one fun d manager might be good at market timing but poor at stock selection. The evidence for this would be that his (r – rc) was positive but his was negative; he should therefore be recommended to invest in an index fund but be allowed to select his own combination of the index fund and the riskless asset. Another manager might be good at stock selection but poor at market timing; he should be allowed to choose his own securities, but someone else should choose the combination of the resulting portfolio of risky securities and the riskless asset.
The Evidence on Portfolio Performance
A number of studies have tried to measure the performance of fund managers; most of them have involved an examination of the performance of US institutional fund managers. They have examined the managers’ abilities in security selection, market timing, and persistence of performance over time.
Studies to determine the ability of fund managers to pick stocks calculate the Jensen alpha values of the funds. Shukla and Trzcinka (1992), using data from 1979 to 1989 on 257 mutual funds, found that the average ex post alpha value was negative (-0.74 percent per annum) and that only 115 funds (45 percent) had positiv e alphas. Similar results were found for US pension funds by Lakonishok et al. (1992). These results suggest that a typical fund manager has not been able to select shares that on average subsequently outperform the market.
However, these results have to be modified when shares are separated into two types: value shares (which have low market-to-topic ratios) and growth shares (which have high market-to-topic ratios). Fama and French (1992) found a strong negative relationship between performance and market-to-topic ratios. Firms with the 1/12th lowest ratios had higher average returns than firms with the 1/12th highest ratios (1.83 percent per month compared with 0.30 percent per month over the period 1963-90), suggesting that value strategies outperform growth strategies.
The market timing skills of fund managers have been examined in papers by Treynor and Mazuy (1966) and Shukla and Trzcinka (1992). Treynor and Mazuy examined 57 mutual funds between 1953 and 1962 and found that only one had any significant timing ability. The later study of 257 funds by Shukla and Trzcinka found that the average fund had negative timing ability, indicating that the average fund manager would have done better by executing the opposite set of trades.
Hendricks et al. (1993) examined 165 mutual funds between 1974 and 1988 for persistence of performance over time, i.e. whether good (or b ad) performance in one period was associated with good (or bad) performance in subsequent periods. They found that the 1/8th of funds with the best performance over a two-year period subsequently had an average 8.8 percent per annum superior return over the subsequent two-year period compared with the 1/8th of funds with the worst performance over the same two-year period. But this was the average superior performance, and the performance of individual funds can differ significantly from the average. This is shown clearly in a study by Bogle (1992), who examined the subsequent performance of the top twenty funds every year between 1982 and 1992. He found that the average position of the top twenty funds in the following year was only 284th out of 681, just above the median fund.
All these results indicate that fund managers (at least in the USA) are, on average, not especially successful at active portfolio management, either in the form of security selection or in market timing. However, there does appear to be some evidence of consistency of performance, at least over short periods. But as the saying goes: past performance is not necessarily a good indicator of future performance.


