Reliability Assessment
The reliability of an optical fiber is of paramount importance in communications applications—long links represent large investments and require high reliability. There will, of course, always be unforeseen reliability problems. Perhaps the most famous such example was the fiber cable design on the first transatlantic link—the designers had not quite appreciated the Atlantic shark’s need for a high-fiber diet. The sharks, apparently attracted by the scent of the cable materials, made short work of the initial cable installations. However, most of the stresses which an optical fiber will experience in the field can be replicated in the laboratory. A variety of accelerated aging models (usually relying on temperature as the accelerating factor) can be used to test for active and passive component reliability. In this section, we will review the reliability assessment of the fiber itself, referring interested readers to other sources for information on cable design.
Among the most important mechanical properties of the fiber in a wide range of applications is the tensile strength.25 The strength is primarily measured destructively, by finding the maximum load just prior to fracture.26 Full reliability information requires a knowledge of the maximum load, the relation between load and strain, a knowledge of the strain experienced by the fully packaged fiber, and some idea of how the maximum tolerable strain will change over long periods of time. One must finally determine the strain and associated failure probability for fibers with finite bends.
The tensile strength typically decreases slowly over time as the material exhibits fatigue, but in some cases can degrade rather rapidly after a long period of comparative strength. The former behavior is usually linked to fatigue associated with purely mechanical influences, while the latter often indicates chemical damage to the glass matrix.
FIGURE 12 Typical index profiles for (a), (b) gradient-index multimode fiber; (c) step-index single-mode fiber; (d) dispersion-shifted fiber.
The strain £ and tensile loading F are related through the fiber cross section and Young’s modulus:27
Ei and Ai represent the Young’s modulus and cross-sectional area of the ith layer of the fiber-jacketing combination. Thus, if the Young’s moduli are known, a measurement of the load yields the strain.
It is sometimes helpful to measure the fiber strain directly in cases where either the load or Young’s module are not known. For example, a fiber does not necessarily have a uniform load after jacketing, cabling, and pulling; the load would (in any case) be a difficult quantity to measure. Using the relation between the strain and the optical properties of the fiber it is possible to infer the fiber strain from optical measurements. These techniques have been successful enough to lead to the development of fiber strain gauges for use in mechanical systems.
FIGURE 13 Single-pass technique for time-domain measurement of fiber strain.
Optical measurements of strain make use of the transit time of light through a medium of refractive index Neff. (We will, for simplicity, assume single-mode propagation.) A change in length AL produced by a strain AL/L will yield a change in transit time
For most cases of interest, the effective index is simply taken to be the value for that of the core. The ratio At/AL can be calculated (it is about 3.83 ns/m for a germania-silica fiber with A = 1%) or calibrated by using a control fiber and a measured load. It is important to note that this measurement yields only information on the average strain of a given fiber length.
There are three categories of optoelectronic techniques for measuring At; these are very similar to the approaches for dispersion measurement. A single-pass optical approach generally employs a short-pulse laser source passing through the fiber, with the delay of the transmitted pulse deduced by a comparison with a reference (which presumably is jitter-free). This is shown in Fig. 13. Figure 14a shows a multipass optoelectronic scheme, in which an optoelectronic oscillator circuit is set up with the fiber as a delay loop. The Q of the optoelectronic oscillator determines the effective number of passes in this measurement of optical delay. Finally, one can use an all-optical circuit in which the test fiber is placed in a fiber loop with weak optical taps to a laser and detector/signal processor (Fig. 14b). This "ring resonator" arrangement can also be set up with a fiber amplifier in the resonator to form the all-optical analog of the multipass optoelectronic scheme of Fig. 14a.
If the strain is being used to gain information about fiber reliability, it is necessary to understand how strain, load, and fiber failure are related. Fatigue, the delayed failure of the fiber, appears to be the primary model for fiber failure. One experimental evaluation of this process is to measure the mean time to failure as a function of the load on the fiber with the temperature, the chemical environment, and a host of other factors serving as control parameters.
Since the actual time to failure represents only the average of a performance distribution, the reliability of manufactured fibers is sometimes specified in terms of the two-parameter Weibull distribution2527-30
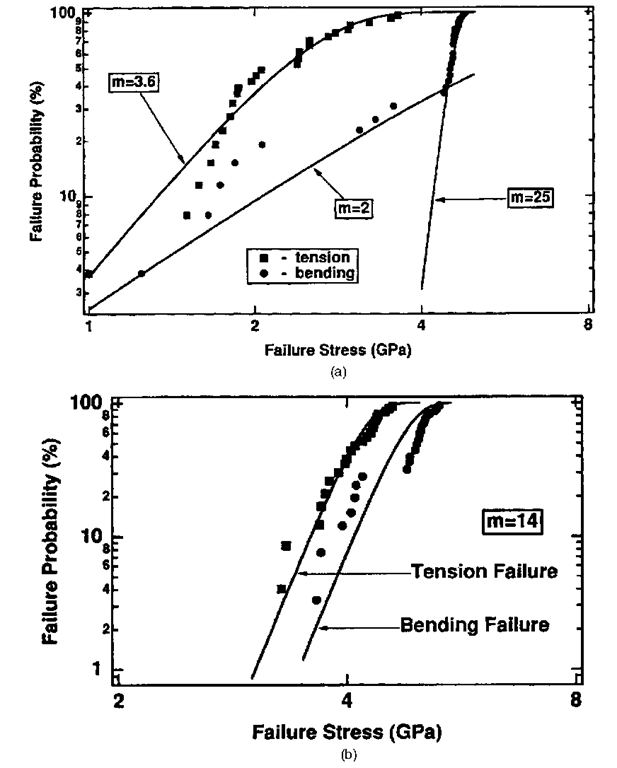
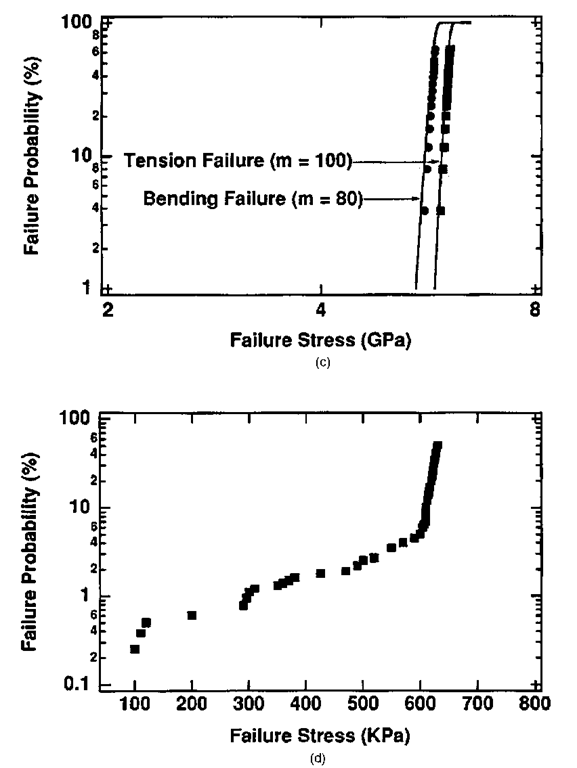
where Pf denotes the cumulative failure probability and the parameters are as defined in Table 2. The Weibull exponent m is one of the primary descriptors of long-term fiber reliability. Figure 15 shows a series of Weibull plots associated with both bending and tensile strength measurements for low, intermediate, and high values of m.
FIGURE 14 Multipass techniques for strain measurement. (a) Optoelectronic oscillator; (b) optical ring resonator.
One factor which has been shown to have a strong impact on reliability is the absolute humidity of the fiber environment and the ability of the protective coating to isolate the SiO2 from the effects of H2O. A recent review by Inniss, Brownlow, and Kurkjian31 pointed out the correlation between a sudden change in slope, or "knee," in the time-to-failure curve and the H2O content—a stark difference appeared between liquid and vapor environments. Before this knee, a combination of moisture and stress are required for fiber failure. In the case of fiber environments with a knee, a rather early mean time to failure will exist even for very low fiber stresses, indicating that chemistry rather than mechanical strain is responsible for the failure. The same authors investigated the effects of sodium solutions on the strength and aging of bare silica fibers.
OPTICAL FIBER COMMUNICATIONS
The optical fiber found its first large-scale application in telecommunications systems. Beginning with the first LED-based systems,32,34,35 the technology progressed rapidly to longer wavelengths and laser-based systems of repeater lengths over 30 km.36 The first applications were primarily digital, since source nonlinearities precluded multichannel analog applications.
TABLE 2 Variables Used in the Weibull Distribution
|
l |
Fiber length |
|
lo |
Length normalization factor |
|
S |
Failure stress |
|
So |
Location parameter |
|
m |
Weibull exponent |
FIGURE 15 A series of Weibull plots comparing bending and tensile strength for (a) low, (b) intermediate, and (c) high values of the Weibull exponent m; (d) shows a typical mean time to failure plot. Actual fibers will often exhibit slope discontinuities, indicating a change in the dominant failure mechanism.
Early links were designed for the 800- to 900-nm window of the optical fiber transmission spectrum, consistent with the emission wavelengths of the GaAs-AlGaAs materials system for semiconductor lasers and LEDs. The development of sources and detectors in the 1.3- to 1.55-^m wavelength range and the further improvement in optical fiber loss over those ranges has directed most applications to either the 1.3-^m window (for low dispersion) or the 1.55-^m window (for minimum loss).
FIGURE 15
The design of dispersion-shifted single-mode fiber along the availability of erbium-doped fiber amplifiers has solidified 1.55 |im as the wavelength of choice for high-speed communications.
The largest currently emerging application for optical fibers is in the local area network (LAN) environment for computer data communications, and the local subscriber loop for telephone, video, and data services for homes and small businesses. Both of these applications place a premium on reliability, connectivity, and economy. While existing systems still use point-to-point optical links as building blocks, there is a considerable range of networking components on the market which allow splitting, tapping, and multiplexing of optical components without the need for optical detection and retransmission.

![tmp8-71_thumb[2]_thumb tmp8-71_thumb[2]_thumb](http://what-when-how.com/wp-content/uploads/2011/09/tmp871_thumb2_thumb_thumb.png)

![tmp8-73_thumb[2]_thumb tmp8-73_thumb[2]_thumb](http://what-when-how.com/wp-content/uploads/2011/09/tmp873_thumb2_thumb_thumb.png)
![tmp8-74_thumb[2]_thumb tmp8-74_thumb[2]_thumb](http://what-when-how.com/wp-content/uploads/2011/09/tmp874_thumb2_thumb_thumb.png)


