Normalized Variables in Fiber Description
The propagation constant and dispersion of guided modes in optical fibers can be conveniently expressed in the form of normalized variables. Two common engineering problems are the determination of mode content and the computation of total dispersion. For example, commonly available single-mode fibers are designed for a wavelength range of 1.3 to 1.55 |im.
TABLE 1 Normalized Variables in the Mathematical Description of Optical Fibers
Shorter wavelengths will typically support two or more modes, resulting in significant inter-modal interference at the output. In order to guarantee single-mode performance, it is important to determine the single-mode cut-off wavelength for a given fiber. Normalized variables allow one to readily determine the cut-off wavelength and dispersion limits of a fiber using universal curves.
The normalized variables are listed in Table i along with the usual designations for fiber parameters. The definitions here apply to the limit of the "weakly-guiding" fiber of Gloge,7 for which A<<1. The cutoff for single-mode performance appears at a normalized frequency of V = 2.405. For values of V greater than this, the fiber is multimode. The practical range of frequencies for good single-mode fiber operation lie in the range.
An analytic approximation for the normalized propagation constant b which is valid for this range is given by
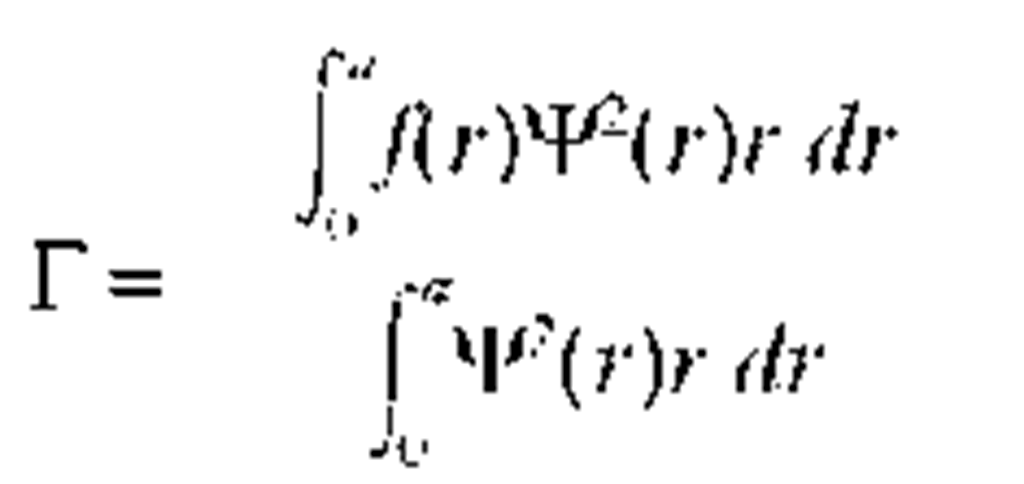
Operation close to the cutoff V = 2.405 risks introducing higher-order modes if the fiber parameters are not precisely targeted. A useful expression which applies to step-index fibers relates the core diameter and wavelength at the single-mode cutoff.5
Evaluation of Fiber Dispersion
Evaluation of the fiber dispersion requires:
1. Detailed material dispersion curves such as may be obtained from a Sellmeier formula.4 The Sellmeier constants for a range of silica-based materials used in fiber fabrication are contained in Chap. 33 of Vol. II, "Crystals and Glasses."
2. Complete information about the fiber profile, including compositional as well as refractive index information.
3. Numerical evaluation of the effective indices of the modes in question and their first and second derivatives. Several authors have noted the considerable numerical challenge involved in this,8,9 particularly since measurements of the refractive index/composition possess intrinsic uncertainties.
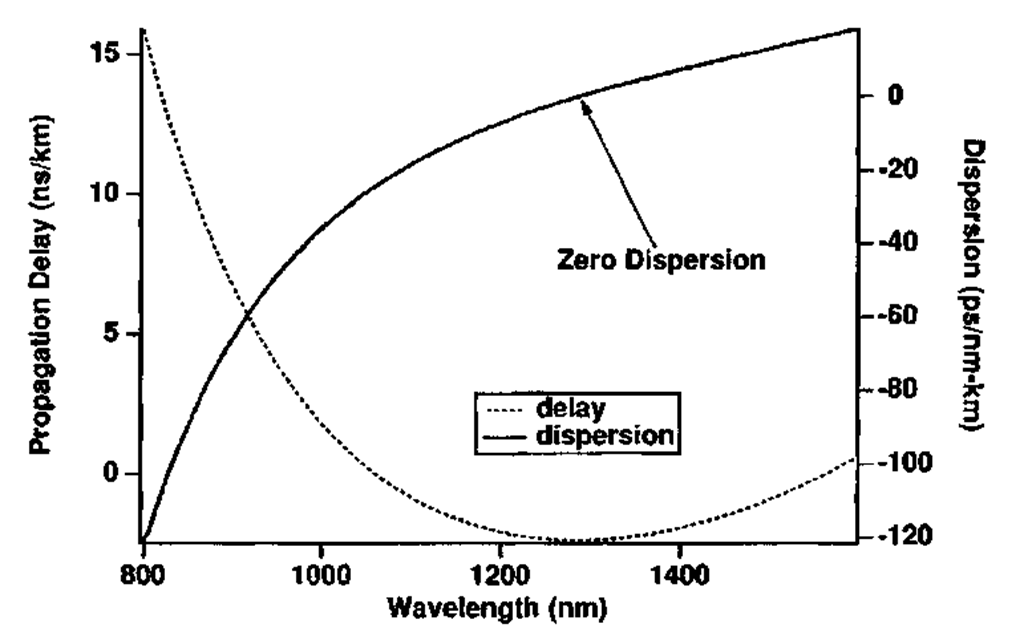
Figure 7 shows an example of the dispersion exhibited by a step-index single-mode fiber. Different components of the dispersion are shown in order to illustrate the point of zero dispersion near 1.3 |im. The section devoted to fiber properties will describe how profile control can shift the minimum dispersion point to the very low-loss window near 1.55 |im.
POLARIZATION CHARACTERISTICS OF FIBERS
The cylindrical symmetry of an optical fiber leads to a natural decoupling of the radial and tangential components of the electric field vector. These polarizations are, however, so nearly degenerate that a fiber of circular symmetry is generally described in terms of orthogonal linear polarizations. This near-degeneracy is easily broken by any stresses or imperfections which break the cylindrical symmetry of the fiber. Any such symmetry breaking (which may arise accidentally or be introduced intentionally in the fabrication process) will result in two orthogonally polarized modes with slightly different propagation constants. These two modes need not be linearly polarized; in general, they are two elliptical polarizations. Such polarization splitting is referred to as birefringence.
FIGURE 7 Dispersion of a typical single-mode fiber. The opposite contributions of the waveguide and material dispersion cancel near X = 1.3 |im.
The difference in effective index between the two polarizations results in a state of polarization (SOP) which evolves through various states of ellipticity and orientation. After some propagation distance, the two modes will differ in phase by a multiple of 2n, resulting in a state of polarization identical to that at the input. This characteristic length is called the beat length between the two polarizations and is a measure of the intrinsic birefringence in the fiber. The time delay between polarizations is sometimes termed polarization dispersion, because it can have an effect on optical communication links which is similar to intermodal dispersion.
If this delay is much less than the coherence time of the source, coherence is maintained and the light in the fiber remains fully polarized. For sources of wide spectral width, however, the delay between the two polarizations may exceed the source coherence time and yield light which emerges from the fiber in a partially polarized or unpolarized state. The orthogonal polarizations then have little or no statistical correlation. The state of polarization of the output can have an important impact on systems with polarizing elements. For links producing an unpolarized output, a 3-dB power loss is experienced when passing through a polarizing element at the output.
The intentional introduction of birefringence can be used to provide polarization stability. An elliptical or double-core geometry will introduce a large birefringence, decoupling a pair of (approximately) linearly polarized modes.1011 It also will tend to introduce loss discrimination between modes. This combination of birefringence and loss discrimination is the primary principle behind polarization-maintaining fiber. As will be discussed in the description of optical fiber systems, there is a class of transmission techniques which requires control over the polarization of the transmitted light, and therefore requires polarization-maintaining fiber.
OPTICAL AND MECHANICAL PROPERTIES OF FIBERS
This section contains brief descriptions of fiber measurement methods and general information on fiber attenuation, dispersion, strength, and reliability. It should be emphasized that nearly all optical and mechanical properties of fibers are functions of chemistry, fabrication process, and transverse structure. Fibers are now well into the commercial arena and specific links between fiber structure, chemistry, and optical and mechanical properties are considered highly proprietary by fiber manufacturers. On the other hand, most fiber measurements now have established standards. We therefore give attention to the generic properties of fibers and the relevant evaluation techniques.
Attenuation Measurement
There are two general methods for the measurement of fiber attenuation. Source-to-fiber coupling must be taken into account in any scheme to measure attenuation, and destructive evaluation accomplishes this rather simply. The cut-back method12-13 for attenuation measurement requires
1. Coupling light into a long length of fiber
2. Measuring the light output into a large area detector (so fiber-detector coupling remains constant)
3. Cutting the fiber back by a known distance and measuring the change in transmitted intensity
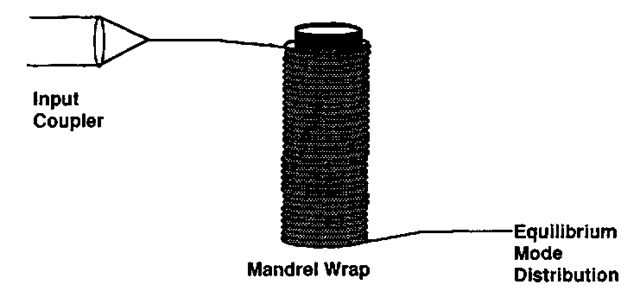
FIGURE 8 Mandrel wrap method of achieving an equilibrium mode distribution.
For single-mode fiber, the fiber can be cut back to a relatively short length provided that the cladding modes are effectively stripped. The concept of "mode stripping" is an important one for both attenuation and bandwidth measurements14 (since modes near or just beyond cutoff can propagate some distance but with very high attenuation). If these modes are included in the measurement, the result yields an anomalously high attenuation. Lossy modes can be effectively stripped by a mandrel wrap or a sufficiently long length of fiber well-matched to the test fiber (see Fig. 8).
For multimode fiber (whether step-index or gradient-index) the excitation conditions are particularly important. This is because the propagating modes of a multimode fiber exhibit widely varying losses. If the laser used for performing the measurement is focused to a tight spot at the center of the core, a group of low-order modes may be initially excited. This group of lower-order modes will have lower loss and the first 10 to 1000 meters will show an anomalously low attenuation. As the propagation distance increases, lower-order modes gradually scatter into higher-order modes and the mode volume "fills up." The high-order modes are substantially lossier, so the actual power flow at equilibrium is that from the lower-order modes to the higher-order and out of the fiber. This process is illustrated in Fig. 9. It is easy to see that if the excitation conditions are set so that all modes guide approximately the same power at the input, the loss in the first hundred meters would be much higher than the equilibrium loss.
With modern single-mode splices, connectors, and couplers, it is sometimes possible to make nondestructive attenuation measurements simply by assuring that the connector loss is much less than the total loss of the fiber length being measured. With this method, care must be taken that the connector design exhibits no interference between fiber endfaces.
Connector loss measurements must have similar control over launch conditions. In addition, it is important to place a sufficiently long length of fiber (or short mandrel wrap) after the connector to strip the lossy modes. A slightly misaligned connector will often exhibit an extremely low loss prior to mode stripping.
FIGURE 9 In a multimode fiber, low-order modes lose power to the high-order modes, and the high-order modes scatter into cladding and other lossy modes.
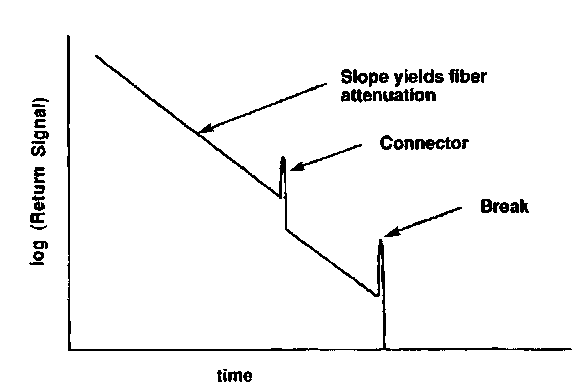
FIGURE 10 Typical OTDR signal. OTDR can be used for attenuation measurement, splice and connector evaluation, and fault location.
This is because power is coupled into modes which, while still guided, have high attenuation. It is important, in evaluation of fibers, to properly attribute this loss to the connector and not to the length of fiber which follows.
Another method of nondestructive evaluation of attenuation is optical time domain reflec-tometry (OTDR). The excitation of a fiber with a narrow laser pulse produces a continuous backscatter signal from the fiber. Assuming a linear and homogeneous scattering process, the reduction in backscattered light with time becomes a map of the round-trip attenuation versus distance. Sudden reductions in intensity typically indicate a splice loss, while a narrow peak will usually indicate a reflection. A typical OTDR signal is shown in Fig. 1o. OTDR is extremely sensitive to excitation conditions—a fiber which is not properly excited will often exhibit anomalous behavior. Control of the launch conditions is therefore important for all methods of attenuation measurement.
A major theme of research and development in optical telecommunications has been the elimination of troublesome reflections from optical networks. In particular, high-return loss connectors have been developed which exhibit 30 to 40 dB of reflection suppression.15-18 OTDR can be used to assess the reflection at network connections as well as perform on-line fault monitoring.
Dispersion and Bandwidth Measurement
The fiber has often been presented as the "multi-TeraHertz bandwidth transmission channel." While it is true that the total attenuation window of the fiber is extremely large by communications standards, the actual information bandwidth at any given wavelength is limited by the various sources of dispersion. The bandwidth of the fiber can be measured either in the time or frequency domain. Both measurements assume the fiber to be linear in its baseband (intensity) transfer characteristics. This assumption breaks down at very high powers and short pulses, but is nevertheless useful in most system applications.
The time domain measurement19 measures the temporal broadening of a narrow input pulse. The ratio of the Fourier transform of the output intensity to that of the input yields a baseband transfer function for the fiber. If the laser and detector are linear, this transfer function relates the drive current of the laser to the photocurrent of the receiver and treats the fiber simply as a linear transmission channel of limited bandwidth. The use of the Fourier transform readily allows the phase to be extracted from the baseband transfer function. For intermodal pulse broadening in multimode fibers, this phase can be a nonlinear function of frequency, indicating a distortion as well as a broadening of the optical pulse.
Swept-frequency methods20 have also been used for fiber evaluation. A pure sinusoidal modulation of the input laser is detected and compared in amplitude (and phase, if a network analyzer is available). In principle, this yields a transfer function similar to the pulse method. Both rely on the linearity of the laser for an accurate estimation, but since the swept-frequency method generally uses a single tone, the harmonics produced by laser nonlineari-ties can be rejected. Agreement between the two methods requires repeatable excitation conditions, a nontrivial requirement for multimode fibers.
The usual bandwidth specification of a multimode fiber is in the form of a 3-dB bandwidth (for a fixed length) or a length-bandwidth product. A single-mode fiber is typically specified simply in terms of the measured total dispersion. This dispersion can be measured either interferometrically, temporally, or using frequency domain techniques.
The interferometric measurement21,22 is appropriate for short fiber lengths, and allows a detailed, direct comparison of the optical phase shifts between a test fiber and a reference arm with a suitable delay. This approach is illustrated in Fig. 11, which makes use of a Mach-Zehnder interferometer. This requires a source which is tunable, and one with sufficient coherence to tolerate small path differences between the two arms. The advantage of the approach is the fact that it allows measurements of extremely small absolute delays (a shift of one optical wavelength represents less than 10 fs time delay). It tends to be limited to rather short lengths of fiber; if a fiber is used in the reference arm to balance the interferometer, the properties of that fiber must be known with some accuracy.
FIGURE 11 (a) Interferometric measurement of fiber dispersion; (b) time delay measurement of fiber dispersion.
Time-domain measurements23 over a broad spectral range can be made provided a multi-wavelength source is available with a sufficiently short optical pulse. One can make use of a series of pulsed diode lasers spaced at different wavelengths, use Raman scattering to generate many wavelengths from a single source, or make use of a tunable, mode-locked solid state laser. The relative delay between neighboring wavelengths yields the dispersion directly. This technique requires fibers long enough to adequately measure the delay, and the optical pulses must be weak enough not to incur additional phase shifts associated with fiber nonlinearities.
Frequency-domain or phase-shift measurements attempt to measure the effects of the dispersion on the baseband signal. A sinusoidally modulated signal will experience a phase shift with propagation delay; that phase shift can be readily measured electronically. This technique uses a filtered broadband source (such as an LED) or a CW, tunable, solid state source to measure the propagation delay as a function of wavelength.
Shifting and Flattening of Fiber Dispersion
A major dilemma facing system designers in the early 1980s was the choice between zero dispersion at 1.3 |im and the loss minimum at 1.55 |im. The loss minimum is an indelible consequence of the chemistry of silica fiber, as is the material dispersion. The waveguide dispersion can, however, be influenced by suitable profile designs.24 Figure 12 illustrates a generic design which has been successfully used to shift the dispersion minimum to 1.55 |im.
The addition of several core and cladding layers to the fiber design allows for more complicated dispersion compensation to be accomplished. Dispersion-flattened fiber is designed for very low dispersion in an entire wavelength range; the spectral region from 1.3 to 1.6 |im is the usual range of interest. This is important for broadband WDM applications, for which the fiber dispersion must be as uniform as possible over a wide spectral region.


![tmp8-63_thumb[2] tmp8-63_thumb[2]](http://what-when-how.com/wp-content/uploads/2011/09/tmp863_thumb2_thumb.png)
![tmp8-64_thumb[2] tmp8-64_thumb[2]](http://what-when-how.com/wp-content/uploads/2011/09/tmp864_thumb2_thumb.png)


