Abstract
A cohesive zone model (CZM) based approach is applied with 3D finite element method to simulate stable tearing crack growth events in Arcan specimens made of 2024-T3 aluminum alloy. The CZM parameter values are calibrated for a triangular cohesive law under Mode I condition. Simulation prediction of the load-crack extension curve compares reasonably well with experimental data. With the same set of CZM parameter values, simulations are performed for mixed Mode I/II stable tearing crack growth events as well. A good agreement is also reached between the simulation predictions and the experimental results. The CTOD variation with crack extension is also checked under both Mode I and mixed-mode I/II conditions. The results suggest that CZM based simulations can predict the critical CTOD value, which conventionally is used as an input in CTOD based stable tearing simulations and is obtained from experimental measurements. The findings of the current study establish a connection between CTOD and CZM based simulation approaches.
Keywords: Cohesive zone modeling; Finite element analysis; Crack growth; Mixed-mode fracture; Stable tearing 1. Introduction
The analysis of stable crack growth events plays an important role in assessing the structural integrity and residual strength of critical engineering structures such as aircraft frames. In practice, fracture criteria based on the concept of crack tip opening displacement/ angle (CTOD/CTOA) have been shown to be effective in stable crack growth simulations. Computational studies under Mode I (e.g. [1]) and mixed-mode (e.g. [2]) conditions have been performed to assess the viability of a CTOD/CTOA based fracture criterion for simulations of stable tearing crack growth. As an alternative approach, the cohesive zone model (CZM) [3-5] represents the behavior of the fracture process zone and describes the relationship between cohesive tractions and separations across the cohesive crack surfaces. The CZM approach has been used to simulate fracture processes in a wide range of material systems and at multi-length scales[6]. The current study aims at investigating the applicability of the CZM based approach in simulating mixed-mode stable tearing crack growth events in ductile materials. The CZM parameter values will be calibrated by trial & error based on certain physical considerations of Mode I stable tearing crack growth. Predictions of mixed-mode I/II tearing crack growth will be performed using the same CZM parameter values. The variation of CTOD with crack extension and the load-crack extension curve will be examined under both Mode I and mixed-mode I/II conditions and compared with experimental measurements. An effort will be made to establish a connection between the CZM approach and the CTOD approach.
Arcan fixture and specimen for stable tearing crack growth tests
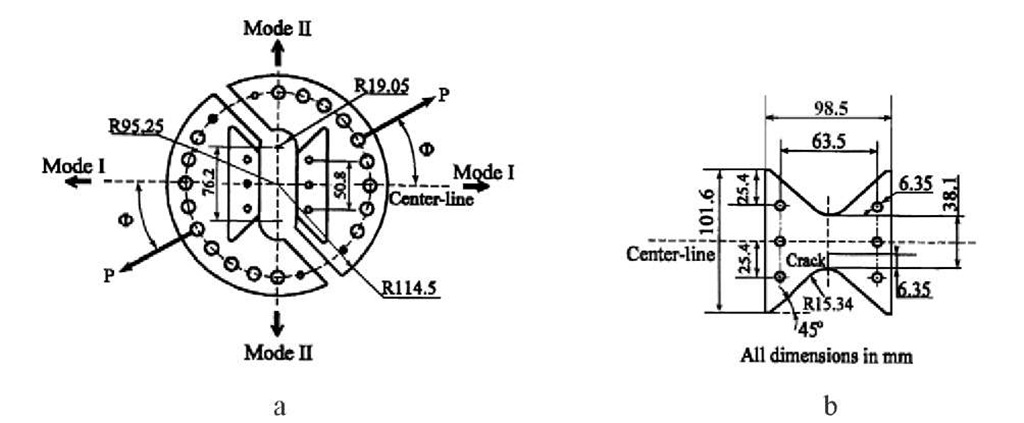
The Arcan fixture and specimen are designed to facilitate stable tearing crack growth tests under the mixed-mode loading conditions ranging from pure mode I to pure mode II [7]. The Arcan fixture, which is shown in Fig. 1a, is made of stainless steel and has a Young’s modulus of 207 GPa, a Poisson’s ratio of 0.3, and an initial yield stress of 1,724 MPa. The test specimen, as shown in Fig. 1b, is made of 2024-T3 aluminum alloy and has a Young’s modulus of 71.7 GPa, a Poisson’s ratio of 0.3, and an initial yield stress of 345 MPa. Both the steel and the aluminum alloy exhibit a strain-hardening behavior. A single-edge crack with a 6.35 mm length is introduced on one side at the mid-section of the specimen. The Arcan specimen is loaded by gradually pulling apart the grips of the fixture at a pair of grip holes on the opposite sides of a radial line. When the loading angle, is zero, the specimen is under Mode I condition, while ® equals to 90°, the specimen is under Mode II condition. Between the two angles, the mixed-mode loading conditions are obtained by changing the pair of loading holes.
Fig. 1 A schematic of: a. the Arcan test fixture and b. test specimen
Finite element modeling
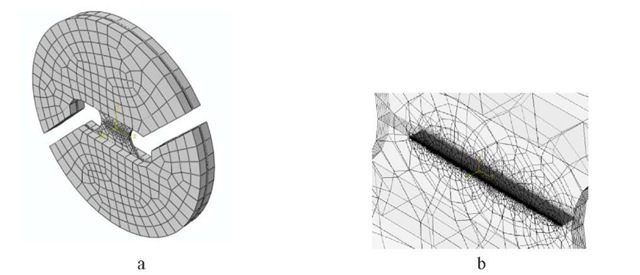
CZM simulations are carried out using the commercial software ABAQUS. The fixture and the specimen are meshed with 8-node hexahedral elements, C3D8R, while the cohesive zone is meshed with 8-node quadrilateral cohesive interface elements, COH3D8. A layer of cohesive elements is placed along the experimentally measured Mode I crack path, starting from the initial crack tip (at the left edge of the specimen) to the right edge of the specimen. At the right end of this layer, a few cohesive elements along the crack path are removed and node pairs above and below the crack path are tied together at the location of the removed elements. This will prevent the penetration between the top and bottom cohesive surfaces due to the overall bending of the specimen as the crack grows and becomes sufficiently long. Based on the result of convergence study, the mesh in the specimen region is divided into eight layers through the thickness and the cohesive elements have a uniform length 0.05mm. Fig. 2 shows the 3D mesh (Fig. 2a) and a zoomed-in view of the cohesive interface elements (Fig. 2b) for the Mode I case.
Fig. 2 a. 3D mesh of the Arcan fixture-specimen system for the Mode I case; b. a zoomed-in view of the mesh showing the cohesive interface elements
Calibration of triangular cohesive law parameter values
The triangular traction-separation cohesive law, as shown in fig. 3, was used in this study. The triangular cohesive law contains two critical parameters: the cohesive strength Tmax (the maximum traction the interface can endure) or the separation length 4ep, and the cohesive energy n which is the area of the triangle. As such, the two parameters Tmax and 4ep can be chosen as the two input parameters. It is a common practice to let the cohesive energy n equal the energy fracture toughness of the material.
Fig. 3 The triangular cohesive traction-separation law The cohesive parameter values for TL oriented aluminum alloy 2024-T3 will be selected by trial and error based on the values used in the literature[6,8,9], through matching simulating predictions of the Mode I load-crack extension curve with experimental data. From the fracture toughness KIC=35 MPam12 for AL2024-T3 thin sheet specimens, tf>c was set as 17 KJ/m2 for exponential cohesive law in [9]. Since the traction in the exponential CZM approaches 0 at infinite separation, the area under the cohesive curve ( the cohesive energy) is larger than that of the triangular CZM. Thus, the cohesive energy for the triangular CZM here is taken to be 95% of the value for the exponential CZM. The cohesive strength Tmax is chosen from the range of l.Ooy to 2.5oy, where oy is the initial yield stress of AL2024-T3.
Results and discussions
Load-crack extension curve
The load-crack extension curve is an important curve in structural integrity and residual strength analyses, describing the variation of the load carrying capability of a cracked specimen or structure with the amount of crack extension during stable tearing crack growth. In the simulations, the load corresponding to a certain amount of crack extension is computed by finding the reaction force at the fixed points.
After a range of trials for the Mode I case, a proper set of CZM parameter values is found as Tmax = 2.2oy=759MPa and 4ep=0.0426mm. A comparison of computer simulation results with experimental measurements is shown in fig. 4, the simulating results of traction-crack extension relation agree with the experimental data reasonably. The prediction of the load-crack extension curve has often been made using a fracture criterion based on the crack tip opening displacement (CTOD) [10]. In the case of the Mode I stable tearing crack growth in an Arcan specimen, good agreement between experimental data and simulation predictions based on the CTOD criterion have been demonstrated using both a 2D model [11] and a 3D model [2]. The simulation prediction[2] of the load-crack extension curve using CTOD approach is also compared in fig. 4. It is shown that the CZM and CTOD approaches lead to similar predictions, showing good agreement with the experimental data. 5.2 Variation of CTOD with crack extension
To understand if there exists any connection between CZM and CTOD based simulations, it is important to examine the CZM simulation prediction of the CTOD value at the same distance away behind the current crack as in the experimental measurement of CTOD.
Fig. 4 Comparison of simulation prediction of the Mode I load-crack extension curve using CZM (Tmax =759 MPa, 4ep=0.0426mm) with experimental measurements[7,12] and predicted results[2] using CTOD approach
Fig. 5 Comparison of CZM prediction for CTOD at 1mm behind the crack tip with experimental measurements[7,12]
In a CTOD based simulation, a critical CTOD value used as input to control the crack growth process. This critical CTOD value is determined based on experimental measurement at a fixed distance behind the crack front. If this value can be predicted using the CZM approach, then a connection between the CTOD and CZM approach is established. In the current study, since the distance of 1.0 mm was used in the experimental measurement of CTOD, this distance is also employed in the simulations when CTOD is computed. In Fig. 5, with the CZM approach, Mode I predictions of CTOD variation with crack extension are compared with the experimental measurements. The predictions lay in the range of the experimental data. Thus, it can be argued that there exists an equivalence or connection between the CZM and CTOD approaches and both types of simulations lead to good predictions of the load-crack extension curve.
Prediction of mixed Mode I/II of tearing crack using CZM
The simulations of mixed-mode I/II stable tearing crack growth events are performed using 3D finite element models based on the discussion of mode I models. The only difference is that the predefined crack paths are modified to those measured from experiments in the mixed-mode I/II conditions. With the same set of CZM parameter values obtained for the Mode I case, the load-crack extension curves and the CTOD variation with crack extension are predicted for two different mixed-mode conditions, corresponding to the 15° and 45° loading cases.
Fig. 6 Comparison of prediction of the load-crack extension curve using CZM with experimental measurements[7,12] and predicted results[2] using CTOD (15° loading)
Fig. 7 Comparison of prediction of the load-crack extension curve using CZM with experimental measurements[7,12] and predicted results[2] using CTOD (45° loading)
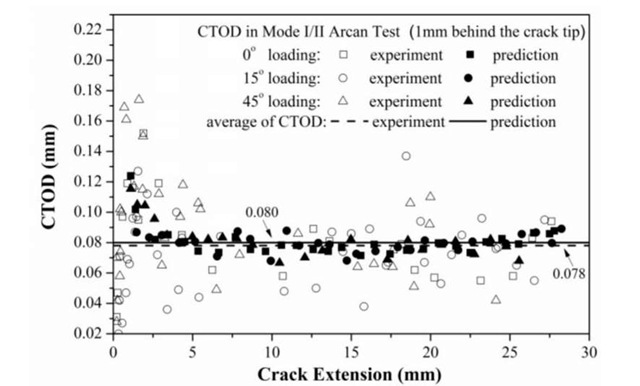
As shown in fig. 6 and fig. 7, the CZM approach can be successfully applied to evaluate stable tearing crack growth under mixed-mode I/II loading conditions. The predicted results of load-crack extension responses using both the CTOD and CZM approaches agree well with the experimental measurements. CTOD variations with crack extension at 1mm behind the crack front are obtained for two mixed-mode loading cases. The predicted results, including the ones for the Mode I case, are compared with the experimental measurements [7,12] in fig. 8. For all of the three loading conditions, the predicted results locate in the range of the corresponding experimental measurements. The average values are calculated for the predictions and the experimental data, respectively, and are plotted in fig. 8 as well.
Fig. 8 Comparison of predicted and measured CTOD variation with crack extension under Mode I and mixed-mode I/II conditions
Two average values reasonably match with each other. The experimental average is the critical CTOD value employed in the CTOD based simulations. The fact that the measured and CZM-predicted critical CTOD values match explains why both the CZM and CTOD based simulations lead to the same good predictions of the load-crack extension curve. Again this demonstrates a certain equivalence or connection between the CZM and CTOD based simulation approaches. 7. Conclusions
A cohesive zone model (CZM) based approach is applied to simulate mixed-mode stable tearing crack growth events in Arcan specimens made of 2024-T3 aluminum alloy. 3D finite element models are developed in Abaqus employing the triangular CZM law. From the current study, the CZM based approach can be successfully applied to simulate stable tearing crack growth events in ductile materials under both of Mode I and mixed-mode I/II loading conditions. A proper set of CZM parameter values is reached for Mode I case and is used for the mixed-mode cases. Both the CZM and CTOD based approaches lead to same simulation predictions of the load-crack extension curve that compare well with experimental measurements. The critical CTOD value used in CTOD based simulations, which is conventionally taken from experimental data, can be predicted using the CZM based approach, which establishes certain equivalence or connection between the CZM and CTOD based simulation approaches.


![The triangular cohesive traction-separation law The cohesive parameter values for TL oriented aluminum alloy 2024-T3 will be selected by trial and error based on the values used in the literature[6,8,9], through matching simulating predictions of the Mode I load-crack extension curve with experimental data. From the fracture toughness KIC=35 MPam12 for AL2024-T3 thin sheet specimens, tf>c was set as 17 KJ/m2 for exponential cohesive law in [9]. Since the traction in the exponential CZM approaches 0 at infinite separation, the area under the cohesive curve ( the cohesive energy) is larger than that of the triangular CZM. Thus, the cohesive energy for the triangular CZM here is taken to be 95% of the value for the exponential CZM. The cohesive strength Tmax is chosen from the range of l.Ooy to 2.5oy, where oy is the initial yield stress of AL2024-T3. The triangular cohesive traction-separation law The cohesive parameter values for TL oriented aluminum alloy 2024-T3 will be selected by trial and error based on the values used in the literature[6,8,9], through matching simulating predictions of the Mode I load-crack extension curve with experimental data. From the fracture toughness KIC=35 MPam12 for AL2024-T3 thin sheet specimens, tf>c was set as 17 KJ/m2 for exponential cohesive law in [9]. Since the traction in the exponential CZM approaches 0 at infinite separation, the area under the cohesive curve ( the cohesive energy) is larger than that of the triangular CZM. Thus, the cohesive energy for the triangular CZM here is taken to be 95% of the value for the exponential CZM. The cohesive strength Tmax is chosen from the range of l.Ooy to 2.5oy, where oy is the initial yield stress of AL2024-T3.](http://what-when-how.com/wp-content/uploads/2011/07/tmp1A0322_thumb_thumb.jpg)
![Comparison of simulation prediction of the Mode I load-crack extension curve using CZM (Tmax =759 MPa, 4ep=0.0426mm) with experimental measurements[7,12] and predicted results[2] using CTOD approach Comparison of simulation prediction of the Mode I load-crack extension curve using CZM (Tmax =759 MPa, 4ep=0.0426mm) with experimental measurements[7,12] and predicted results[2] using CTOD approach](http://what-when-how.com/wp-content/uploads/2011/07/tmp1A0323_thumb_thumb.jpg)
![Comparison of CZM prediction for CTOD at 1mm behind the crack tip with experimental measurements[7,12] Comparison of CZM prediction for CTOD at 1mm behind the crack tip with experimental measurements[7,12]](http://what-when-how.com/wp-content/uploads/2011/07/tmp1A0324_thumb_thumb.jpg)
![Comparison of prediction of the load-crack extension curve using CZM with experimental measurements[7,12] and predicted results[2] using CTOD (15° loading) Comparison of prediction of the load-crack extension curve using CZM with experimental measurements[7,12] and predicted results[2] using CTOD (15° loading)](http://what-when-how.com/wp-content/uploads/2011/07/tmp1A0325_thumb_thumb.jpg)
![Comparison of prediction of the load-crack extension curve using CZM with experimental measurements[7,12] and predicted results[2] using CTOD (45° loading) Comparison of prediction of the load-crack extension curve using CZM with experimental measurements[7,12] and predicted results[2] using CTOD (45° loading)](http://what-when-how.com/wp-content/uploads/2011/07/tmp1A0326_thumb_thumb.jpg)

