ABSTRACT
The elastic and plastic strain data of tubular specimens undergoing rupture under internal pressure tests are presented and analyzed. Six tubular specimens were tested. The specimens were cut from longitudinally welded tubes made of API 5L X80 steel with a nominal outside diameter of 457.2 mm (18 in) and a nominal wall thickness of 7.93 mm (0.312 in). Each of the six specimens had one external longitudinal or circumferential corrosion defect that had been machined using spark erosion. Tensile specimens and impact test specimens were tested to determine material properties. Post-yielding electrical resistance strain gages were used to measure the elastic and plastic strains. The failure pressures measured in the laboratory tests were compared with those predicted by four assessment methods: the B31G method, the RSTRENG 085dL method, the DNV RP-F101 method for single defects and by the Kastner equation. The paper also discusses the strength of the pipe segments used in the tests under the assumptions of following the Tresca and von Mises rupture criteria.
Introduction
General or localized corrosion represents a threat to pipeline strength because it produces a reduction in the pipe wall thickness. In order to evaluate the remaining strength of a corroded pipe segment it is necessary to know at least the following parameters: the outside diameter of the pipe De, the wall thickness of the pipe t, the yield strength of the pipe material ayietd or the ultimate tensile strength of the pipe material autt, the remaining wall thickness in the defect t* or the maximum defect depth d (d = t – t*), the defect length L and the defect width w.
Over the past decade over forty full scale burst tests have been conducted by PETROBRAS and the Pontifical Catholic University of Rio de Janeiro with the objective of investigating the failure behavior of pipelines containing corrosion defects. Several types of corrosion defects have been tested, namely: short and long longitudinal defects (respectively defects in which L is smaller or larger than![]() uniform depth defects, non uniform depth defects, simulated defects (machined using spark erosion), real defects (removed from service) and colonies of defects. Most of these tests have already been published and are referenced in Table 1 of reference [1] and also in [2-8].
uniform depth defects, non uniform depth defects, simulated defects (machined using spark erosion), real defects (removed from service) and colonies of defects. Most of these tests have already been published and are referenced in Table 1 of reference [1] and also in [2-8].
In this paper the burst tests of six tubular specimens loaded with internal pressure (presented in [1] and [9]) are analyzed in terms of strain distributions determined by strain gages located inside the corrosion patches and in terms of the adequacy of failure pressure predictions based on simple equations existing in the literature for corrosion geometries that are localized in a transition zone where they can be classified as short longitudinal defects or long circumferential defects.
The specimens were cut from a longitudinal welded tube made of API 5L X80 steel with a nominal outside diameter of 457.2 mm (18 in) and a nominal wall thickness of 7.93 mm (0.312 in). Each of the six specimens had one external short length uniform depth corrosion defect, machined using spark erosion. Measurements were carried out in order to determine the actual dimensions of each tubular specimen and its respective defect. Tensile specimens and impact test specimens were tested to determine material properties.
The failure pressures measured in the laboratory tests were compared with those predicted by four methods, three of them used in the assessment of longitudinal defects, namely: the B31G method [10], the RSTRENG 085dL method [11], the DNV RP-F101 method for single defects [12], and the fourth of them being based on the Kastner equation [13], which is used for the assessment of circumferential defects. Strain data collected with post-yielding strain gages that were bonded to surface locations inside the corrosion patches were analyzed to determine differences in the strain distributions caused by the proposed geometries of corroded defects.
Theoretical Background
Assuming that the pipeline is a thin shell (ratio of the pipeline’s outside diameter De to the pipeline’s wall thickness t is greater than twenty![]() the radial stress uR at any point of the pipe wall is negligibly small. Consequently there are only two stresses at any point of the pipe wall: the hoop or circumferential stress ah and the longitudinal stressor The hoop tensile stress ah and the longitudinal tensile stress aL are related to the internal pressure p by equations (1-2) for points of the thin pipe located in nominal regions, i.e., located far away from the defect patches and from the pipe caps.
the radial stress uR at any point of the pipe wall is negligibly small. Consequently there are only two stresses at any point of the pipe wall: the hoop or circumferential stress ah and the longitudinal stressor The hoop tensile stress ah and the longitudinal tensile stress aL are related to the internal pressure p by equations (1-2) for points of the thin pipe located in nominal regions, i.e., located far away from the defect patches and from the pipe caps.
where n = 0.5 or n = v = 0.3 respectively, are associated to longitudinally unrestrained pipe or to longitudinally restrained pipe, v being the Poisson coefficient.
In a pipeline subjected only to internal pressure, the nominal hoop stress ah and the nominal longitudinal stress aL are positive (tensile stress). Thus, the equations of the Tresca failure criterion are:
and the equation of the von Mises failure criterion is:
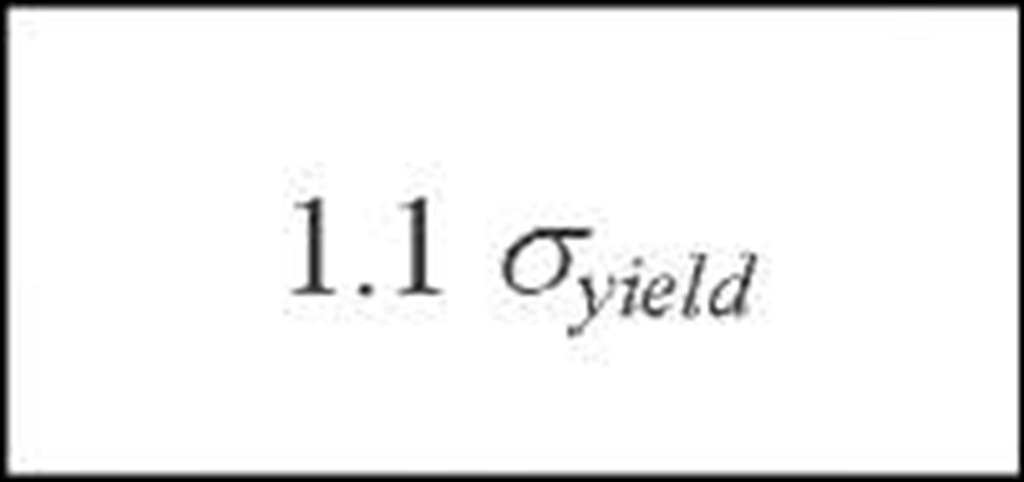
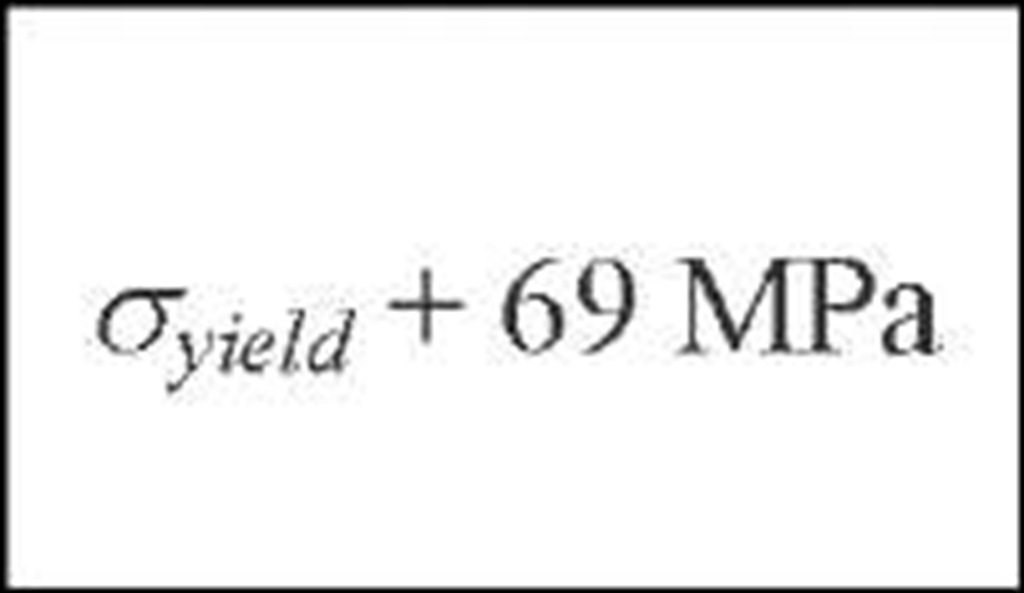
where aJ1ow is the material flow stress , and fR)h and (fR)L, respectively, are the reduction strength factors in the hoop and longitudinal directions caused by the corrosion defect’s geometry. The reduction factor in the hoop direction fR)h is given by equation (6). Table 1 presents the equations adopted by three selected methods to calculate flow stress ofow, pipe diameter D, geometric factor aarea and bulging factor M. Other variables in these equations are maximum depth of corrosion d and length and width of the corrosion patch, given respectively by L and w.
The reduction factor in longitudinal direction fR)L was derived by Kastner [13] and is given in equation (7). Angle P is the half angle width of the circumferential defect.
The burst pressure based on the hoop stress is given by equation (8). It is generally accepted that the best equation to represent the longitudinal stress in a corroded pipe at failure is the Kastner equation [13] given by equation (9).
Application of the Tresca and Mises criteria for a given specimen is accomplished bt using equations (10) and (11).
Table 1 – Parameters adopted by the three selected methods to predict the rupture caused by the hoop stresses
|
Method |
M |
|||||||
 |
 |
 |
2 / 3 |
 |
 |
 |
||
 |
 |
 |
1 |
 |
||||
 |
 |
 |
0.85 |
 |
 |
|||
 |
 |
 |
0.85 |
 |
||||
|
DNV RP-F101 (Part B) |
 |
 |
1 |
 |
 |
 |
||
Experimental Methods
Material Characterization
The raw material used in this research was composed of one longitudinally welded tube made of American Petroleum Institute API 5L X80 steel [14]. The length of this pipe was approximately 12m. The nominal outside diameter and the nominal wall thickness of the pipe were 457.2mm (18in) and 7.93mm (0.312in), respectively, with actual dimensions being 459mm and 8.1mm, respectively. This pipe was named Tube 3.
A summary of the tension test results for the transverse tensile specimens, cut from the Tube 3, is presented in Table 2. The yield strength measured as the stress required to produce a plastic deformation of 0.2% presented a mean value 13% greater than the specified minimum yield strength SMYS of API 5L X80 steel (SMYS = 551.6MPa). The mean ultimate strength was 19% greater than the specified minimum ultimate strength SMTS of API 5L X80 steel (SMTS = 620.6MPa).
The results of the Charpy V-notch impact tests at a temperature of 0oC for 2/3 thickness specimens cut from the Tube 3 are also presented in Table 2. This table also presents the impact energy equivalent for full thickness specimens. The mean value of the full thickness impact energy is equal to 80J, the minimum all-heat average full-size absorbed energy value required by product specification level 2 (PSL 2) of API Specification 5L for pipe size 18 and grade X80 [14].
Manufacture of the Tubular Specimens
Three tubular specimens 1.7 m long with circumferential defects and three tubular specimens 1.9 m long with longitudinal defects were manufactured. Each of the six specimens had one external uniform depth corrosion defect that had been machined using spark erosion. These defects were machined opposite the tube seam weld at a centralized position in relation to the ends of the specimens. The corrosion defects were smooth rectangular defects, i.e., the shape of the longitudinal area of metal loss was rectangular with smooth edges. These edges were made with a small radius equal to 4.4mm for the circumferential and longitudinal defects, except for specimen RDTS 1, which was 3.2mm. The tubular specimens were closed by specially designed plane heads with crossed reinforcements that were welded on after the defects were machined. The actual dimensions of each tubular specimen and its respective defect are presented in Table 3. Using the values of ratios![]() , one can see that all the corrosion defects are short according to the ASME B31G method [10] (defects in which
, one can see that all the corrosion defects are short according to the ASME B31G method [10] (defects in which![]()
Table 2 – Tension test and Charpy impact test results
Table 3 – Actual dimensions of the tubular specimens and of the machined defects
Pressure Tests
The tubular specimens were loaded with internal pressure only. The pressurizing system used an oil pump with a maximum capacity of 40MPa. The tubular specimens were filled with de-aired water and an extra pressure vessel located between the pump and the tubular specimens separated the oil and water pressure fluids. Pressure rates were kept to a maximum of 0.17MPa/min up to the beginning of yielding of the most-strained pipe wall in the defect region. From this point up to rupture, the pressure rate was decreased and followed the volume injection rate of water, which was kept to a maximum of 2×10⁻⁷m3/min. Pressure was monitored by two pressure transducers. The volume of the water injected into the tubular specimen was monitored by a specially constructed direct reading device.
Each tubular specimen was instrumented with high elongation strain gage rosettes (5mm gage length) that were bonded to the external pipe surface with an adhesive appropriate for high strains. The strain gage rosettes were bonded at pre-selected hot locations on the outside surface of the tubular specimen, mainly along and inside the corrosion defect.
Results and Discussion
The second column of Table 4 presents the failure pressures (pf)test measured during the burst tests of the six tubular specimens. Depending on the dimensions of a circumferential corrosion defect (d, L and w), its failure will be governed either by the hoop stress or by the longitudinal stress. For this reason a failure criterion based on the Tresca yield criterion was adopted to be compared with the experimentally determined burst pressures. The Mises criterion was also used for comparison purposes. In terms of failure pressures, both criteria are represented by Equations (10) and (11).
Each method used for longitudinal failure prediction, represented by equation (7) and information given in Table 1, was combined with the single version of Equation (8), resulting in a pair of equations for which two values of failure pressures were calculated: (pf)h and (pf)L. The lesser pressure (p/)mm is the Tresca’s pressure and was selected to be the predicted failure pressure. These selected predicted pressures are depicted in Table 4 by light grey shaded cells. The flow stress in the hoop direction was also adopted to calculate the flow stress in the longitudinal direction.
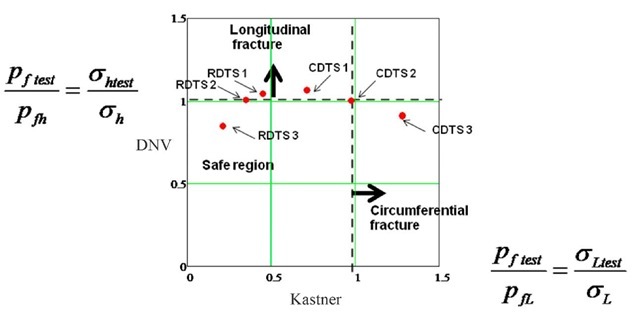
The DNV-Kastner pair of equations was verified to be the one with minimum deviation from the actual test pressures. Table 5 repeats the data of Table 4 in terms of the results obtained for the pair DNV-Kastner and included the Tresca and Mises predictions given by equations (10) and (11). Fig. 1 presents the results of Table 5 in the form of a plot showing that both criteria represent reasonably well the test pressures, the Tresca predictions being more conservative (5 out of 6 results).
Table 4 – Actual (test) and predicted (pair longitudinal – circumferential) failure pressures
Table 5 – Actual (test) and predicted (DNV-Kastner Pair) failure pressures
Fig. 2 presents a plot of points that correspond to the ratios of the actual failure pressure (pf)test to the failure pressure predicted by the DNV-Kastner pair of assessment results given in Tables 4 and 5. The Tresca criterion for the first quadrant (positive stresses) is also depicted in the figure. The data point falling in the right extreme of the plot is related to specimen CDTS 3 and it clearly predicts that fracture will occur along the longitudinal direction, i.e., it is determined by the longitudinal stress. Tables 4 and 5 and Fig. 1 show that the Tresca predicted failure pressures are conservative, i.e., the ratios are less than or equal to the unity, except for specimen RDTS 3. An observation about this result is made in the last paragraph of this section.
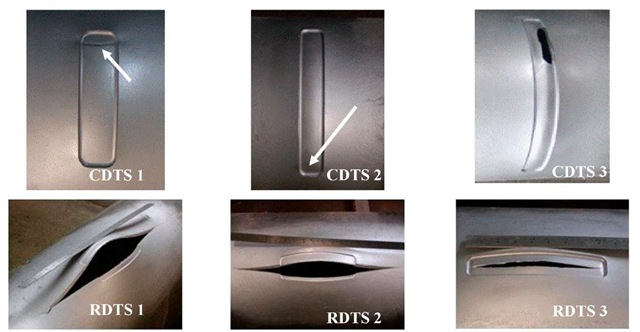
Fig. 3 presents photographs of the defects of specimens CDTS and RDTS after failure. The longitudinal orientation of the fracture suffered by the defects of specimens RDTS 1-3 and CDTS 1-2 suggests that these failures were governed by the hoop stress. On the other hand, the circumferential orientation of the fracture suffered by the defect of the specimen CDTS 3 suggests that its failure was governed by the longitudinal stress.
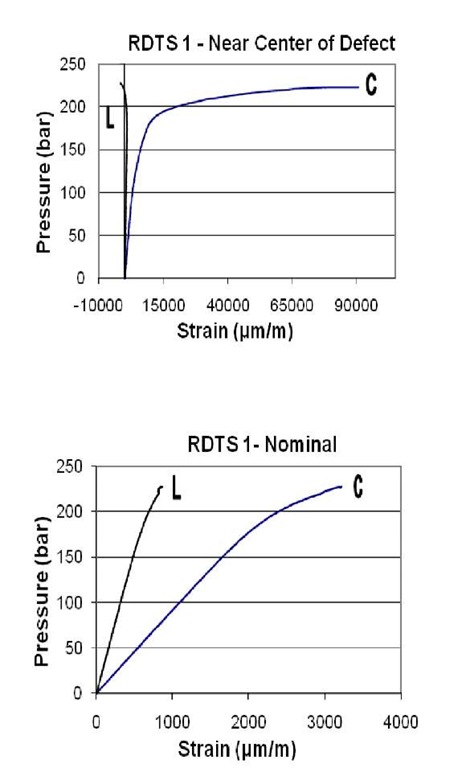
Strains along the longitudinal and circumferential directions measured by the strain gage rosettes for points located at or near the center of the corrosion patches are shown in Fig. 4 for specimens RDTS 1 and CDTS 3. The plots shown in the Fig. depict the circumferential and longitudinal strains varying with the internal pressure. It is possible to separate the strain distributions into two types of behaviors. One shows very large circumferential plastic strains and very small longitudinal strains and is connected to the defects characterized as longitudinal defects (specimens named RDTS 1 to 3 with large ratio![]() and small angle p). The reason for this behavior is the high hoop stress compared to the longitudinal stress.
and small angle p). The reason for this behavior is the high hoop stress compared to the longitudinal stress.
These stresses cause the fracture of the specimens and generate the fracture path along the longitudinal axis. The second type of behavior is presented by the specimens named CDTS 1 to 3, which present wide p angles and very small values for ratio![]() In this case the longitudinal and circumferential strains are of the same order. Specifically, the circumferential strain was much greater than the longitudinal strain for specimen CDTS 3.
In this case the longitudinal and circumferential strains are of the same order. Specifically, the circumferential strain was much greater than the longitudinal strain for specimen CDTS 3.
Fig. 1 Burst pressures calculated with Mises and Tresca criteria using the DNV-Kastner pair of equations compared with the actual burst test pressures
Fig.2 Normalized plot of fracture data points for the pair of DNV-Kastner equations
According to the results presented in Tables 4 and 5 and in Fig. 1, the DNV method applied to specimens RDTS 1 and RDTS 2 led to conservative predictions while non conservative predictions were met for the specimen RDTS 3. The good performance of specimens RDTS 1 and RDTS 2 is useful for ruling out two possible causes of the poor performance of RDTS 3: the generation of the artificial corrosion (the same process was used to machine the defect) and the material properties (specimens came from the same tube). Moreover, small error measurements in the order of 0.5mm in the remaining thickness can propagate errors as high as 20% in the predicted failure pressure for specimens such as the one named RDTS 3 due to its small thickness (about 2mm along the defect region). An investigation is underway to acquire own and selected published data to look for any extraneous behavior of specimens that present very thin remaining ligaments (less than 2.5mm in large diameter pipes) and that belong to corrosion regions with lengths greater than 50mm.
Fig. 3 Fracture path inside the defect patches for the circumferential defects (CDTS) and longitudinal defects (RDTS); arrows indicate fractures for specimens CDTS 1 and 2.
Fig. 4 Strain distribution of specimens RDTS 1 and CDTS 3 varying with internal pressure.
Conclusions
Test results confirmed that, depending on the dimensions of a corrosion defect (d, L and w), its failure will be governed by the hoop stress or by the longitudinal stress. The longitudinal orientation of the fracture suffered by the defects of specimens RDTS 1 to 3 and CDTS 1 and CDTS 2 suggests that their failures were governed by the hoop stress. The circumferential orientation of the fracture suffered by the defect of specimen CDTS 3 suggests that its failure was governed by the longitudinal stress. The Tresca criterion using the DNV RP-F101 and Kastner equations was shown to predict the fracture path correctly, i.e., whether it would follow a longitudinal or circumferential direction inside the corrosion patch. The strain distributions measured for points inside the corrosion patches also indicated the same trend: the much larger circumferential strains implied longitudinal fractures, and the much larger longitudinal strain implied a circumferential fracture.


