Residual stresses measurement in a gas pipeline
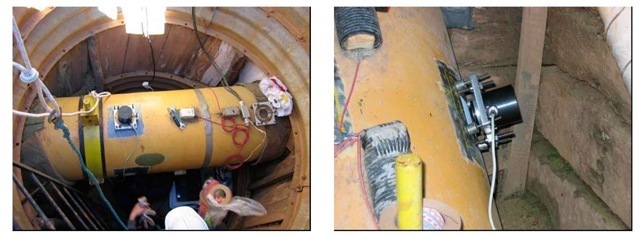
The optical residual stresses measurement system was used in a risky area of a gas pipeline located in a steep hill near to a small river. The soil moves constantly at that region. A contention structure was built in order to minimize soil movements and interactions between it and the pipeline. The measurements were used to estimate the amount of soil loading as a way to investigate the effectiveness of the contention structure. The quantity already measured by the hole drilling technique is the total amount of stresses acting on the material. This amount is a combination of real residual stresses coming from the pipe manufacturing process plus mechanical service stresses due to the internal pressure and soil/pipeline interaction. In order to estimate the effect of the soil/pipeline interaction, an additional measurement must be done in a reference section with known loading. Figure 4 shows the interferometer installed in a section of the gas pipeline.
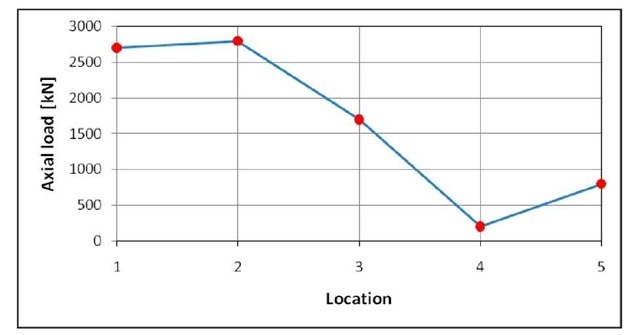
The measurements were made in five different cross sections, located in different places along a very sloppy area. For each section, the measurements were made in four points in order to have enough data to compute the axial loads as well as bending moments. Three reference sections were measured in a sample of the pipe, kept free from external loading. The amount of axial load and bending moments were computed for five different cross sections. The estimated amount of longitudinal loading for the five sections is shown in Figure 5.
Figure 4: Measurement of loading components in a gas pipeline using the radial in-plane interferometer and the hole drilling method.
Figure 5: Amount of longitudinal load estimated for five sections along the pipeline. The values are in kN. 4. Optical profilometer with conical triangulation
The first optical profilometer presented in this paper uses a radial light sheet and conical triangulation to measure the inner geometry of pipes in cylindrical coordinates.
Measurement principle
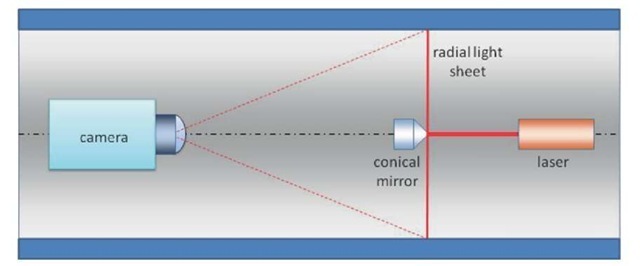
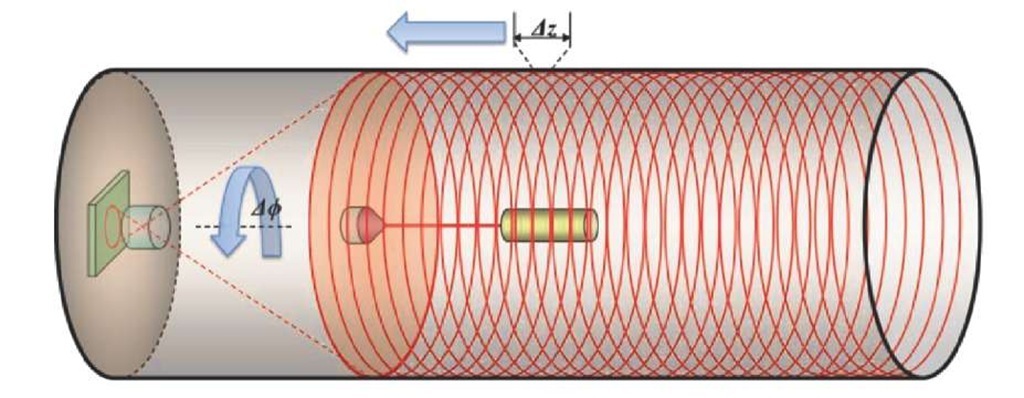
A collimated laser beam is directed to the nose of a 45° conical mirror to form a radial light sheet. The reflected laser light propagates radially all way around 360° and perpendicularly to the conical mirror axis, as shows Figure 6. The light sheet intercepts the inner surface of the pipe producing a light ring. If the inner geometry of the pipe is perfectly circular, and the alignment of the optical components is ideal, the light ring is seen as a perfect circle by a camera through a wide angle lens. As the inner geometry of the pipe departures from perfectly circular, the camera image of the light ring becomes distorted.
Figure 6 – Measurement principle of the optical profilometer.
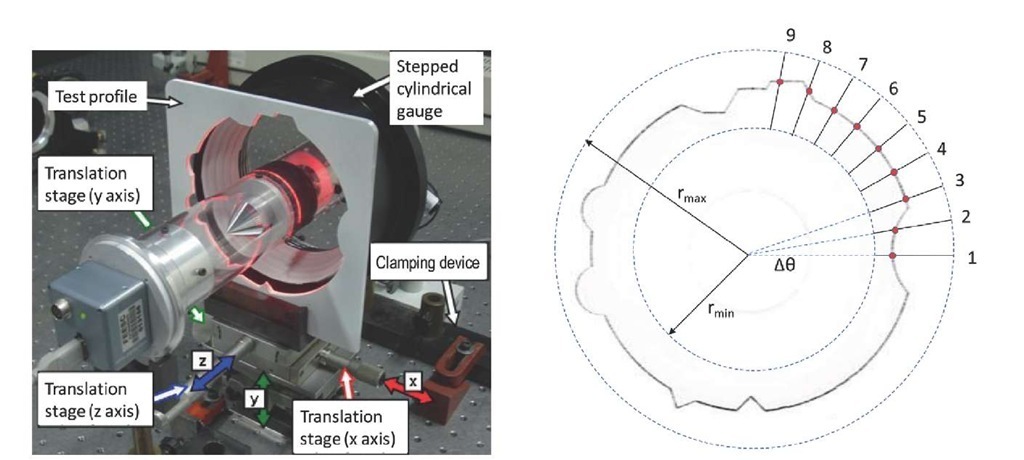
The theoretical relationship between the camera image of the light ring and the geometry of the actual light ring in the internal pipe surface can be determined by using a simple pinhole camera model. A calibration is done to correct the ideal relationship due to misalignments and lens aberrations. The left part of Figure 7 shows the profilometer in an optical bench measuring a test profile with known geometry. The laser ring image is processed in order to extract a regular array of points with the radius values as a function of the polar angle 6. Since the laser ring is much brighter than the rest of the image, it is easy to locate the radial position of the laser line for any given polar angle 6. The image is scanned along a virtual radial line. The laser line location is related to the intensity peak. The right part of Figure 7 shows the negative of the light ring image its sampling with a constant A6 increment. The actual increment is of 0.25°, what produces 1440 discrete points. The image processing is done in high speed and in a parallel way in a graphical board using NVIDIA’s parallel computing architecture (CUDA). Up to 50 images are acquired and processed every second.
Figure 7 – Left: the profilometer measuring the inner geometry of a test profile. Right: negative of the light ring image of the test profile and the sampling scheme.
To measure the inner geometry of the pipe, the whole device is continuously moved along the pipe axis. The laser ring image is acquired every time the device is moved by a predefined displacement step AZ, forming a regular mesh of measured sessions, as shows Figure 8. In the actual device typically one image is acquired for, for example, each 1.0 mm displacement step. After processing, a regular cloud of points in cylindrical coordinates of the inner geometry of the pipe is formed. The lateral resolution of the cloud achieved in these conditions is about 1.0 mm in both directions, resulting in about 1.4 millions of data point per meter.
Figure 8 – Inner surface measurement while the device is moved along the pipe axis.
Considering that undesired rotation toward the pipe axis can happens A in Figure 8), an inclinometer was added to the optical profilometer to detect the amount rotation, so it can be compensated by the mearurement software. This procedure is necessary to keep the sections of the cloud of points properly oriented.
Constructive aspects
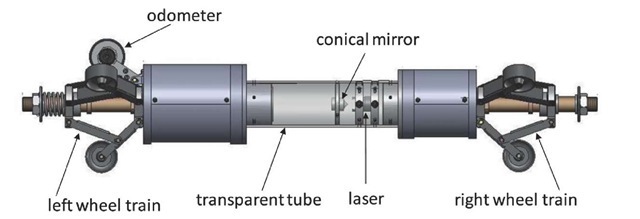
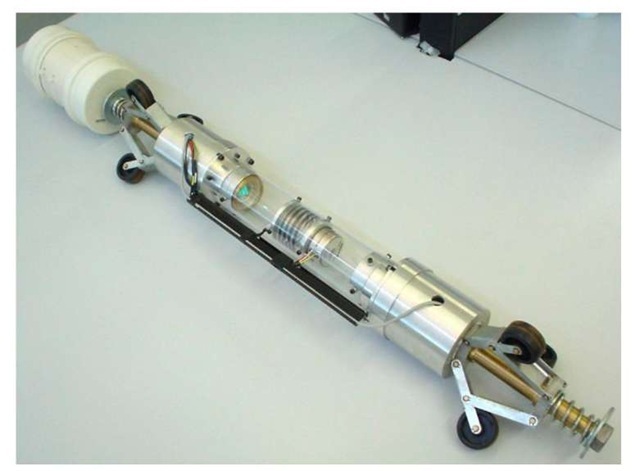
Figure 9 shows some constructive aspects of the developed optical profilometer. The laser and the conical mirror are fixed to a transparent tube by flanges. Both laser and conical mirror are carefully aligned to the axis of the transparent tube. The camera and imaging lens are inside of the housing in the left part of the transparent tube, as well as some electronics. Two sets of self-centering wheel trains are used to keep the profilometer approximately aligned to the axis of the measured pipe. The device has also a seventh wheel, which is connected to an odometer. The odometer is used to measure the profilometer position along the pipe axis as well to trigger the camera every time a given displacement increment (usually 1.0, 2.0, 5.0 or 10.0 mm) is achieved. That defines the lateral resolution along the pipe axis dimension. Since the triggering is defined by position increments, and not by time increments, the uniformity of the velocity of the profilometer is not a critical issue.
Figure 9 – Constructive aspects of the optical profilometer
Measurement results
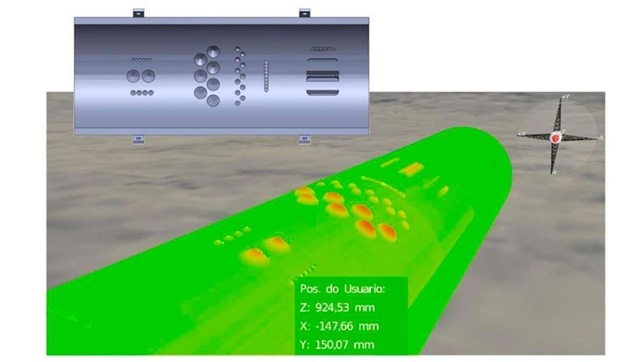
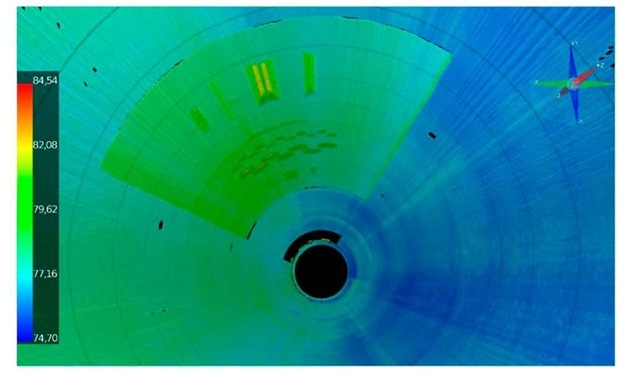
In order to evaluate the performance of the profilometer a test bench was built. It consists of a 2.5 long pipe where the profilometer is pulled by a flexible steel cable with controlled velocity. The pipe has three removable gutters that can accommodate surfaces with artificial and known artifacts. The profilometer was used to measure the inner geometry of the test bench in the region of a gutter with 36 artifacts. The system was adjusted to acquire one section each 1.0 mm, moving about 30 mm per second. The resulting cloud of points is shown in Figures 11 and 12. Although the measurement was made from the inside, Figure 10 shows an external view of the inner surface of the pipe to emphasize the geometry of the cavities. The artificial artifacts are also visible in the upper part of this figure. Figure 11 shows an internal view of the measured surface. Both uses color scales to quantify the measured values. The dimensions are indicated in millimeters. Note that all the 36 artifacts are clearly present in the clouds of points.
Figure 10 – Cloud of points from the test surface. External view.
Figure 11 – Cloud of points from the test surface. Internal view.
Up to this moment the profilometer has been tested in laboratory conditions. Its uncertainty with 95% confidence level was estimated to be better than 0.3 mm. The profilometer is currently been prepared to run inside a real oven pipe with diameter of 152 mm (6") and about 50 m long. The goal is to inspect the pipe to find corrosion cavities. The measurement time is expected to be around 25 min and the amount of measurement data in the order of 70 millions points.
Optical profilometer with active photogrammetry
The second optical profilometer was developed to inspect and measure inner surfaces of welded pipe joints. The main application is to verify the weld seam geometry and to check for misalignments between two adjacent welded sections. In this case, measurement time is not a limitation. However, a much higher lateral resolution is required. A completely different optical measurement principle is used.[10,11]
Measurement principle
Photogrammetry is an optical measurement technique where 3D information about physical objects is obtained combining data extracted from two or more images acquired from different viewing angles.[12-14] Since the camera position, orientation and lens parameters can be determined by calibration, the 3D coordinates of a given point is space can be computed since its location on the acquired images can be determined. The accurate and efficient determination of corresponding points in multiple images is the most challenging task in photogrammetry. It becomes particularly difficult if the scene has a monotonous texture. In those cases, a very good approach is the use of active photogrammetry[15,16].
In active photogrammetry a sequence of light structures is projected in the scene. It can be done with a completely random texture or with a sequence of regular fringes[15, 16]. The idea is to encode phase information into the projected fringe pattern and use phase information to efficiently and accurately locate corresponding points. Usually a sequence of 3 or 4 phase shifted images are projected and acquired as well additional images to obtain the absolute phase values.
Constructive aspects
A special configuration of active photogrammetry is used to build the profilometer[10, 11]. The main elements are visible in Figure 12. Cameras A and B are two identical cameras aligned with the symmetry axis of the device and facing each other. The camera positions and lens parameters are chosen in such way that both cameras can see the central surface of the inner cylinder, delimited by dashed lines in the figure. A specially designed helical fringe projector is installed in the central part and is able to appropriately illuminate the central area of the inner cylinder all way around 360°. It is formed by a lamp and another transparent tube where a set of sinusoidal helical lines are printed. A halogen lamp projects the shadows of the helical lines producing a set of 360° helical fringes on the central part of the inner surface of the cylinder to be measured. The surface of the transparent tube, where the helical fringes are printed, is rotated by a calibrated amount through a step motor, represented in the right part of the figure. Since the fringes are helical, they can be phase shifted when the step motor is rotated. An external transparent tube is used to keep all those elements fixed and aligned to each other.
Figure 12 – Basic configuration of the photogrammetric profilometer.
Also here, a self centering mechanical device with two sets of three wheels is used to keep the endoscope approximately aligned to the cylinder axis. Figure 13 shows some constructive aspects of the built prototype. It was optimized to measure welded joints of 6" pipes (152 mm).
Figure 13 – Actual view of the photogrammetric profilometer.
Application
The target application for the profilometer was inspection of inner surface of weld seams during a pipeline manufacturing process. The idea is to insert the profilometer just after welding a joint since one end of the pipe will be open. After positioning, a sequence of images is acquired for each camera. The data is combined and processed in order to obtain the absolute phase pattern for each camera.
A 13 m long testing tube was built from 152 mm (6") diameter pipes. A weld joint was prepared and inspected by the profilometer. The welded joint was intentionally prepared with welding defects. Two regions were welded with an unusual shallow welding seam and two regions with very deep welding seams. These defects will produce different welding seams geometries. Additionally, the welded pieces were intentionally misaligned producing a transverse translation of about 2 mm.
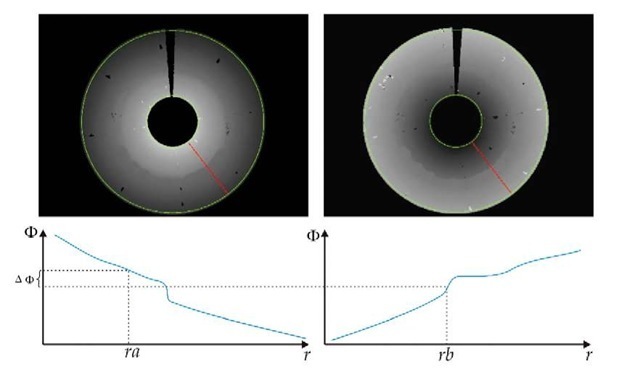
After phase unwrapping the images looks like the ones in Figure 14. The left phase image is for camera A and the right one is for camera B. Since each camera is in a different side, the image of one of the cameras was horizontally mirrored in such way that the left side becomes the right one and vice versa. Therefore, corresponding points are always located along radial lines with the same angular position. Note that the phase values decreases along a radial line coming from the center in the left image. In the right one the phase values increases. That is more clearly seen in the lower part of the figure. The "bumps" along the phase lines were produced by a welding seam located inside of a measured pipe.
Figure 14 – Finding corresponding points using unwrapped phase information.
The region of the welded joint was measured. The obtained cloud of points is shown in Figure 15. The left part represents the measured surface using a continuous false color scale related to radial values. The lighter/darker areas in the upper left part of the left figure make clear the presence of a transversal misalignment between the jointed parts that is in the order of 2 mm. The welding seam is visible all way around 360°. In some areas it is like a deep grove. In others, it is like a protuberance. The right part of the figure shows another color scale that emphasizes only regions with too deep or too shallow welding seams.
Figure 15 – Left: cloud of points acquired in the region of a welded joint represented in a false color scale. Right: the same cloud of points with a different color scale to emphasize regions with shallow or deep welding seam.
The measurement was repeated five times after removing and replacing the profilometer. The repeatability of the system for measuring both transverse misalignment and angular misalignment was very good. The sample standard deviation was below 0.04 mm for the transverse misalignment and 0.2° for the angular measurement, what is very good for the target application.
Conclusions
This paper presents three different optical measurement systems used for in-field measurements in pipelines. They were developed and optimized to meet specific demands. The radial in-plane DSPI interferometer has been commercially used along the last three years for gas or oil pipeline inspections in risky areas. The measurement uncertainty of this system is comparable to hole drilling technique with strain gauges. However, the measurement time is typically only 25% of the time required for strain gauge measurement. The profilometer with laser triangulation is in the final stage of development. Its measurement uncertainty is about 0.3 mm for the radius of any point. Its lateral resolution is of 1.0 mm in each direction. The maximum measurement speed range from 50 to 500 mm/s, depending on the lateral resolution selection. The profilometer will be used soon for inspection of 50 m long oven pipes, from where about 70 million points will be acquired. Finally, the photogrammetric perfilometer is used only in a static mode. The system is able to acquire a dense cloud of points with up to 0.05 lateral resolution, what is good enough for the target application. The standard deviations in misalignment measurement are about 0.04 for transverse misalignment measurement and 0.2° for angular misalignments.
