Results
Three different types of materials namely mild steel, aluminium and brass, all supplied as 6 mm rolled flat bar, were chosen to manufacture the required cantilever samples. For each material three cantilevers were machined. One of the cantilevers was machined down to 4mm thickness by removing 2 mm of material from one side only. This was done to remove any locked-in residual stresses due to the forming process from one face of the cantilever, whilst retaining the residual stress in the other face of the cantilever. The other two cantilevers were also machined down to 4 mm by equally removing 1mm thickness from each side. In addition 4mm thick tensile specimens, two of each supplied material, were machined.
The two evenly machined cantilevers and tensile specimen of each material were then annealed in order to reduce and remove any residual stresses within the samples. One of the two cantilever samples was left in its annealed state, whilst the other sample was exposed to plastic deformation, similar to shot peening, on one side. This was achieved by using many 2mm diameter ball bearings and pressing them onto the surface of the cantilever with a hydraulic press. This process was applied to the mild steel and aluminium samples. The remaining brass sample was exposed to a second annealing process.
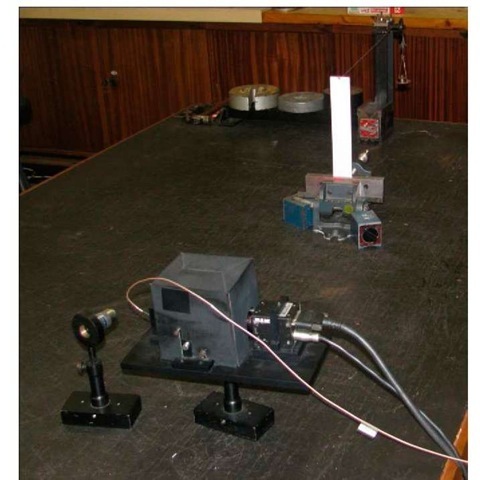
The cantilevers were then sequentially clamped vertically into a vice using two parallels with sharp edges to ensure uniform gripping between the vice grip faces. The force was applied normal to the rear face of the cantilever via a wire, which passed over a securely mounted pulley. Weights were used to produce the required bending force. The complete experimental configuration including the Digital Shearography setup is depicted in figure 3 and the final dimensions of the cantilevers and the applied forces are listed in table 1 below. As can be seen, the cantilevers were coated with a thin layer of matt white paint to improve visibility.
|
Material |
Length (mm) |
Breadth (mm) |
Thichness (mm) |
Applied Force (N) |
|
Mild Steel |
227 |
50 |
4 |
0.338 |
|
Aluminium |
227 |
50.7 |
4.05 |
0.289 |
|
Brass |
227 |
40 |
4 |
0.927 |
Table 1. Cantilever materials and dimensions
Figure 3. Cantilever and digital shearography setup.
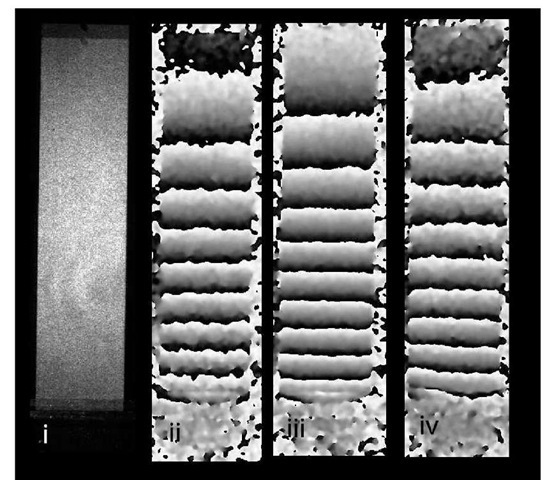
Figure 4 below is the collection of results obtained for the mild steel set of cantilever beams. The leftmost image is a shot of one of the cantilevers and was used to establish the magnitude of image shear which was established to be 6.5mm, as well as the magnification factor needed to correctly locate the fringe positions. The second image is the fringe pattern obtained for the annealed cantilever, the third the result for the residual stress sample and the final image the result obtained from the inspection of the peened cantilever.
Figure 4. Mild steel cantilever fringe pattern results, i) simple image of cantilever, ii) annealed sample result, iii) residual stress result, iv) peened sample result.
Figure 5. Displacement rates of the theoretical and sample mild steel cantilever results.
At first glance it appears that the fringe patterns are different between the individual results. Further investigation however reveals that the number of fringes produced with identical loading is roughly the same for all cantilevers, the difference between the individual results being that the location of the fringes have shifted marginally. This would indicate that the displacement curvature varies marginally from result to result, but there is no apparent significant influence of any residual stresses on the displacement rate of the prepared cantilevers.
The quantification of the displacement gradients and calculation of an appropriate Young’s modulus is presented in Figure 5 above. The theoretical to experimental data curve fitting exercise revealed that a Young’s modulus of 205 GPA produced a good fit to the annealed results. The Zwick/Roell tensile test on the two tensile specimens produced Young’s modulus results of 228 GPa and 200GPa resulting in an average of 214GPa. The literature lists a typical Young’s Modulus value of 200 GPa and thus the experimentally determined value of 205 GPa falls within the range.
Figure 5 also indicates that there is no appreciable difference between the different displacement gradients of the specimens and there is thus no clear evidence of any residual stresses having an influence on the cantilever displacement characteristics.
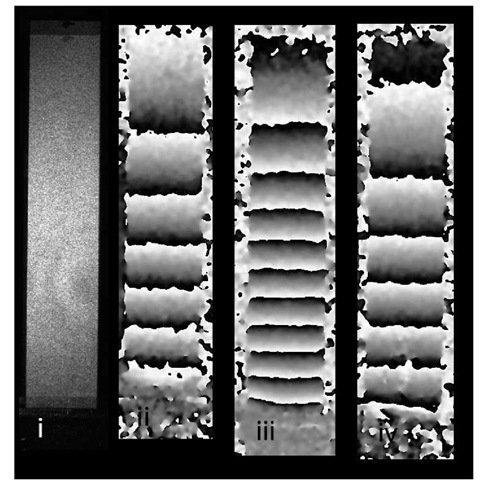
The results of the inspection of the aluminium specimen are shown in Figure 6 below. Here again there are 4 images, the first a shot of the cantilever specimen and the second, third and fourth the fringe pattern results of the annealed, residual stress and peened cantilevers respectively. From the results it can be seen that the fringe patterns are similar, but do differ in that the residual and peened cantilever beams display an extra fringe for the same applied load when compared with the annealed cantilever sample. The extra fringe indicates that these samples have a slightly higher displacement rate than the annealed sample.
Figure 6. Aluminium cantilever fringe pattern results. i) simple image of cantilever, ii) annealed sample result, iii) residual stress result, iv) peened sample result.
Figure 7. Displacement rates of the theoretical and sample aluminium cantilever results.
Using the annealed sample to determine the materials Young’s modulus a value of 72 GPa produced a good correlation between the experimental curve and the theoretical curve. This value is slightly higher than the value reported in the literature, which is in the order of 70 GPa. Unfortunately the Zwick / Roell tensile test did not produce any usable data, as the machine appeared to not be sensitive enough, and plastic deformation was initiated before a useful stress – strain curve in the elastic region could be established. Using the displacement rate curve of the treated aluminium cantilever a Young’s modulus of 70 GPa provided good theoretical correlation with the experimental data. The graph of the rate of displacement curve calculation is shown in figure 7 above.
Figure 8. Brass cantilever fringe pattern results. i) simple image of cantilever, ii) annealed sample result, iii) residual stress result, iv) heat treated result.
Figure 9. Displacement rates of the theoretical and sample brass cantilever results.
The results of the brass cantilever inspections are shown in figure 8 above. From the fringe patterns it is clear that there is a difference in the displacement gradients between the annealed sample and the residual stress sample. The strange aspect about this fringe patterns is that the residual stress cantilever has a greater displacement gradient and thus is less resistant to bending, which for a compressive residual stress should have had the opposite effect and resulted in a stiffer cantilever. The displacement gradient graph in figure 9 highlights this phenomenon.
The iterative process to determine the Young’s Modulus yielded a value of 114 GPa, as seen in the comparative displacement gradient curves of the shearography experimental data and data derived from theory. The Zwick / Roell test of the 2 tensile specimens yielded values of 80 GPa and 114.29 GPa. The 80 GPa value appears too low, the jaws possibly could have slipped, but the second test yielding a value of 114.29 ties up very well with the data obtained from the shearography results.
Conclusions
From the above data it is clear that a cantilever setup in conjunction with Digital Shearography can be used as an effective method to determine the Young’s modulus of materials. The results obtained agree well with results published in the literature as well as in house tensile tests.
The rate of displacement curves obtained for the annealed and locked in stress cantilever samples do not provide any clear evidence that the magnitude of residual stresses can be determined from the displacement curves. In particular there is no clear evidence of a decrease in the rate of the displacement curve for samples that were expected to contain compressive residual stresses, either due to the manufacturing process or peening process, which is in contrast to the results obtained and published in (3). A possible reason for this is that the samples used in the initial inspection were 15.5 mm thick, as opposed to the samples used in this investigation, which were 4 mm thick.
The results obtained from the annealed brass sample yield an acceptable Young’s modulus of 114 GPa. The exact Copper and Zinc composition of the stock supplied is however not known. The displacement rate results of the machined sample however cannot be explained.
Recommendations
From the above it is clear that formulating a procedure to determine the Young’s modulus using Digital Shearography is warranted. Care however needs to be taken to ensure that the prepared samples are annealed and stress free.
Further work needs to be conducted to understand why the results for the brass cantilever differ to such an extent. Investigations were undertaken to ensure that the samples are of the same thickness and that the parallels used to clamp the cantilevers were in fact flat parallels, but this did not reveal a possible cause of error.
Additional work is required to determine whether the induced residual stresses in the aluminium and mild steel samples were significant enough to influence the deflection profile, and to investigate the possible effect of the thickness of the sample on the rate of displacement profile.


