RESULTS
Bending moment stresses
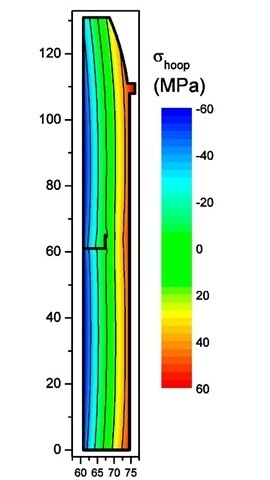
The bending moment stresses given by the analysis of Fig. 5 are shown in Fig. 8. The stresses varied nearly linearly from about -60 MPa on the inner surface to about 50 MPa on the outer surface.
Fig. 8. Bending moment stresses calculated from the amount the cylinder sprung open (see Fig. 3) after the first cut.
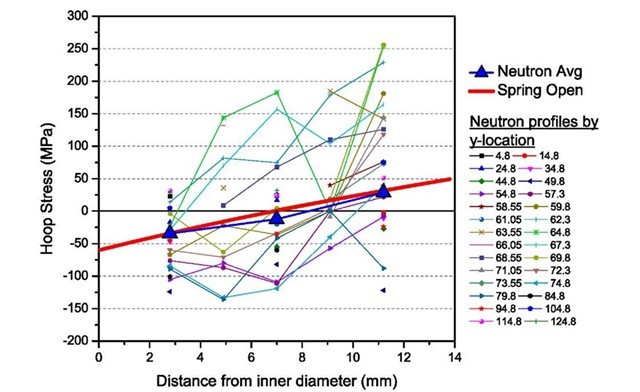
In order to validate the bending moment stresses measured by the first cut, the results are compared with the neutron diffraction measurements [45]. The neutron diffraction measurements were taken before the cylinder was cut and, therefore, give the total stresses. Fig. 9 shows the comparison, with stresses plotted through the thickness of the cylinder. The neutron results are plotted for all of the measurement points, taken at multiple axial positions along the cylinder. The bending moment stresses measured by the first cut agree well with the linear trend in the neutron stresses, as they should. Since the non-bending stresses must satisfy equilibrium, an average of the total stress over the axial length of the cylinder should give only the bending stresses. In order to compare, such an average of the neutron stresses was calculated. Because the neutron sampling volumes were not equally spaced, the averaged was weighted in order to approximate a true spatial average. Also, the average was only taken at the three radial locations where the neutron measurements spanned the full length of the cylinder (the same data is potted later in Fig. 11, Fig. 12, and Fig. 13). The average of the neutron stresses is plotted in Fig. 9 and agrees quite well with the bending stresses measured by the first cut.
Fig. 9. Bending moment hoop stresses calculated from the "spring open" measured in the first cut compared with neutron diffraction measurements of total stress. The bending stresses agree well with the trend in the neutron data and with the average neutron stress.
Total stresses
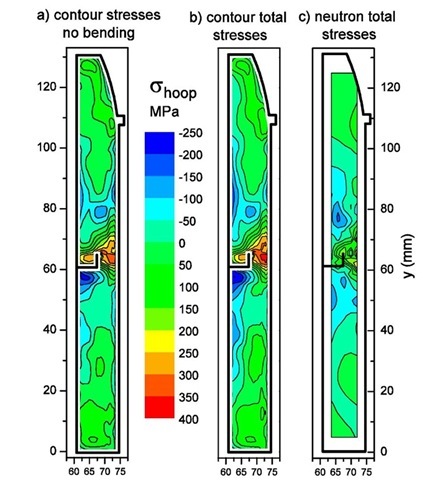
Fig. 10 shows the hoop stresses measured in the welded cylinder. Fig. 10a shows the stresses calculated by the contour method analysis of Fig. 7. Fig. 10b shows the total stresses measured by the contour method, from adding the bending moment stresses of Fig. 8 to the stresses in Fig. 10a. Since the peak bending stresses are only about 15% of the peak total stress magnitudes, the correction is relatively minor. Fig. 10c shows the hoop stresses measured by neutron diffraction. The stress distribution is qualitatively similar, but the neutron-measured stresses are much lower in magnitude.
Fig. 10. Measured hoop stresses.
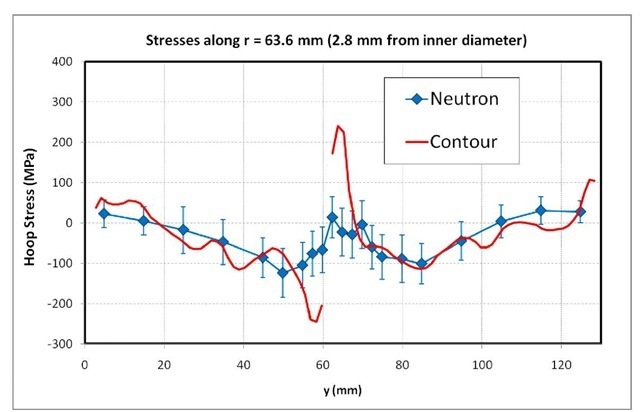
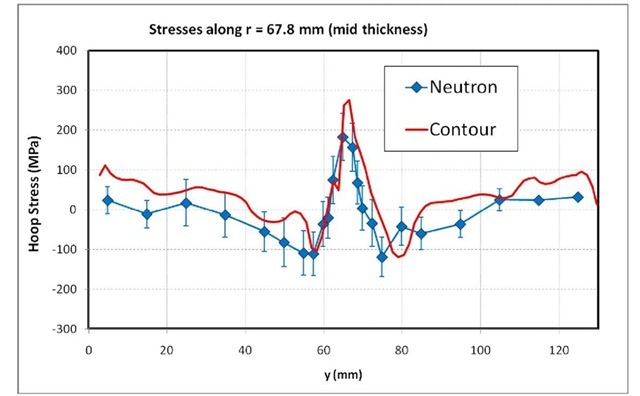
To further illustrate the issues, the results (Fig. 10 b and c) are compared along three neutron scan lines located at different locations through the thickness of the cylinder wall. Fig. 11 shows the comparison along the scan line near the cylinder inner diameter, which is the only scan line to cross the unfused portion of the joint. The contour and neutron results agree quite well away from the joint but not near the joint. Fig. 12 shows the comparison near the mid-thickness of the cylinder wall. Outside the weld region, results generally agree, with stresses differing nearly by a constant offset of ~40 MPa. One possible source for such an error can be the unstressed lattice spacing, also known as d0, used in calculating strains and then stresses from the neutron diffraction measurements [41,42]. The weld stresses differ by more like 100 MPa. Fig. 13 shows the comparison along the scan line near the cylinder outer diameter. A shift of ~40 MPa would bring the comparison in better agreement away from the weld, but the contour stresses are again about 100 MPa higher in the high tensile stress region of the weld. For reference, note that the contour method FE stress calculation automatically enforces the constraint that the stresses satisfy force equilibrium. Because the neutron measurements do not cover the entire cross section, it is difficult to make conclusions about equilibrium.
Fig. 11. Stresses along neutron scan line located about 2.8 mm from the cylinder inner diameter. This path crosses he unwelded joint at y=61
Fig. 12. Stresses along neutron scan line centered about mid-thickness in the cylinder.
Fig. 13. Stresses along neutron scan line located about 1.6 mm from the cylinder outer diameter.
DISCUSSION
The contour method stresses are in reasonable agreement with the neutron results away from the weld region. The minor trend in the disagreement of the neutron stresses being lower by about 40 MPa might be explained by errors in the unstressed lattice spacing in the neutron measurements.
The contour method stresses are significantly higher than the neutron stresses in the tensile region of the weld. As will be discussed in the following paragraphs, there are many possible explanations for the difference. Some explanations are that the comparison does not fairly compare stresses at the same location. Other explanations include possible errors in both the neutron and contour measurements.
The neutron and contour measurements were not made over spatially identical regions. The neutron sampling volumes were 2x2x2 mm cubes. Because of issues with large grains, the neutron measurements were averaged around the circumference of the cylinder by rotating the cylinder during the measurements, effectively sweeping the sampling volume around the entire cylinder. There are two issues with the circumferential averaging. First, tolerances for both the part itself and the alignment and rotation during neutron measurements would make it likely that sharp discontinuities and gradients, such as in Fig. 11, would be smeared out in the neutron results. Second, the circumferential averaging would average in any changes near the start and stop of the weld, which can have significantly different stresses [22]. The contour results, by contrast, are taken only at the circumferential location of the cut. Unfortunately, the start-stop location of the weld was not known, so it is possible although unlikely that the contour results reflect localized stresses near the start or stop.
The results were challenging for neutron diffraction, which may have resulted in some errors. The uranium alloy has an orthorhombic crystal structure and had large grains, both of which made the neutron measurements more challenging and more prone to errors [45].
The two most common systematic errors associated with the contour method, plasticity and changing cut width, are unlikely to explain the difference in stress magnitudes measured by the two techniques. In tensile testing, the uranium showed yield strengths of about 200-250 MPa with strain hardening to over 400 MPa. The peak hoop stress in the cylinder exceeds the initial yield strength. (Because of the multi-axial nature of the stress and the strain hardening of the material, individual residual stress components exceeding nominal yield strength have been observed routinely in tensile stress regions near welds [49].) Because of the large measured stress magnitudes, plasticity at the tip of the cut could have caused errors. Plasticity effects are difficult to predict because they depend on prior history, strain hardening and cyclic plasticity. Nonetheless, simulations of plasticity effects for the contour method indicate possible errors in the position and shape of the stress profile, but not significant increases in peak stress magnitudes [50,51].
The contour method also assumes that the cut removes a constant width of material relative to the undeformed part. Because material ahead of the cut deforms as stresses are released, the cut width relative to the undeformed part evolves [48]. In the experiment reported in this paper, the cut width error was reduced by securely clamping the part during cutting, but could still cause errors of 5% to 10% in magnitude and spatial misalignment of results by a small amount. These effects do not likely explain the larger differences between the stresses measured with contour and neutron diffraction techniques.
The contour method has been validated in the literature many times by comparison with other measurement methods, primarily neutron and synchrotron diffraction. For specimens other than welds, the agreement between contour and other methods is generally very good [1,25,29,52,53,46,24]. "Very good" means that the measurements should agree to within one standard deviation error bars at 68% or more of the points. In welds, the agreement is less consistent. Often the agreement is good or very good [54,2,17,11,55,3,56,57]. Other times there are significant regions of disagreement [13,15,10,16,51,12]. There is a slight trend of the diffraction results having higher stresses than the contour results, in contrast with the results in this paper. However, the trend may not be significant. Because of chemistry changes, welds can be problematic for diffraction measurements [41,42]. Round robin studies with multiple diffraction measurements on the same sample often show a large amount of scatter in the results [58-60]. Therefore, one should not read too much into a comparison with neutron diffraction measurements from a single laboratory. There has been no comparable round robin with the contour method.
The contour and neutron results agree for the bending stresses but not the total stress. Is that possible physically and can the results then still validate the -cut process for the contour method? Yes. Equilibrium considerations dictate that the net bending moment be the same at any circumferential location around the cylinder1. Therefore, the circumferentially averaged hoop stress measured by neutrons must have the same moment as any local relaxation by a single cut. However, the distribution of circumferentially averaged stresses (neutron) certainly need not agree with a local measurement (contour).
CONCLUSION
In order to prevent or at least minimize plasticity errors, a multiple cut procedure has been developed for measuring hoop stresses in cylinders with the contour method. A first cut is used to sever the ring, allow it to open or close, and to determine the bending-moment portion of the residual stresses. For the welded cylinder in this study, the bending moment stresses agreed well with the stresses measured by neutron diffraction, validating this portion of the procedure. The bending moment stresses were a small fraction of the total stress magnitude, but could have a big effect on plasticity errors if they are not relieved.
A discontinuity was measured in the surface contour in the cut cylinder because of an unwelded portion of the joint. A procedure was developed to smooth the contour data but retain the discontinuity. High stress gradients were determined by the contour method in the discontinuity region.
Unfortunately, the total residual hoop stresses measured by the contour method did not agree with those measured by neutron diffraction, making for an unsatisfying validation of the overall procedure. However, because the neutron diffraction measurements were averaged over the circumference compared to the contour measurements taken at a single location, the differences may be real rather than an error in either measurement.
