One-Dimensional Zone Schemes
We are now in a position to make additional important statements which contribute considerably to the understanding of the properties of crystals. For this we plot the energy versus the momentum of the electrons, or, because of (4.8), versus the wave vector, k. As before, we first discuss the one-dimensional case.
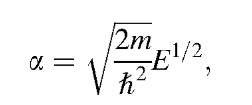
The relation between E and kx is particularly simple in the case of free electrons, as can be seen from (4.8),
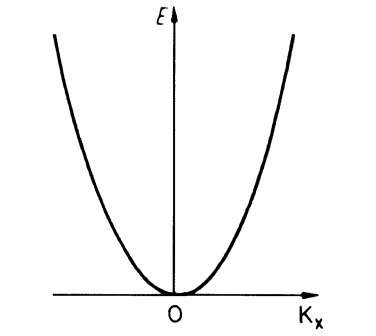
The plot of E versus kx is a parabola (Fig. 5.1).
We return now to (4.68), which we obtained from (4.67) for P = 0 (free electrons). Because the cosine function is periodic in 2p, (4.68) should be written in the more general form
Combining (4.8),
with (5.3) yields
Figure 5.1. Electron energy E versus the wave vector kx for free electrons.
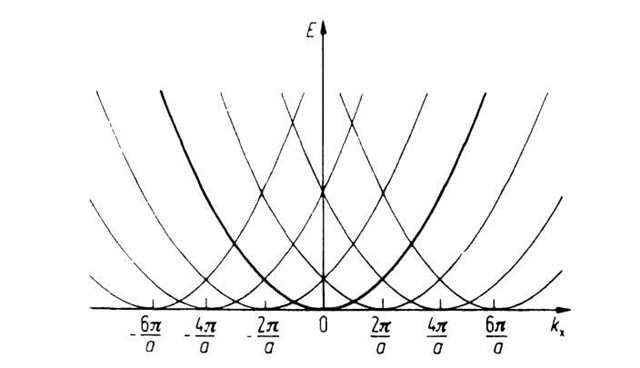
Figure 5.2. Periodic repetition of Fig. 5.1 at the points![]() The figure depicts a family of free electron parabolas having a periodicity of
The figure depicts a family of free electron parabolas having a periodicity of![]()
We see from (5.4) that in the general case the parabola, shown in Fig. 5.1, is repeated periodically in intervals of![]() (Fig. 5.2). The energy is thus a periodic function of kx with the periodicity
(Fig. 5.2). The energy is thus a periodic function of kx with the periodicity![]()
We noted, when discussing Fig. 4.11, that if an electron propagates in a periodic potential we always observe discontinuities of the energies when cos kxa has a maximum or a minimum, i.e., when cos![]() This is only the case when
This is only the case when
or
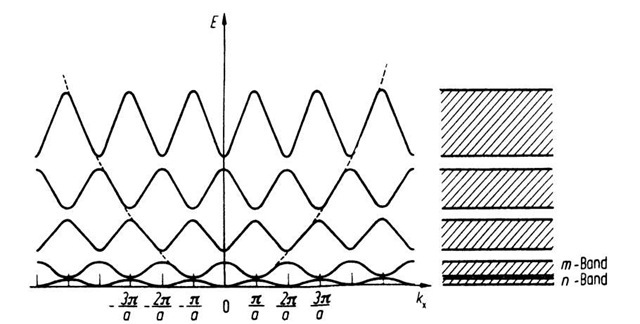
At these singularities, a deviation from the parabolic E versus kx curve occurs, and the branches of the individual parabolas merge into the neighboring ones.8 This is shown in Fig. 5.3.
Figure 5.3. Periodic zone scheme.
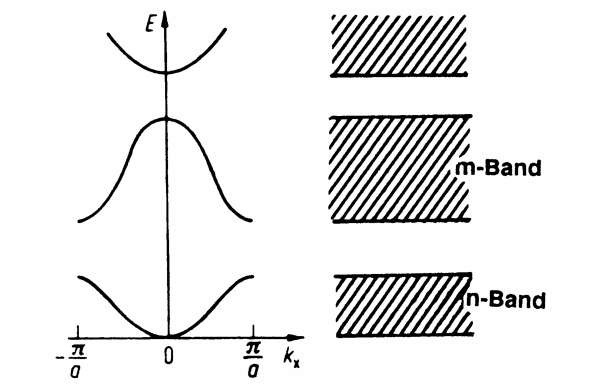
Figure 5.4. Reduced zone scheme. (This is a section of Fig. 5.3 between![]() )
)
The aforementioned consideration leads to a very important result. The electrons in a crystal behave, for most kx values, like free electrons, except when kx approaches the value n • p/a.
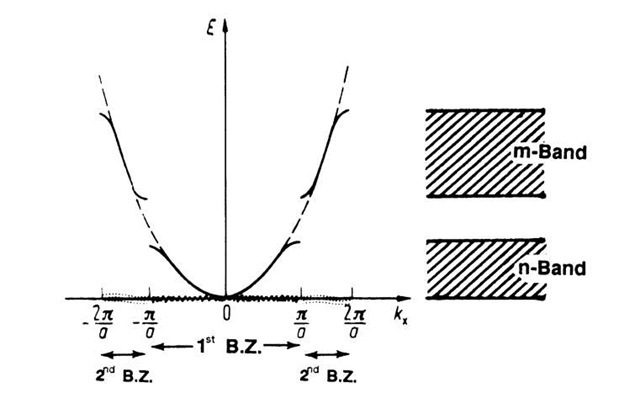
Besides this "periodic zone scheme" (Fig. 5.3), two further zone schemes are common. In the future we will use mostly the "reduced zone scheme" (Fig. 5.4), which is a section of Fig. 5.3 between the limits ±n/a. In the "extended zone scheme" (Fig. 5.5), the deviations from the free electron parabola at the critical points kx = n • p/a are particularly easy to identify.
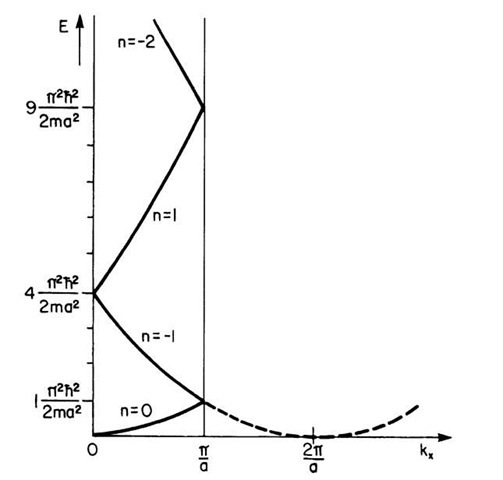
Occasionally, it is useful to plot free electrons in a reduced zone scheme. In doing so, one considers the width of the forbidden bands to be reduced until the energy gap between the individual branches disappears completely. This leads to the "free electron bands" which are shown in Fig. 5.6 for a special case. The well-known band character disappears for free electrons, however, and one obtains a continuous energy region as explained in Section 4.1. As before, the shape of the individual branches in Fig. 5.6 is due to the 2p/a periodicity, as a comparison with Fig. 5.2 shows.
Figure 5.5. Extended zone scheme. The first and second Brillouin zones (BZ) are shown, see Section 5.2.
Figure 5.6. "Free electron bands" plotted in the reduced zone scheme (cubic primitive crystal structure). Compare this figure with the central portion of Fig. 5.2, that is, with the region from zero to p/a. Note the sameness of the individual bands.
From (5.4), it follows that
By inserting different n-values in (5.7), one can calculate the shape of the branches of the free electron bands. A few examples might illustrate this:
The calculated data are depicted in Fig. 5.6. (The calculation of the remaining branches (bands) is left to the reader, see Problem 5.)
One important question has remained essentially unanswered: What do these E versus Ikl curves really mean? Simply stated, they relate the energy of an electron to its k-vector, i.e., with its momentum. They provide in principle quite similar information as, for example, a distance versus time diagram for a moving car, or a "stress-strain diagram" in mechanical metallurgy, or a "phase diagram" in materials science. All these diagrams relate in graphic form one parameter with another variable in order to provide an easier interpretation of data. We shall eventually learn to appreciate complete band diagrams in later topics, from which we will draw important conclusions about the electronic properties of materials.
In Figs. 5.3, 5.4, and 5.5 the individual allowed energy regions and the disallowed energy regions, called band gaps, are clearly seen. We call the allowed bands, for the time being, the n-band, or the m-band, and so forth. In later sections and particularly in semiconductor physics (see topic 8) we will call one of these bands the valence band (because it contains the valence electrons) and the next higher one the conduction band.
An additional item needs to be mentioned: It is quite common to use the word "band" for both the allowed energy regions, such as the n-band or the m-band, as well as for the individual branches within a band as seen, for example, in Fig. 5.6. As a rule this does not cause any confusion.
Finally, we need to stress one more point: The wave vector k is inversely proportional to the wavelength of the electrons (see equation (4.9)). Thus, k has the unit of a reciprocal length and is therefore defined in "reciprocal space." The reader might recall from a course in crystallography that each crystal structure has two lattices associated with it, one of them being the crystal (or real) lattice and the other the reciprocal lattice. We will show in Section 5.5 how these two lattices are related. The following may suffice for the moment: each lattice plane in real space can be represented by a vector which is normal to this plane and whose length is made proportional to the reciprocal of the interplanar distance. The tips of all such vectors from sets of parallel lattice planes form the points in a reciprocal lattice. An X-ray diffraction pattern is a map of such a reciprocal lattice.
One- and Two-Dimensional Brillouin Zones
Let us again inspect Fig. 5.5. We noticed there that the energy versus kx curve, between the boundaries —p/a and +p/a, corresponds to the first electron band, which we arbitrarily labeled as n-band. This region in k-space between —p/a and +p/a is called the first Brillouin zone (BZ). Accordingly, the area between p/a and 2p/a, and also between —p/a and —2p/a, which corresponds to the m-band, is called the second Brillouin zone. In other words, the lowest band shown in Fig. 5.5 corresponds to the first Brillouin zone, the next higher band corresponds to the second Brillouin zone, and so on. Now, we learned above that the individual branches in an extended zone scheme (Fig. 5.5) are 2p/a periodic, i.e., they can be shifted by 2p/a to the left or to the right. We make use of this concept and shift the branch of the second Brillouin zone on the positive side of the E — (kx) diagram in Fig. 5.5 by 2p/a to the left, and likewise the left band of the second Brillouin zone by 2p/a to the right. A reduced zone scheme as shown in Fig. 5.4 is the result. Actually, we projected the second Brillouin zone into the first Brillouin zone. The same can be done with the third Brillouin zone, etc. This has very important implications: we do not need to plot E versus k-curves for all Brillouin zones; the relevant information is, because of the 2p/a periodicity, already contained in the first Brillouin zone, i.e., in a reduced zone scheme.
We now consider the behavior of an electron in the potential of a two-dimensional lattice. The electron movement in two dimensions can be described as before by the wave vector k that has the components kx and ky, which are parallel to the x- and y-axes in reciprocal space. Points in the kx — ky coordinate system form a two-dimensional reciprocal lattice (see Fig. 5.7). One obtains, in the two-dimensional case, a two-dimensional field of allowed energy regions which corresponds to the allowed energy bands, i.e., one obtains two-dimensional Brillouin zones.
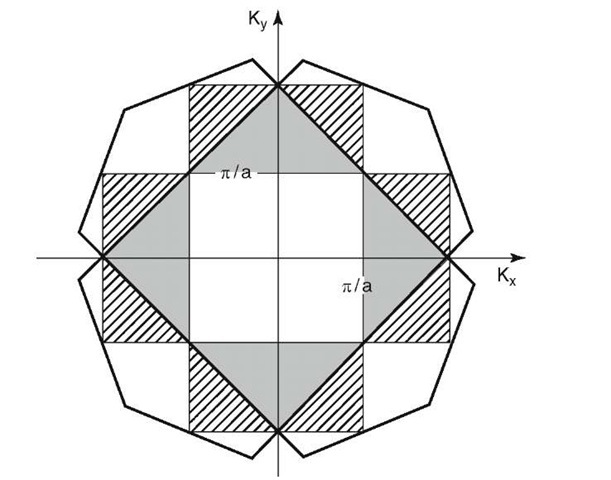
We shall illustrate the construction of the Brillouin zones for a two-dimensional reciprocal lattice (Fig. 5.7). For the first zone one constructs the perpendicular bisectors on the shortest lattice vectors, G1. The area that is enclosed by these four "Bragg planes" is the first Brillouin zone. For the following zones the bisectors of the next shortest lattice vectors are constructed. It is essential that for the zones of higher order the extended limiting lines of the zones of lower order are used as additional limiting lines. The first four Brillouin zones are shown in Fig. 5.8. Note that all the zones have the same area. The first four shortest lattice vectors G1 through G4 are drawn in Fig. 5.7.
Figure 5.7. Four shortest lattice vectors in a kx — ky coordinate system and the first Brillouin zone in a two-dimensional reciprocal lattice. (Cubic primitive crystal structure.)
Figure 5.8. The first four Brillouin zones of a two-dimensional, cubic primitive reciprocal lattice.
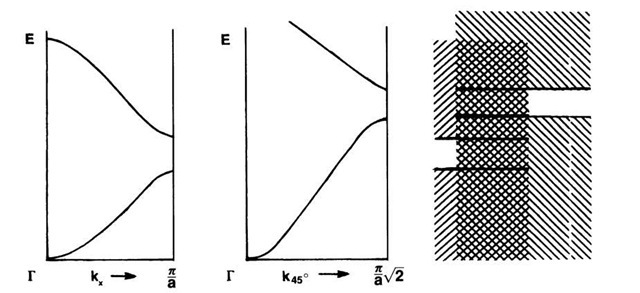
The significance of the Brillouin zones will become evident in later sections, when the energy bands of solids are discussed. A few words of explanation will be given here, nevertheless. The Brillouin zones are useful if one wants to calculate the behavior of an electron which may travel in a specific direction in reciprocal space. For example, if in a two-dimensional lattice an electron travels at 45° to the kx-axis, then the boundary of the Brillouin zone is reached, according to Fig. 5.8, for
This yields with (4.8) a maximal attainable energy of
On the other hand, the boundary of a Brillouin zone is reached at
when an electron moves parallel to the kx- or ky-axes. The largest energy that electrons can assume in this second case is only
Once the maximal energy has been reached, the electron waves form standing waves (or equivalently, the electrons are reflected back into the Brillouin zone).
The consequence of (5.8) and (5.9) is an overlapping of energy bands which can be seen when the bands are drawn in different directions in k-space (Fig. 5.9). We will learn later that these considerations can be utilized to determine the difference between metals, semiconductors, and insulators.
*The occurrence of critical energies at which a reflection of the electron wave takes place can also be illustrated in a completely different way. This will be done briefly here because of its immediate intuitive power. We consider an electron wave that propagates in a lattice at an angle 9 to a set of parallel lattice planes (Fig. 5.10). The corresponding rays are diffracted on the lattice atoms. At a certain angle of incidence, constructive interference between rays 10 and 20 occurs. It has been shown by Bragg that each ray which is diffracted in this way can be considered as being reflected by a mirror parallel to the lattice planes.
Figure 5.9. Overlapping of allowed energy bands.
Figure 5.10. Bragg reflection of an electron wave in a lattice. The angle of incidence is 0.
In other words, at a critical angle the "reflected" rays will be enhanced considerably. This is always the case when the path difference 2a sin 0 is an integer multiple of the electron wavelength l, i.e., when
(Bragg relation). With (4.9) one obtains, from (5.10),
and therefore
For perpendicular incidence (0 = 90°) equation (5.11) becomes (5.9). On the other hand, if 0 = 45°, one obtains (5.8).
Equation (5.11) leads to the result that for increasing electron energies a critical k-value is finally reached for which "reflection" of the electron wave at the lattice planes occurs. At this critical k-value the transmission of an electron beam through the lattice is prevented. Then, the incident and the Bragg-reflected electron wave form a standing wave.
Three-Dimensional Brillouin Zones
In the previous section, the physical significance of the Brillouin zones was discussed. It was shown that at the boundaries of these zones the electron waves are Bragg-reflected by the crystal. The wave vector Ikl = 2p/1 was seen to have the unit of a reciprocal length and is therefore defined in the reciprocal lattice. We will now attempt to construct three-dimensional Brillouin zones for two important crystal structures, namely, the face-centered cubic (fcc) and the body-centered cubic (bcc) crystals. Since the Brillouin zones for these structures have some important features in common with the so-called Wigner-Seitz cells, it is appropriate to discuss, at first, the Wigner-Seitz cells and also certain features of the reciprocal lattice before we return to the Brillouin zones at the end of Section 5.5.

