ABSTRACT
Granular materials such as sand are crushed and compacted locally when subjected to projectile penetration. It is necessary to obtain more diagnostic information during the experiment to develop a thorough understanding of the deformation mechanisms inside the target. In this study, we embedded piezoelectric film pressure gages at strategically distributed locations inside cylindrical sand targets. The gages are designed to measure only the pressure normal to the gage plane. The pressure gages are calibrated using a Kolsky bar before being embedded into the targets. The instrumented target is then subject to penetration by a cylindrical steel projectile with a semi-spherical nose. The distributed gages measure the pressure histories at the local gage positions. Flash X-rays installed around the target record the instant images of moving projectile and the gages inside the target. It was found that the penetration-induced pressure concentrates locally around the projectile.
INTRODUCTION
Sand has been widely used as a defensive material in military applications to defeat kinetic energy penetrators. Sand is a typical granular material and has complicated behaviors because of particle interactions [1]. Under dynamic loading condition, sand can be locally compacted and allow stress to propagate through specific chains, which may not be completely modeled by continuum mechanics [1-6].
Penetration into sand has been investigated in many studies [4-8]. However, predictive capabilities remain poor, indicating that improvements in the understanding of mechanisms are necessary. Most experimental investigations on penetration into sand have been focused on the relation between projectile conditions and maximum depth of penetration. In terms of numerical approaches, sand has been modeled using hydrodynamic assumptions that many theories of penetration have been based on [6-9]. These models give detail information on the status of targets such as stress profiles and medium displacements as well as the depth of penetration. However, the predicted quantities, such as stress field around a penetrator, have rarely verified by experiments. To develop more accurate models of sand penetration, obtaining diagnostic information beyond traditional experimental methods from experiments is necessary. The pressure measurement in sand and soil has been conducted with diaphragm gages or pressure transducers with static loading conditions in large scale samples [10]. For small scale samples, the measurement can vary with the ratio of gage size to particle size. Under dynamic loading conditions, sand can be locally deformed and inelastically packed, which makes the measurements more challenging [1,2].
Under projectile penetration conditions, stress propagates in three dimensions with various stress components in the medium. To capture the distribution of pressure inside the target, we use special piezoelectric gages designed to measure only the stress component normal to the gage planes. To validate their response and quantify their sensitivity, the in-house-assembled pressure gages are calibrated with a Kolsky bar before being embedded into the targets. To observe trajectory of projectiles during penetration and to evaluate the motion of sand in the target, we use flash X-rays that pass through the sand but are blocked by high density metals.
EXPERIMENTS
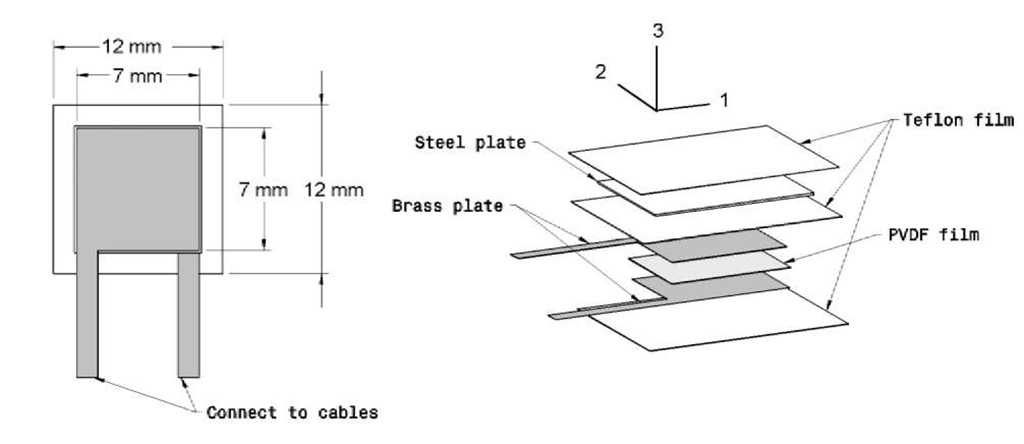
As a projectile move ahead, a cavity expands in the radial direction, generates stress propagation and transfers media in the radial directions [8,9]. The stress propagation and pressure caused by transferring media are generally three dimensional. We developed a special gage responding to only normal pressure as shown in Fig. 1.
Fig. 1 Design of piezoelectric gage to measure normal pressure
The pressure gage consists of a piece of 0.0254 mm-thick piezoelectric film, PVDF, between two thin brass plates serving as electrodes. The gage is covered with Teflon tapes to avoid taking in-plane shear stresses. The brass plates and PVDF film are not bonded for the same purpose. To protect the gage from damage by sharp sand particles, steel or aluminum plates are attached at both sides. Even though the manufacturer provides electro-mechanical conversion factors, the gage needs to be calibrated because the specific arrangement of the gage inside the sand medium may affect the gage sensitivity. If there is no electric field around the gage, the response of piezoelectric film is calculated by [12].
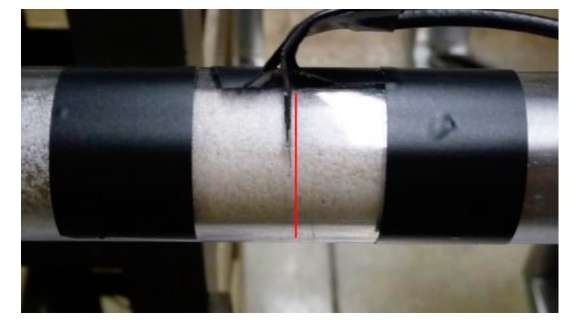
where dij is a piezoelectric strain constant for each direction. (See Fig. 1 for the directions). The thickness of PVDF film is very thin, only 0.0254 mm, so the area Aj and A2 are negligible. Even though the PVDF film is not bonded with the brass plates, the film can have cn and c22 because the edges of film are loosely confined with Teflon tapes and in-plane deformation is caused by Poisson effect. The low friction and relatively heavy protection cause little transfer of shear stress to the film. To calibrate the gage, a Kolsky bar was employed. The gages were sandwiched between the incident bar and transmission bar to let uni-axial stress be applied in the orthogonal direction. The sensitivity is obtained by adjusting the charge amplifier until the outputs from gages match the difference between the incident and reflected pulses. After the sensitivity of the gage is determined, a polycarbonate tube filled with sand was inserted between two bars. The gages were embedded in the sand tube to evaluate the gage response when the sand is loaded (Fig. 2).
Fig. 2 Configuration of a piezoelectric gage embedded in a sand column in a Kolsky bar
The amount of sand in front and behind the gage affects the response because compacted sand reduces the stress transfer [2]. To simulate the environment inside the target, various amounts of sand were inserted between the gage and the incident bar, whereas the sand amount between the gage and the transmission bar remains constant.
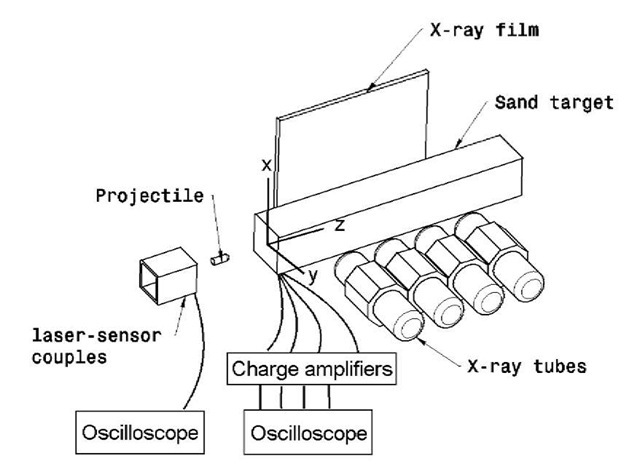
Fig. 3 illustrates the experimental setup. A light gas gun was employed to launch projectiles at high velocities. The couples of lasers and sensors detect the passage of the projectile, which gives the flight velocity by the time interval. Projectiles are 50.8-mm long, 12.7-mm diameter cylinder and have semi-spherical heads. They are made with 4340 steel and weighs 46.5 g each.
Fig. 3 Configuration of experimental setup
The cross-section of the sand target is 10.2 cm by 10.2 cm, which is the maximum depth of sand that X-ray penetrates and records images with reasonable quality. For consistency, Ottawa 20/30 sand conforming to ASTM C778 was used to fill the target. Density was measured as 1.61 kg/m3. Two types of sand targets were constructed; one having distributed iron balls for observation of particle motion by X-ray and the other having pressure gages for pressure measurement. Four flash X-ray tubes located in serial to record instance image of projectile in the target. The gage positions were decided by preliminary tests. The position of each gage is tabulated in Table 1.
Fig. 3 showed the coordinate system and the center of target surface is the origin. The speed of projectile is approximately 180 m/s.
Table 1 Lists of test with positions of gages
|
No |
Velocity |
Gage 1 |
Gage 2 |
Gage 3 |
Gage 4 |
||||
|
(m/s) |
X (cm) |
Z (cm) |
X (cm) |
Z (cm) |
X (cm) |
Z (cm) |
X (cm) |
Z (cm) |
|
|
1 |
151 |
-1.3 |
5.1 |
-1.3 |
12.7 |
-1.3 |
25.4 |
-1.3 |
38.1 |
|
2 |
184 |
-1.3 |
5.1 |
-1.3 |
12.7 |
-1.3 |
25.4 |
-1.3 |
38.1 |
|
3 |
184 |
1.3 |
5.1 |
1.3 |
12.7 |
1.3 |
25.4 |
1.3 |
38.1 |
EXPERIMENTAL RESULTS
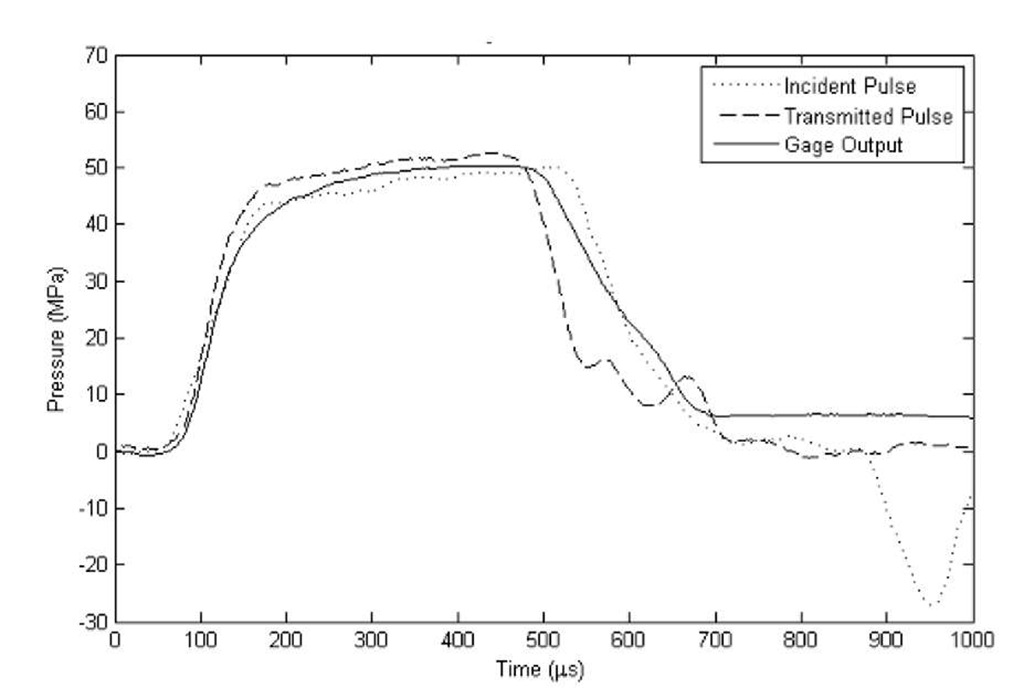
Fig. 4 shows a set of results from gage calibration tests with the Kolsky bar. The gage was inserted between the incident bar and transmission bar without sand. A small part of incident pulse reflects from the gage because the impedance of gage package containing polymer and aluminum is lower than the steel bar. The sensitivity of the charge amplifier was adjusted to make the plateau of gage output closed to the incident pulse. The sensitivity was found to be -3.4 pC/N. This calibration procedure was repeated with incident pulses of higher amplitudes. All the factors obtained from other tests agree well with -3.4 pC/N.
Fig. 4 Comparison of incident, transmitted pulses and adjusted gage output
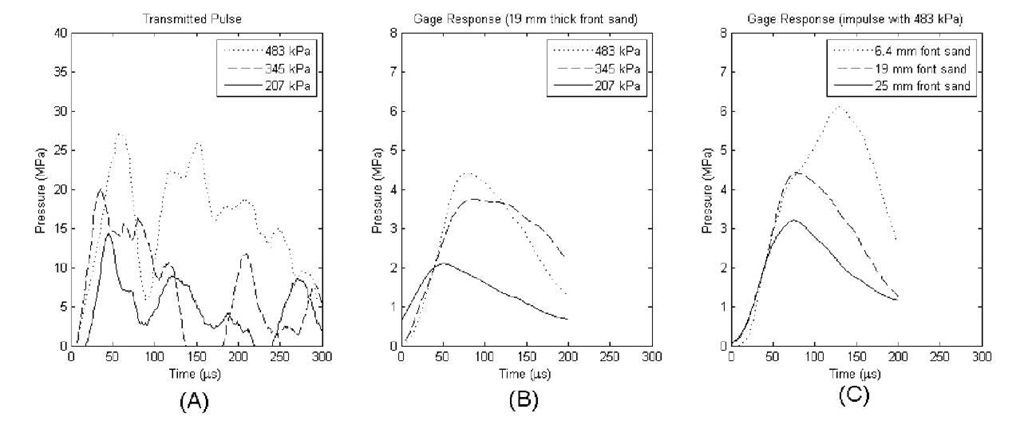
To simulate gage behavior in the sand target, the gage was embedded into a sand sample placed between the bars. To examine the effect of distance from a projectile to gages, the length of sand between the gage and the incident bar was set as 6.4 mm, 19 mm and 25 mm. The gas chamber pressure to drive the striker was set at 207 kPa, 345 kPa and 483 kPa. The corresponding outputs of gage for each case are shown in Fig. 5. (A) shows the transmitted pulses from the incident bar to the sand and was calculated by subtracting the reflected pulse from the incident pulse. (B) and (C) are the outputs from gage, which show the trends according to the impulse strength and the thickness of sand in front of the gage, respectively.
Fig. 5 Transmitted impulse to sand and corresponding outputs from gages
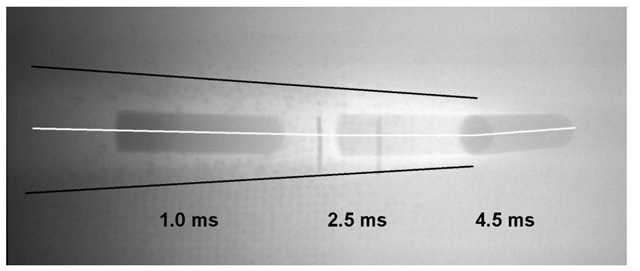
Fig. 6 shows X-ray images recording the instants of particle motion in the sand target. Three flash X-rays were emitted on the film. Each number on the figure represents the time of each frame was taken after the projectile struck the surface of the target. The region marked by two black lines is affected by the projectile and narrows as the projectile proceeds and slows down. The maximum diameter of this region is approximately 36 mm, which is three times the projectile diameter. The small diameter of head of the projectile locating at the deepest position in the target indicates that the projectile tuned to left side (in the negative y direction in Fig. 3).
Fig. 6 X-ray image of target embedding iron balls (striking velocity: 178 m/s)
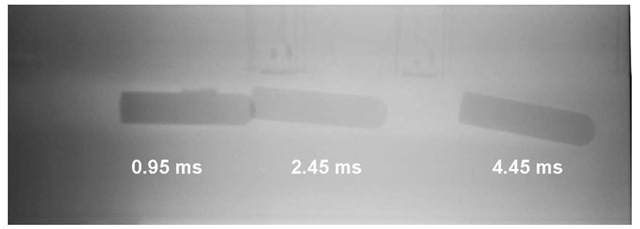
Fig. 7 shows X-ray images capturing the moments of penetration. All gages were installed at the bottom (in the negative x direction in Fig. 3). The projectile turned to the top side away from gages during penetration. Asymmetric positions of gage may cause the curved trajectory. The projectile changed the direction again to the center as shown in the last shadow image. This may be caused by reflection from the aluminum wall of the target.
Fig. 7 X-ray images of sand target embedded with pressure gages (Test 2)
Fig. 8 shows X-ray images capturing the moments of penetration. In this case, all the pressure gages were installed near the top (in the positive x direction) of the target box, opposite to previous set. Consequently, the projectile turned to the bottom side, again away from the gages. This indicates that the gages may indeed interfere with the motion of the projectile inside the target. After learning this lesson, we will install pressure gages at symmetric locations inside the sand targets in the future studies.
Fig. 8 X-ray image of sand target embedded pressure gages (Test 3)
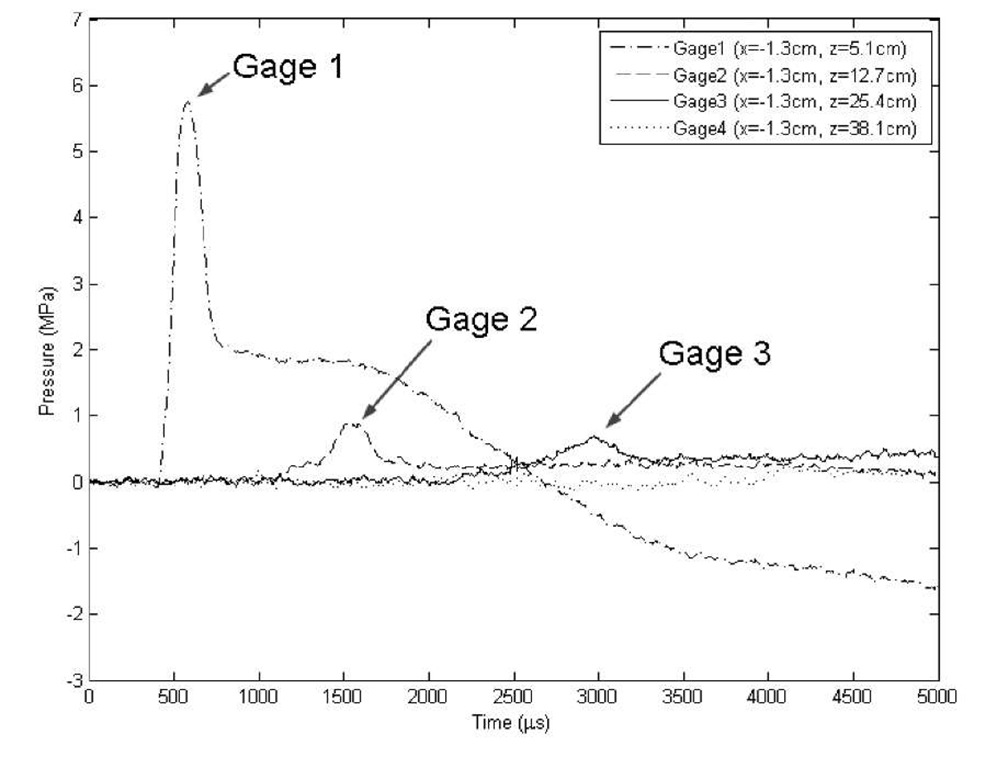
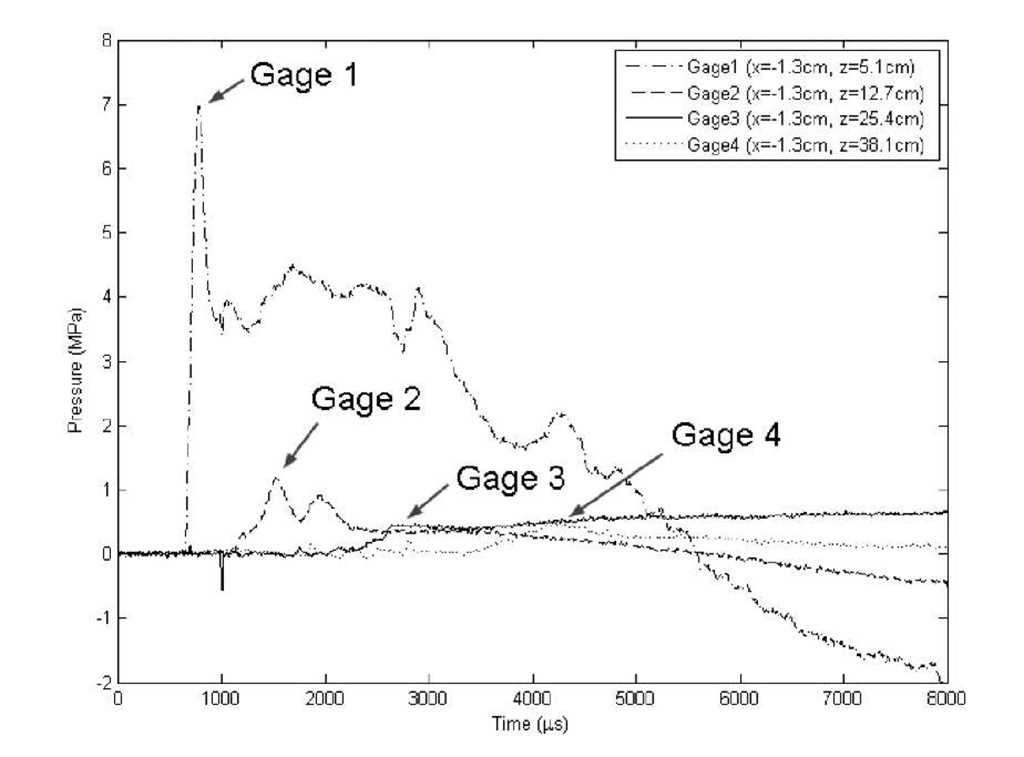
Fig. 9 shows stress variations at each gage location in Test 1. The output from Gage 1 has a sharp peak initially and then slowly decays. The high speed impact by the projectile induces the rapidly increasing pulse for a short duration. As shown in the X-ray images in Fig. 6, Gage 1 was supposed to be exposed at the cavity completely because the radius of cavity at the mouth of target is expected to exceed the distance from the centerline to Gage 1. It is believed that the slow decay and large pressure were caused by the cavity. Gages 2 and 3 recorded peaks when the projectile passed by the gage locations. Gage 3 has a lower peak value than Gage 2.
Fig. 9 Pressure induced by projectile in Test 1
Fig.10 shows the penetration-induced pressure variation recorded in Test 2. Even though the output from Gage 1 has rough fluctuations, it has a sharp peak and slow decaying, which is similar to the Gage 1 records in Test 1. Gages 2, 3 and 4 also had peaks as the projectile passed by the gage locations in sequence. The peaks value of each gage decreased as projectile traveled further because it moved farther away from the gages, as well as slowing down.
Fig.10 Penetration induced pressure variations in Test 2
CONCLUSIONS
Piezoelectric gages were designed and fabricated to measure pressure variations in sand targets during projectile penetration. The sensitivity of the pressure gages was determined in the calibration tests with a Kolsky bar. The size of cavity during penetration was imaged with flash X-rays. The maximum size of cavity is three times the diameter of the projectile. The embedded pressure gages measured the pressure variations at different locations in the sand target as the projectile passed by.
