ABSTRACT
The strain rate response of PMMA was investigated under uniaxial compression at room temperature at strain-rates ranging from 0.0001/sec to about 4300/sec. In addition, the temperature response of PMMA was investigated at strain-rates of 1/sec and 0.001/sec at temperatures ranging from 0°C to 115°C (below Tg). High rate experiments at room temperature (greater than 1/sec rates) were conducted using a split-Hopkinson Pressure bar (SHPB) with pulse-shaping. This is necessary to induce a compressive loading on the specimen at a constant strain rate to achieve dynamic stress equilibrium. Results conducted at room temperature show that PMMA is strain rate sensitive from quasi-static to dynamic loading. Additionally, the stress-strain response exhibits a decrease in the flow stress with an increase in temperature. These experimental data are being used to develop constitutive behavior models of PMMA.
INTRODUCTION
Polymethyl methacrylate (PMMA) is a thermoplastic polymer that is widely used in many applications in the automotive, medical, industrial, and consumer markets [1] due to its exceptional clarity and lightweight (density of about 1.18-1.19g/cm3). In addition, this polymer has exceptional high-impact strength characteristic. This makes the material appealing to use for windows for protection against bullets and blast. Thus, it is essential to understand the dynamic mechanical response of PMMA in transparent armor applications for the Army.
PMMA has been extensively investigated over the past decades for its toughness, tensile, and compressive strengths. However, the mechanical response and failure behavior at high strain rates are still not completely understood. The mechanical properties of polymers are dependent upon two key factors, the rate of deformation and temperature. Observation of polymers, tested at high rates of strain, typically has an increase of the yield strength and the modulus and a decrease in strain to failure when compared to quasi-static results [2, 3]. Another study by Hall [4] reports the temperature of PMMA increases during deformation at high strain rate, whereas no temperature change at lower rates. Work by Walley et al [5] has shown that the strain rate and temperature affects the strain hardening behavior of glassy polymers. Three-dimensional material models by Arruda et al [6] and Boyce et al [7] for both PC and PMMA have been proposed to predict the trend for differing strain rates. Observation in their experiments has shown that adiabatic heating occurs over a range of strain rates (10-3/s to 10-1/s) for axial and in-plane compressive loading. Since polymers in nature having poor thermal diffusivity, adiabatic conditions are expected to prevail during high deformation rates.
One common technique employed to study materials under dynamic loading and high strain-rate deformation is the Kolsky [8] bar method or prevalently known as split-Hopkinson pressure bar (SHPB). For example, Weerasooriya [9] and Green et al [10], each studied the compression behavior affected by a low-to-high strain rate response for Tungsten heavy alloys on a Maraging steel split-Hopkinson bar. Maiden and Green [11] used the SHPB to determine the dynamic compressive stress-strain behavior of Lucite and Micarta. Chou et al [12] also measured the compressive behavior of plastics using similar methods and Briscoe and Nosker [13] determined the rate effects on the flow stress of high-density polyethylene. Both works have also observed that the yield strengths increase with an increase in the strain rate. More recent work, Chen et al [14, 15] used a modified aluminum SHPB to study an epoxy, Epon 828/T-403, under high strain rate uni-axial tension and compression conditions.
However, the testing of polymeric materials at high rates using the split Hopkinson bar has many challenges. These are 1) during high rate of loading, the specimen should be in dynamic stress equilibrium and deform uniformly for nearly the entire duration of the experiment, 2) during deformation, the strain rate should be nearly constant, and 3) the transmitted signals from strain gages are minute, and therefore there is a need to improve methods to measure these signals for valid experiments. These issues are discussed later in this paper.
MATERIAL
The polymethyl methacrylate (PMMA), used in this study is Plexiglas G™ manufactured by Atofina Chemicals and acquired from a local distributor. The Plexiglas G is made from a cell-casting process, which offers exceptional optical-clarity, high design stress, weatherability, and ease of fabrication from acrylic sheets [16]. The sheets were fabricated into a cylindrical-shaped specimen from stock material of 3 mm thickness of the as-received sheet stock material, resulting in gauge length of the same dimension. A 6 mm diameter test specimen yields a diameter to length ratio of 2:1 and permitted an improved signal-to-noise ratio resolution from load cell in the low rate experiments. Also, the relatively smaller cross sectional area with the small gage length allowed higher strain rates to be attained on the aluminum Hopkinson bar beyond 2000/s without exceeding the bars’ elastic limit. Considerations were taken into account for the geometry of the compression samples, since it has been known that the thickness, or gage length in this case, affects the results in Hopkinson bar experiments [17]. A small batch of PMMA specimens was heat treated to relieve any possible residual stresses initiated from the lathe-machining process. The annealing temperatures were set for 2 hours at the materials’ glass transition temperature, 105oC in a vacuum oven. Experimental results would reveal there was no significant deviation between the annealed samples and the unannealed.
LOW RATE EXPERIMENTS
Uni-axial quasi-static (10-3/s) and intermediate (1/s) strain rate experiments were conducted on an Instron, model 1331, servo-hydraulic test frame. A (TBASIC) computer program was written to command an exponentially decaying signal to achieve the desired constant strain rate. Load and displacement data were acquired from the Instron using a Nicolet digital oscilloscope. Petroleum jelly was used as lubricant on the specimen ends to minimize friction effects that possible cause barreling during loading. For each test, the specimen was placed on the center of the hardened steel platen, in-line with the actuator for conformity to ensure uni-axial compressive loading. To correct the measured displacement data, the compliance of the machine was also obtained without any specimens. For the low and high temperature experiments, an Instron model 3119-007 environmental chamber was used. The chamber has the capability to operate up to 350°C and with the use of liquid nitrogen, cryogenic temperatures to -40°C. All compression samples were temperature soaked to a minimum of 1 hour prior to testing.
SPLIT-HOPKINSON BAR EXPERIMENTS
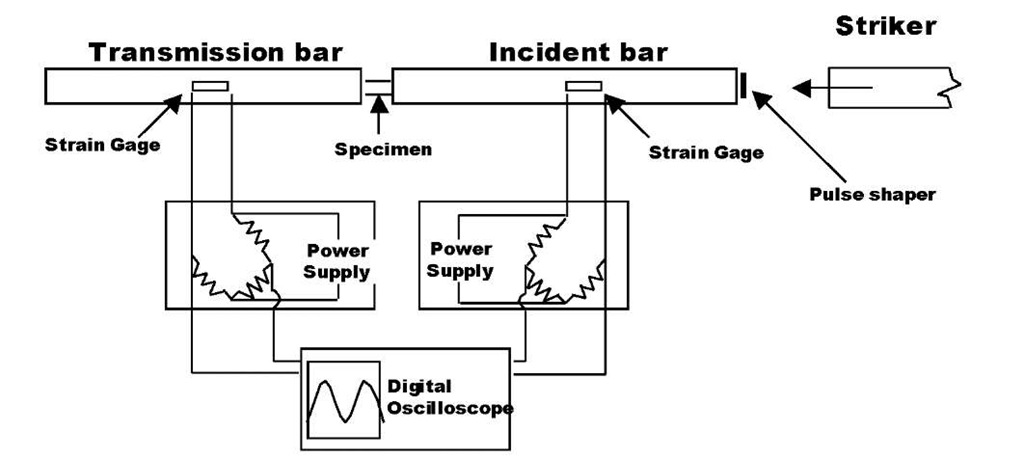
A conventional split Hopkinson pressure bar (SHPB) consists of a striker, an incident bar, and a transmission bar as shown in Figure 1. The working principle of such a setup is well documented [18, 19]. Assuming a homogeneous deformation in the specimen and identical incident and transmission bars, analysis based on one-dimensional wave theory [8] shows that the specimen’s nominal strain rate, s (t), as
where L is the original gage length of the specimen, sr (t) is the time-resolved strain associated with the reflected pulse in the incident bar, and C0 is the elastic bar-wave velocity of the bar material. Integration of equation (1) with respect to time gives the time-resolved axial strain of the specimen. The nominal axial stress, ct, in the specimen is determined using the equation
where As is the cross-sectional area of the specimen, sr(t) is the time-resolved axial strain in the transmission bar of cross-sectional area At and Young’s modulus Et.
Traditionally, the use of the Hopkinson bar apparatus to obtain large deformation in low-impedance materials such as polymers was very limited due to a high noise to signal ratio in the transmission bar. This is due to the high impedance mismatch from the metal incident bar to the polymer specimen, the sign is reduced several fold, when compared to metal alloy samples.
Figure 1. Schematic of pulsed-shaped SHPB Set-up
To mitigate this problem, Chen at al [14, 15, 20] used aluminum bars with a pulse-shaping technique. This ensures that the noise to signal ratio is low and that the equilibrium stress state and homogenous deformation in the polymer had been reached before failure/yielding occurred. A version of an aluminum Hopkinson pressure bar at the US Army’s Rodman Materials Research Laboratory was used to carry out the PMMA high rate experiments incorporating similar methods. High strength aluminum bars were acquired and specified to be centerless grounded to a diameter of 19 mm. In this experimental setup, strikers of varying lengths from 50 mm to 254 mm, comprised of the same aluminum material for the bars, provided the necessary amplitude and duration of the incident pulse. The pulse length is a function of the pulse shaper and striker length. Annealed copper disks of different thickness and diameters were employed for pulse shaping and placed at the incident bar end where the striker impacts. In some cases, different diameter and thickness copper disks were stacked to obtain the correct pulse shape. For the work presented in this paper, only room temperature experiments were conducted at the high strain rate.
RESULTS AND DISCUSSION
High Rate Effects
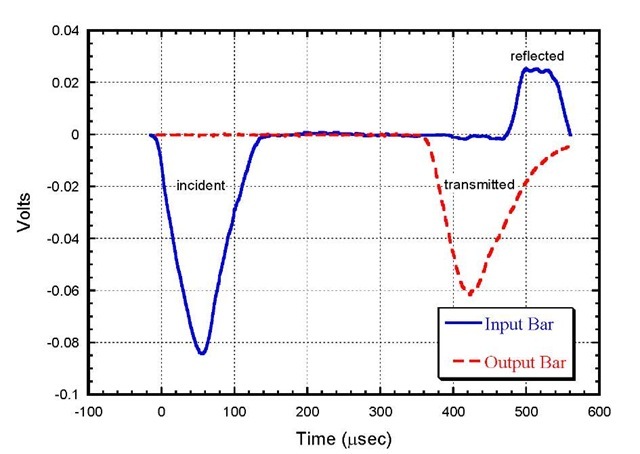
A typical set of stress pulses in the input and output bars is shown in Figure 2. The reflected pulse shows that a plateau has been reached after an initial rise indicating the specimen is deforming under a constant strain rate, which is essential for testing of polymeric materials.
Figure 2. Typical input and output bar stress waves.
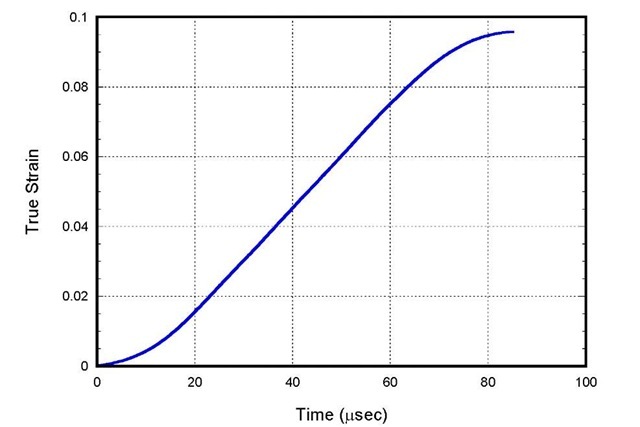
Polymeric materials are much more rate sensitive compared to traditional metals even during elastic deformation and thus it is important to reach a constant strain rate during testing. To further indicate that a constant strain rate was achieved, Figure 3 shows the true strain as a function of time. Since the strain increases almost linearly over a majority of the time, this confirms that a true strain rate controlled test has been achieved on the Hopkinson bar with pulse-shaping.
Figure 3. True Strain as a Function of Time for PMMA at about 1300/s.
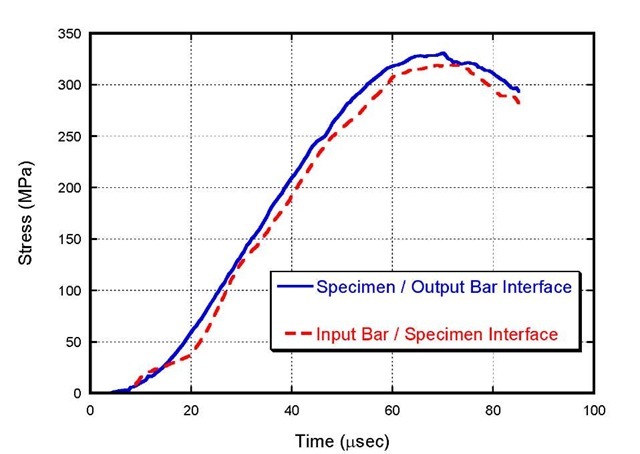
For a typical SHPB experiment, the stresses at the specimen/input-bar interface and specimen/output-bar interface are shown in Figure 4. The stress profiles, at both interfaces are approximately equal. This shows that the specimen is in a state of dynamic equilibrium.
Figure 4. Stresses at Specimen / Bar Interfaces for PMMA at 1300/s Strain Rate with Pulse-Shaping
Figure 5. Stress-Strain Behavior for PMMA at Various Strain Rates
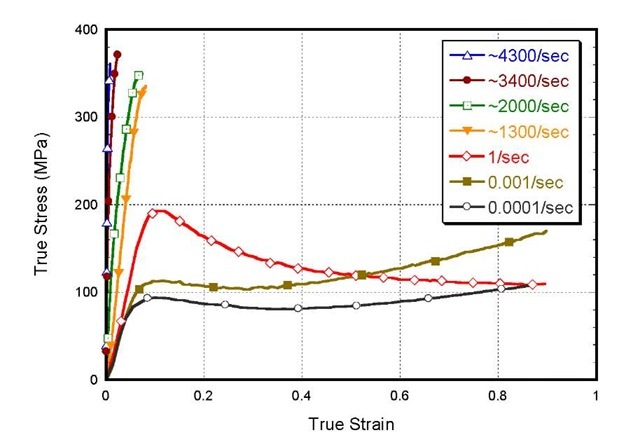
Figure 5 summarizes the stress-strain behavior for PMMA over a strain rate range from 10-4/s to 4300/s. The low rate results reveal a typical behavior for thermoplastics under compression. First the material undergoes intrinsic softening followed by increasing strain hardening. Intrinsic softening appears to be the governing factor in the initiation of plastic deformation like necking or crazing in these glassy polymers [21]. Between these two low strain rates, the observed flow stress increases with the increase of strain rate. However, in the case for 1/s, the intrinsic softening is completely dominant beyond yield. The maximum strain achieved was consistently about 0.9 the for low rate experiments. At higher strain rates conducted on the Hopkinson bar, PMMA fractures at lower total strain and at a higher flow stress. The decrease in strain to failure was evident with the increase in the strain rate. The apparent modulus from the flow stress data increases from 1.78 GPa for 10-4/s to 123.55 GPa at 4300/s. Table 1 shows the apparent modulus, yield strength, and strain to failure for the PMMA at the strain rates carried out at room temperature. From these values, both the moduli and yield strengths increase with increase in strain rate. Yield strength for 3400/sec and 4300/sec were unobtainable since the PMMA failed prior to yielding.
Table 1. Apparent Modulus and Apparent Yield Strength of PMMA at Strain Rates Tested
|
Strain Rate |
Modulus (GPa) |
Yield Strength (MPa) |
Strains to Failure |
|
10-4/s |
1.78 |
93.91 |
N/A |
|
10"3/s |
1.75 |
112.81 |
N/A |
|
1/s |
2.38 |
192.95 |
N/A |
|
1300/s |
5.14 |
335.55 |
0.0810 |
|
2000/s |
11.42 |
350.00 |
0.0730 |
|
3400/s |
58.71 |
N/A |
0.0250 |
|
4300/s |
123.35 |
N/A |
0.0059 |
Figure 6. Yield Strength as a Function of Strain Rate for PMMA at Room Temperature
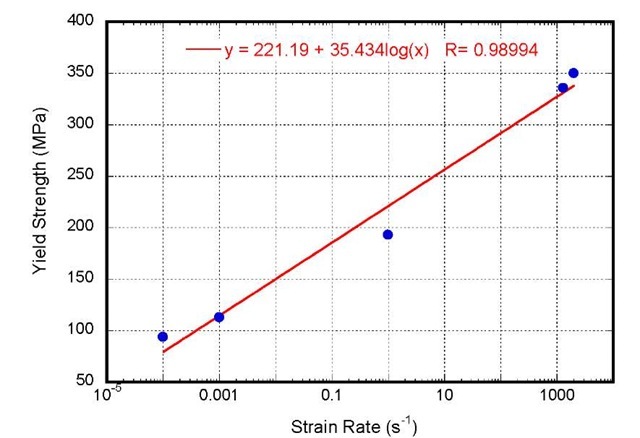
Figure 6 shows the plot of the apparent yield strength as a function of strain rate. This plot clearly indicates that PMMA is rate sensitive in which the yield strength increases with the increase of strain rate. Although the test conducted at 1/s reveals some thermal softening, it is not well understood how much of the intrinsic adiabatic heating affects the yield strengths.
Temperature and Quasi/Intermediate Rate Effects
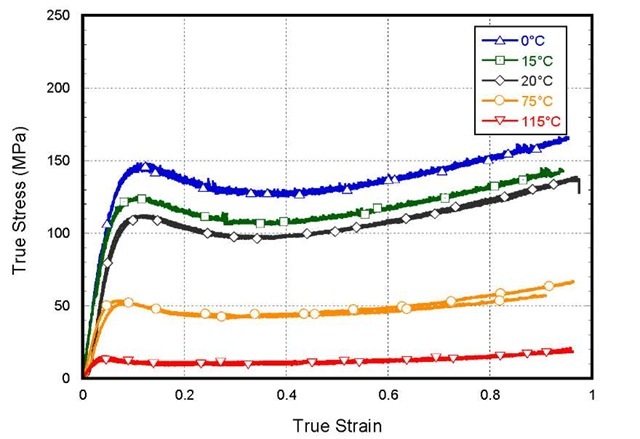
Figures 7 and 8 are the stress-strain responses for PMMA conducted over a range of temperatures at strain rates 10-3/sec (quasi-static) and 1/s (intermediate), respectively. For the quasi-static experiments at the lower temperatures of 0°C and 15°C, PMMA behaves similar to the room temperature test. There is an intrinsic softening followed by strain hardening. The only subtle difference is that the flow stresses gradually increases from room temperature to the low temperature. All three plots are nearly parallel to each other. However, at the higher temperatures there is little strain hardening effects. In fact, this strain hardening effect decreases with the increase in temperature, in particular to the test at 115°C since this is about 10°C above the material’s Tg. Also, the hardening effects at 75°C and 115°C appears to develop at much higher strains.
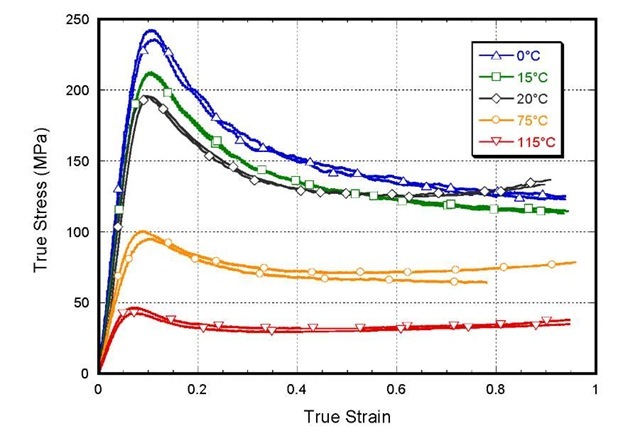
For the intermediate strain rate experiments under similar temperature conditions as the quasi-static, the mechanical response of PMMA at the elevated temperatures are almost the same as the quasi-static experiments. The main deviation is that the strain softening is much more dominant at the room and lower temperatures due to some adiabatic heating. There is no strain hardening effects at 0°C and 15°C. Interestingly is that strain hardening is present for room temperature result and thus the stress-strain crosses over the low temperature experiments. It is not like the quasi-static where the plots are parallel. Although the flow stresses have increased in comparison to the higher temperature test, the expected response for most glassy polymer would be a brittle like behavior. This shows that there are more adiabatic effects due to an increase in the loading rate even for these polymers tested at the lower temperatures. Furthermore, relative to the corresponding temperatures, there is an increase in the flow stresses between the quasi-static and intermediate experiments.
It is anticipated that there is greater adiabatic effects at higher loading rates. The lowest strain rate in the SHPB experiments for this effort is about 1300/s. For all of these high rate experiments, the specimen has either developed visible cracks (3400/s) or complete failure into smaller debris that appears to have melted and fused back together (4300/s). Yet for all the low rate experiments, no specimen failure occurred. Further study requires experiments to be conducted at other strain rates (i.e. 102/s and 100/s) to determine a failure threshold and measuring the adiabatic temperature rises during these loading rates.
Figure 7. Stress-Strain Responses of PMMA at High and Low Temperature Conducted at 0.001/s Strain Rate
Figure 8. Stress-Strain Responses of PMMA at High and Low Temperature Conducted at 1/s Strain Rate
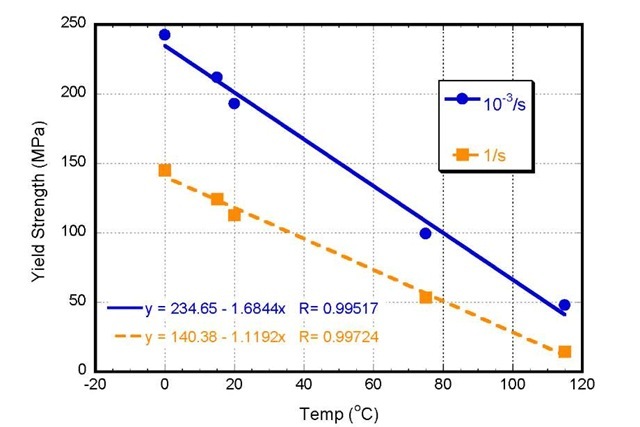
Figure 9. Yield Strengths as a Function of Temperature and Strain Rate
A plot of the yield strength as a function of test temperature for PMMA compression experiments conducted at 0.001/s and 1/s is shown in Figure 9. As stated earlier, none of the compressed PMMA samples showed any cracks. The result of this plot emphasizes that adiabatic heating is quite dominant at the intermediate strain rate in comparison to the quasi-static. There is a significant decrease of the yield strengths for the corresponding temperatures. The linear fit between the two strain rates diverges as the lower temperatures. However, it is unclear if this trend continues below 0°C.
SUMMARY
The mechanical response of PMMA was determined for strain rate and temperature effects. By stress pulse-shaping the incident pulse, a near constant strain rate controlled experiments can be achieved resulting in valid results from high rate Hopkinson experiments. The outcome of the compression Hopkinson bar experiments of the PMMA material resulted in lower strains to failure with different fracture modes as the strain rate is increased. In addition, the apparent modulus and yield strength increase with increasing strain rate. Finally, adiabatic thermal softening is evident at strain rate of 1/s in comparison to rates at 10-4/s and 10-3/s even at the lower temperatures. For the higher temperature experiments, PMMA strain hardens at much higher strains than for room and low temperature conditions. Further study requires experiments to be conducted at the 102/s to determine a failure threshold and the ability to accurately measure the adiabatic temperatures during these loading rates. Experimental data are being used to develop constitutive model for the PMMA.


