Dynamic Constitutive Behavior of the Face-sheet
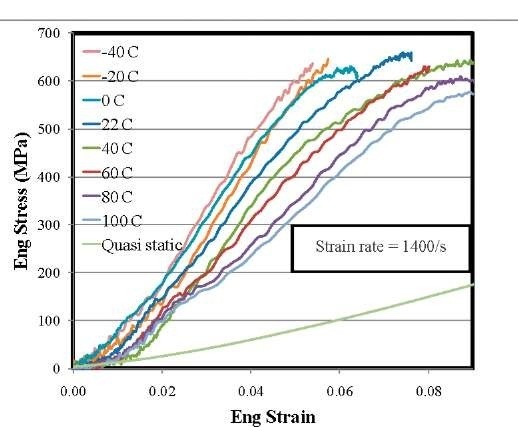
Dynamic constitutive behavior of the face-sheet under quasi-static and high strain rate loading is shown in fig. 6. The compressive modulus for quasi-static loading is 2.6 GPa. As the fibers in the specimen are running in transverse direction, the compressive properties are moderated by the resin, which results into a relative lower value of compressive modulus as compared to young modulus of E-glass fibers. As the temperature is increases from -40°C to 100°C, a decrease in the stress-strain curve is observed.
Fig. 6 Quasi-static and dynamic behavior of face-sheet under low and high temperature
The young modulus of resin is highly dependent on the temperature and a decrease in compressive modulus under dynamic testing can be explained by the decrease in young modulus of the resin used in manufacturing of face-sheets.
Response of Sandwich Composites under Room, Low and High temperature:
Real Time Deformation
Fig. 7 Real Time Deformation at Room Temperature (22°C at core)
Fig. 8 Real Time Deformation at Low Temperature (-65°C at core)
Fig. 9 Real Time Deformation at High Temperature (80°C at core)
The real time observation of the transient behavior of sandwich composites under shock wave loading at low temperature ( -65°C ), room temperature (22°C) and high temperature (80°C) are shown in figs. 7, 8 and 9 respectively. The shock wave propagated from the right side of the image to the left side and some detailed deformation mechanisms were pointed out in the figures.
As shown in fig. 7, at room temperature environment, the sandwich composite exhibits no visible failure during the event. At 200 ^s, the stress wave has propagated inside the specimen and both front and back faces of the specimen start to deform under blast loading. At t = 400 ^s, the core material starts compressing and by t = 750 ^s, specimen core is compressed by 5% in the lower part of the supports. The core material stops compressing after t = 1350 ^s and a maximum of 9% strain is observed in the core. The specimen deforms in a double wing shape and no global bending response is observed.
Fig. 8 shows the blast loading response of a sandwich composite subjected to a low temperature environment. The core material temperature is -65°C. At t = 300 ^s, primary core cracks are formed around the perimeter of loading area. The lower crack initiates from the front face, while the upper crack is initiated from the back face. The crack formation is followed by the skin delamination from front and back face in the lower and upper part of the specimen respectively. The secondary core cracks are visible at t = 750 ^s, and the specimen deformation behavior changes from double wing to global bending. This allows for heavy slippage between the core and face-sheet, which results into the formation of other secondary cracks. At 1600 ^s, the skin delamination on the top of the back face can be observed. During the whole blast event, there is no core compression observed, which clearly demonstrates the core-hardening at low temperature environments.
The blast response of a sandwich composite with a core temperature of 80°C is shown in fig. 9. The core compression starts at t = 300 ^s and the centre of the core is compressed by 6% by t = 600 ^s. The bending of grid lines close to the back face shows the presence of shear stresses in the core materials near the face-sheets. The core compression increases with time and at t = 1350 ^s, the core is compressed more than 30% at the center. Following the core compression, local failure of the front face-sheet is observed at t = 1350 ^s, which results in the local deformation of the core material in the central area.
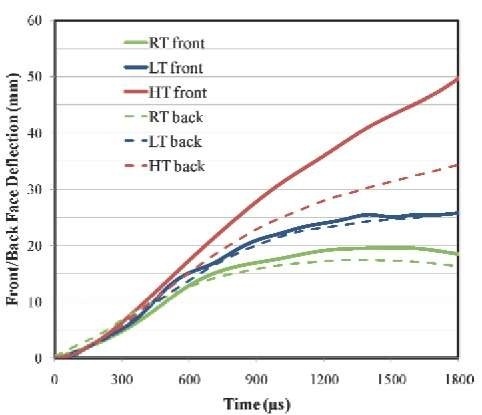
Fig. 10 Front and Back face deflection curves for room, low and high temperature
Deflection
The mid-point deflection in the front and back faces, at the center point under different temperature environments were obtained from high speed side-view images and are shown in fig. 10. Comparing the back face deflections at t = 1200 ^s, the sandwich specimen at room temperature deflected 17 mm, while the deflection for the specimen tested under low and high temperature environment is 23 mm and 28 mm respectively. Therefore, it can be observed that the deflection of sandwich panel under low temperature is 35% more than as compared to room temperature experiments. Also, the high temperature specimen has 65% more back face deflection than at room temperature. The front face deflections are also plotted in fig. 10 to compare the amount of core compression observed during the blast testing. The core compression and compressive strain at the center of the specimen at t = 1200 ^s are listed in table 2. Under low temperature, the core compression is less as compared to room temperature, which depicts the increase in yield strength of the core material under low temperature environments. At high temperature, the thermal softening of foam and the local failure of the face-sheets allows for more core compression, which results into a compressive strain of 31.5% at the center of the specimen.
|
Core Compression |
Compressive Strain |
|
|
|
(mm) |
(%) |
|
Room Temperature |
1.89 mm |
7.5% |
|
Low Temperature |
0.82 mm |
3.2% |
|
High Temperature |
8.00 mm |
31.5% |
Table 2 Core compression and compressive strain at time t = 1200 s
Digital Image Correlation (DIC) Analysis
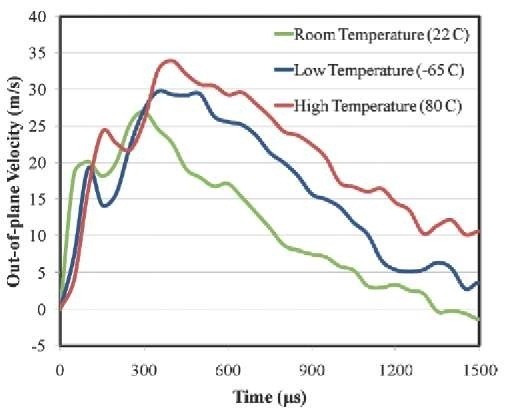
Shown in fig. 11 and 12, the real time response of the sandwich composites was generated using Digital Image Correlation (DIC). Through DIC analysis, the out-of-plane deflection and velocity during the entire blast event was extracted. The out-of-plane velocity on the back face of the sandwich specimen is plotted in fig. 11. Under room temperature, at t = 300 ^s, the specimen reaches a maximum velocity of 25 m/s and it begins to decelerate later in time. A maximum velocity of 30 m/s and 34 m/s is observed in low and high temperature experiments respectively at approximately t = 350 ^s. Therefore, low and high temperature experiments exhibit higher maximum velocities, but the time taken to reach maximum velocity is delayed by 50 ^s. At t = 1300 ^s, the room temperature experiment reaches the maximum deflection and starts reverberating, which is shown by the negative velocities after this time. Compared to the low and high temperature experiments, the specimen is still undergoing deformation with velocities of 5 m/s and 10 m/s respectively at t = 1300 ^s.
Fig. 11 Out-of-plane velocity on the back face for room, low and high temperature
Fig. 12 shows the full-field back face deflection for high temperature experiment. By t = 1800 ^s, the deflection at the midpoint of the back face is 35 mm, which is the same as the deflection of the back face calculated from the side-view images.
Fig. 12 Full field back view for high temperature experiment
Post-mortem Analysis
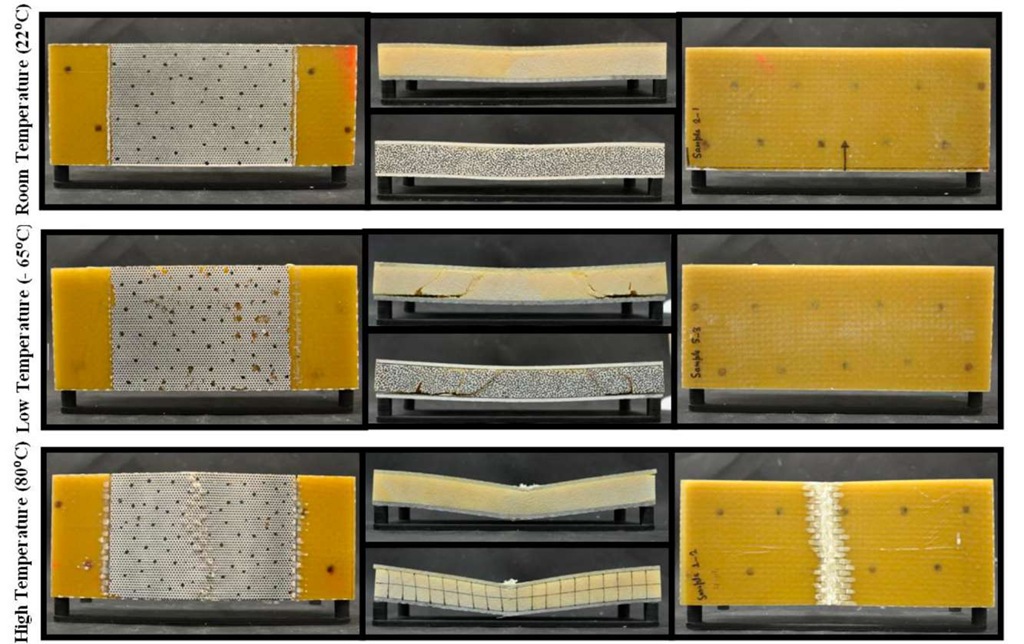
After the blast event occurred, the damage patterns in the sandwich specimens were visually examined and recorded using a high resolution digital camera and are shown in fig. 13. When the sandwich specimen was subjected to shock wave loading under room temperature, the specimen shows a maximum deflection of 2.5 mm and there is no evidence of permanent damage inside core and face-sheet. When the sandwich specimen was subjected to shock wave loading under low temperature, the damage is confined to the places where the supports are located in the shock loading and a significant amount of core-cracking was observed. The core-cracks propagated completely through the foam core and a large amount of skin delamination between the core and the back face-sheet was observed. No specific damage in face-sheets and core compression is visible, and the specimen shows a deflection of 5.5 mm at center. In the high temperature environment, excessive fiber matrix delamination and fiber breakage was seen confined to the center of the shock wave loading. The fiber matrix delamination can be attributed to low heat distortion temperatures of the resin used in preparation of the face-sheets. The heat distortion temperature for Ashland Derakane Momentum is 82°C, which is very close to the test temperature of the high temperature experiments performed. The center point of the specimen has a deflection of 17.8 mm and a core compression behind the local failure of face-sheet is also evident from images.
Fig. 13 Visual inspection of sandwich specimens after being subjected to blast loading
SUMMARY
a) Under dynamic testing, M100 foam shows thermal softening and the flow stress value decreases with an increase in temperature upto 100°C. At low temperature, foam has a brittle nature due to hardening and the plateau region shows a decreasing stress value with increasing strain.
b) The sandwich specimens were subjected to blast loading at room temperature (22°C), low temperature (65°C) and high temperature (80°C). The sandwich specimen under low temperature demonstrated around 30% more back-face deflection with respect to room temperature and the main failure mechanisms observed are core-cracking and skin delamination. At high temperature, a significant amount of fiber breakage and fiber matrix delamination occurs due to the low tolerance of polymer resin for high temperatures, used in preparation of the sandwich specimens.


