INTRODUCTION
Since the 1950s, the designers of training systems have embraced the logical and deliberate methodology of the Analyze, Design, Develop, Implement, and Evaluate (ADDIE) Model in one form or another (Figure 1) (Dick, Carey, & Carey, 2001; Sugrue, 2003).
The inherent linear design of this model perpetuates thinking that a single input leads to a single output. Each phase has specific associated tasks dependent on the phase preceding it. The conceptual model is extremely linear in execution, albeit, ideally, the activities should be interwoven (Smith & Ragan, 1999). The traditional model implies terminality.
One cannot refute the efforts or the products, but given the rapid advancement of technology and the complexity of performance systems, it is time to question the success of time-intensive approaches based on the classic models (Foshay, 1995; Myers, 1999; Wallace, Hybert, Smith, & Blecke, 2003).
The Need for New Models
The field of instructional design (ID) recognizes that no one instructional strategy or approach fits all ID situations. Why then would designers accept or advocate that one design model fits all? As we learn more about how people learn, how information is reconstructed in new situations, and how technology applications can replace outdated instructional strategies, the need for a variety of models becomes readily apparent. Product improvement (training) is gained through a radical departure from current modes or methodologies (Hammer & Champy, 1993).
Figure 1. Classic ADDIE model
Advancements in computer technology, multimedia, and telecommunications probably have the greatest impact on design, development, and distribution of content. Before a production group can create and develop an idea, conduct a prototype program, and evaluate its effectiveness, the content has changed. A business model must address how an integrated production team can design and produce quality products in fluid environments.
THE QFD PRODUCT DEVELOPMENT MODEL
Quality Function Deployment (QFD) has its roots in manufacturing as a design quality tool. Akao (1990) first conceptualized QFD in 1966 as an approach to new product development and concurrent engineering where customer requirements were integrated into product design. Hauser and Clausing brought QFD into the mainstream ofthe quality movement in the United States in 1988. They coined “House of Quality” to describe the modular building process for the QFD matrix in a manner similar to adding features to a house (Hauser & Clausing, 1988). Since its inception, QFD has been utilized worldwide in almost every industry to prioritize customer needs and wants, translate needs into actions, and to build a product that considers customer satisfaction and business goals (QFD Institute, 2004).
In competitive market environments, a successful product is perceived by the customer as being of high quality. This quality imperative compels producers to make every effort to make their product possess the customer-desired attributes. QFD is an analytic technique that dynamically links and integrates stakeholder needs, system requirements, and design considerations. QFD also helps designers correlate and identify tradeoffs between the different design elements and insures that all stakeholder needs are met. The result is a product that can be efficiently and cost-effectively produced, while fully satisfying the customer.
The Stakeholder as the Key to Success
Key to producing a high-quality training product is the ability of the ID process to recognize and accommodate stakeholder needs (Ledgard & Taylor, 2004). These stakeholders are usually the learners, the department charged with the training mission, and the company that is the work environment of the learners.
The first stakeholder is the individual who acquires the skills and capabilities to perform the job within the operational system and environment. This stakeholder expects a “doable” and effective training environment and training that can be accomplished in a reasonable timeframe and that equips him or her with skills necessary to achieve success in the “real world.”
The second stakeholder is the training system management that has responsibility for developing the requisite level of competencies to enable the learners to perform the jobs.
The third stakeholder is the organization. This is the employee’s company that benefits from the successful implementation of the training.
Each stakeholder has a unique set of needs and expectations that must be addressed in the design effort. The following process description demonstrates how stakeholder needs can be identified, integrated into the design process, and tracked through the development process.
THE QFD PROCESS
The Quality Function Deployment technique is a graphic-based process using one or more matrices that show the relationships between stakeholder requirements and various design elements. The QFD process is flexible and encourages innovative thinking to tackle the many problems encountered with designing an instructional product that satisfies all the stakeholders. The process is adaptable for any situation.
Step 1: Identifying Stakeholder Requirements and Instructional Imperatives
The QFD process begins with the “voice of the customer” (Crow, 2004), that is, the identification of the stakeholder needs and requirements. These requirements are stated simply and represent the stakeholders’ desired attributes of the instructional product. This first step includes the following actions:
• Identify instructional imperatives (such as strategies, delivery methods, or constraints) that accommodate the stakeholder requirements;
• Generate stakeholder requirements and instructional imperatives by brainstorming or some similar approach.
Step 1 requires that designers maintain a stakeholder focus throughout the process.
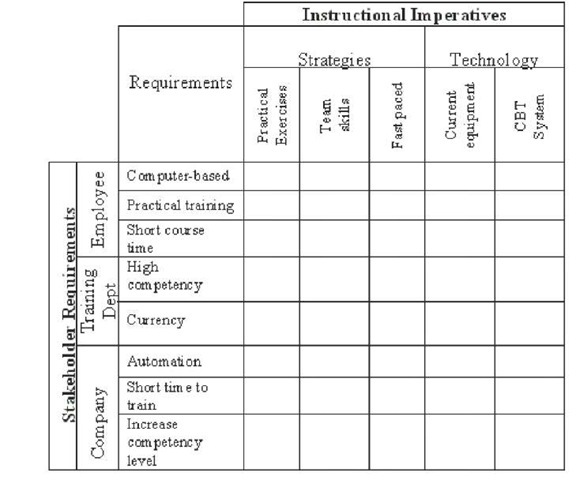
The initial matrix, as illustrated in Figure 2, consists of stakeholder requirements listed down the left side as row labels, and the instructional imperatives listed across the top as column headings. The cells in the body of the matrix will complete a relational analysis in Step 2.
Figure 2. Basic starting QFD matrix
General Guidelines for Step 1
1. For each listed requirement, identify at least one instructional imperative that satisfies the requirement.
2. More than one imperative can accommodate a requirement and a single imperative may accommodate multiple requirements.
3. Every requirement is accommodated by at least one imperative.
4. An instructional imperative may stand alone as a needed design consideration not related to a specific requirement.
During Step 1 designers conduct a detailed analysis of the relationships between the stakeholder requirements and instructional imperatives identified in Step 2.
Figure 3 depicts the basic initial matrix with decomposed row and column categories to better represent the different needs and requirements for the different stakeholders.
In a similar manner, the instructional imperatives can be further classified (see Figure 4). Since the instructional imperatives are identified to accommodate stakeholder requirements, the imperatives are organized by instructional considerations such as instructional strategies, technologies, and the like.
Figure 3. Decomposed stakeholder requirements
Figure 4. Decomposed instructional imperatives
An Example Illustrating Step 1 Analysis
Assume a training department for an aviation maintenance company is reengineering an engine repair course. A learner analysis has been conducted and the top three needs identified by the learners (entry-level mechanics) are computer-facilitated lessons, practical exercises with actual equipment, and short course duration. The maintenance managers want skilled technicians familiar with the equipment used on the job. Finally, the company’s front office wants to automate the course as much as possible to reduce costs, minimize training time, and attain higher achieved competency levels. This information yields the matrix shown in Figure 5.
Technology is a clear imperative in this case. Instructional strategies designed to provide realistic training, to teach team troubleshooting and problem solving, and to reduce training time are indicated.
Step 2: Assess Relationships Between Stakeholder Requirements and Instructional Imperatives
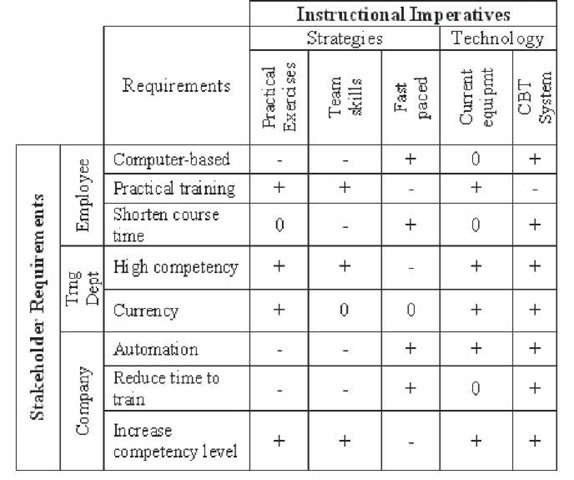
Once the stakeholder requirements and instructional imperatives are identified, the designer assesses the nature and strength of relationships between requirements and imperatives. The designer identifies specific links between the stakeholder requirements and instructional imperatives and determines the importance of each instructional imperative to the different requirements. The assessment result helps prioritize the instructional imperatives and trade-off analyses later in the process Following this initial assessment, the relationships are assessed by assigning a measure of correlation to each cell formed by the intersection of the imperative column and the requirements row. In the simplest form, the correlation measure is indicated by symbols such as a “+” for a positive relationship where the imperative is needed for the requirement, a “0″ for no relationship between an imperative and a particular requirement, and a “-” for a negative relationship where an imperative may interfere with satisfying a requirement. When quantitative data are available, actual correlation values can be calculated and inserted into the cells.
Figure 5. Sample matrix
The Example Continued through Step 2
Working through the previous matrix shown in Figure 5 might yield the result shown in Figure 6.
The relationship indicators in the matrix cells reveal that some imperatives are needed for some stakeholder requirements, not needed for others, and might be detrimental for some. Every requirement is supported by at least two imperatives, as indicated by the “+,” but every requirement also has at least one imperative that might interfere, as indicated by the “-.” Other observations might include that the use of computer- based training (CBT) as an instructional imperative supports the most requirements, that teaching team skills might be most problematic, and that using current equipment will not negatively affect any requirement. Such a relational analysis helps the designer “see” the big picture, identify conflicts and problems, and point to critical instructional imperatives.
Step 3: Examining Relationships among Instructional Imperatives
This step and the remaining steps are optional. Some applications of the QFD involve steps or aspects not addressed here. Additional steps are analytical and employed to achieve specific purposes depending on the situation.
Once instructional imperatives are identified, it is often helpful to examine the relationships, if any, among the imperatives. In the latter stages of a project, decisions to eliminate non-essential imperatives can be better supported when all the relationships between the imperatives are understood. This can preclude eliminating an imperative that is critically linked to an essential imperative and that would diminish the effectiveness of the essential imperative if it is eliminated.
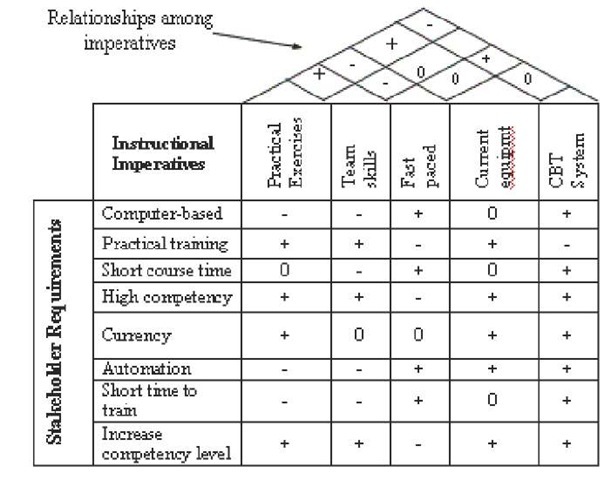
The partial matrix shown in Figure 7 provides an example of one approach to a relational analysis among instructional imperatives. The “roof” of the “house of quality” matrix shows the evaluated relationships between each pair of imperatives, using the simple method of indicating a positive relationship with a “+,”no relationship with a “0,” and a negative relationship with a “-.”
Figure 6. QFD matrix with correlations
Figure 7. Partial QFD matrix showing relationships between imperatives
In this example, team skills and practical exercises are positively related. If a decision is made to eliminate practical exercises, then team skills will likely suffer. The designer has identified a negative relationship between practical exercises and fast-paced instruction, indicating that if practical exercises are not included in the instruction, the time to train might be speeded up in this situation.
At this point, the QFD matrix tracks the accommodation of the stakeholder requirements with various instructional approaches and shows potential trade-off implications in determining the optimal instructional mix.
Step 4: Evaluating Stakeholder Needs and Requirements
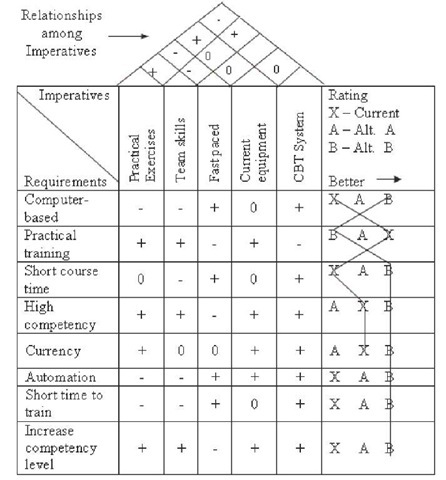
The fourth step evaluates how the existing system is accommodating the stakeholder requirements and how competing designs may or may not be accommodating the requirements. In terms of the matrix, the designer creates a “porch” with a column on the right of the matrix that registers a rating scheme that evaluates an existing system or compares the existing system to other alternatives. Figure 8 demonstrates this process.
In this example, the designer evaluates how well each of three alternatives satisfies each requirement.
A simple rank-order method ranks each alternative in relation to the others. These comparative evaluations can be very sophisticated based on the nature and extent of data collected for the evaluation. Numerical scales, like Likert scales or “snake” diagrams, can be used as well if the rating data can be quantified. In this example, it appears that Option B best accommodates all the requirements but one. Such evaluations allow decision makers to compare alternative systems at a glance.
Step 5: Value Analysis of Instructional Imperatives
Each instructional imperative included in the training product has a value such as cost, return on investment, time to train impact, and so forth. A cost figure or some other value or factor representation can be calculated for each imperative. This valuation is normally displayed in the “basement” of the house as shown in Figure 9.
The designer develops a dollar figure for the implementation of each instructional imperative. The value analysis indicates that if all imperatives are implemented, the total cost would be $2,300,000. Additionally, the relative cost of each imperative can be easily seen. This figure becomes the baseline for efforts to reduce costs while accommodating the stakeholder requirements.
expanding the matrix models
The QFD Matrix can be tailored to any variety of analytical needs. For more complex situations, separate matrices can be developed for the different elements being considered to keep the matrices manageable. In complex systems, a single category of stakeholder requirements may generate a matrix with hundreds of requirement-imperative combinations. Separate matrices can be developed for each category of stakeholder. Likewise, a separate matrix can be created for each category of instructional imperative. For example, technology issues are usually complex and may be best handled by creating a technology matrix to develop the optimal configuration of echnology characteristics that best accommodates stakeholder requirements related to technology.
Figure 8. QFD matrix with stakeholder requirements evaluation section
Figure 9. QFD matrix with value analysis for instructional imperatives
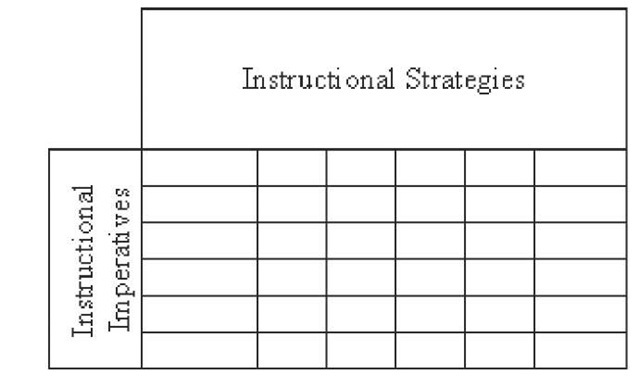
Figure 10. Instructional imperative – strategies matrix
Follow-On Matrices
So far, the matrices representing the relationship between stakeholder requirements and instructional imperatives have been examined. Once the instructional imperatives have been selected, a new matrix is created with the instructional imperatives listed as the rows and specific instructional strategies listed as the columns, as shown in Figure 10.
If needed, another matrix is created with specific instructional strategies listed as the rows, and the requisite instructional tools and design elements listed as columns. Yet another matrix might be set up for examining the relationships between instructional and learner strategies. Each follow-on matrix is constructed in the form that supports the analytic goals.
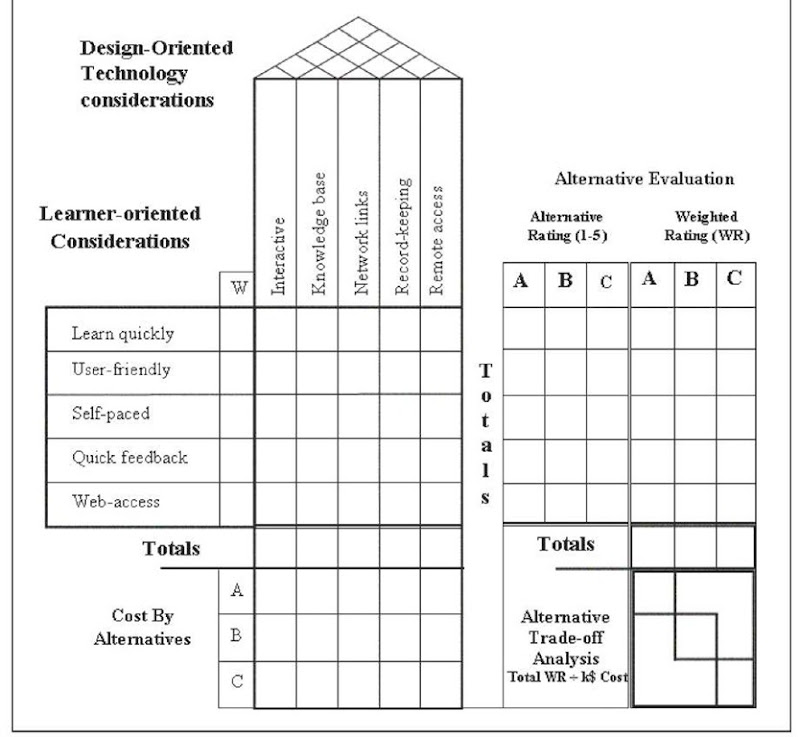
Figure 12 demonstrates another variation of the QFD matrix. This matrix evaluates tradeoffs among technology considerations in the context of comparing three competing systems. The ultimate outcome is a quantified cost factor for each alternative weighted by the importance of the learner requirement and the relative quality score for each alternative.
Current Methodology vs. The QFD Model
A weakness of many of the current ID methodologies for developing instructional products is the tendency to allow design to drive the product rather than the stakeholder needs and requirements. Only by starting with the stakeholder needs and requirements, basing the design on these needs and requirements, and tracking the needs and requirements throughout the design process, will the instructional product succeed. QFD is a simple, flexible, and easy to manage procedure that visually displays the design structure and tracks the accommodation of the stakeholders’ needs and requirements.
Figure 11. Instructional strategies – tools matrix
FUTURE TRENDS
Technology is a cornerstone component of businesses today. In the future, more and more businesses will use technology within the training arena to reduce costs and deploy employee training any time, any where. However, succe ssful technology deployment will occur when businesses approach technology-based training with the same critical eye used to make other business decisions. Incorporating business models with instructional design models will continue to grow and gain acceptance.
CONCLUSION
From a business perspective, “learning enables an individual or groups of individuals to work faster, better, and smarter so they and their organizations reap business benefits” (Rosenberg, 2001, p. 4). The Quality Function Deployment model is one ID model that demonstrates its usefulness within the training design and development arena. This model and supporting practice also suggest that business and training development should go hand-in-hand.
What is needed in the realm of learning technology for large systems is an integrated approach that views training design and development processes from a business perspective. Training departments that utilize ingenious methods to embed technology appropriately provide their companies with a significant competitive advantage (Noe, 2005). By examining the best practices of both worlds and building upon those methodologies, we can improve the business of training development thereby improving effectiveness for the learner and reducing costs to the bottom line.
Figure 12. Technology allocation matrix
KEY TERMS
Concurrent Engineering: An integrated team approach (e.g., design, production, and marketing departments) to producing and selling either a service or tangible good.
House of Quality: A model that describes the modular building process for the QFD matrix in a manner similar to adding features to a house (Hauser & Clausing, 1988).
Instructional Design: A framework for instructional decision making derived from learning theory, educational psychology, and best practices (Rossett, 2003).
Instructional Imperatives: Any training or business requirement, such as strategies, delivery methods, or constraints that accommodate the stakeholder requirement.
Quality Function Deployment: A manufacturing quality design approach in new product development where customer requirements are integrated into product design (Akao, 1990).
Stakeholders: Those individuals or groups who have ownership and derive benefit from the training system.
Training System: An organizational system with the primary mission of training employees to improve performance.


