Tools for Investigation and Diagnostics
As stated before, specific scientific investigations can be conducted directly on the digital 3D model. In the David restoration project (2003-2004) [43], the authors performed two main “digital” investigations: the characterization of the surface exposure with respect to the fall of contaminants, and the computation of a number of physical measures [44]. In both cases, ad-hoc software tools were implemented to process the data produced and to present the results to the users.
Surface Exposure Characterization
A tool to evaluate the exposure of the David’s surface to the fall of contaminants (e.g., fall of rain, mist or dust) was designed and implemented. The phenomenon depends on: the direction of fall of the contaminant, the surface slope, the self-occlusion, and the accessibility of the different surface parcels. The tool produces several qualitative and quantitative results, useful to characterize the artwork surface. The falling directions of the contaminant agents were modeled by assuming a random fall direction, uniformly distributed around the vertical axis of the statue within an angle a which defines the maximum fall inclination. Figure 2.19 shows some of the results obtained on the David. The different exposures are visualized using a false-color ramp; the digital 3D model is therefore used both to compute the simulation and to present visually the results. Numeric data have also been produced (tables and graphs) [43, 44].
Physical Measures
Physical measures can be computed directly on the digital 3D model (e.g., David’s surface: 19.47 squared meters; or its volume: 2.098 cubic meters). Knowing the unit weight of the artwork material, the total weight can be immediately computed from the volume measure. Point-to-point distances are also often needed, and can be simply computed on the 3D model by adding a linear measuring feature to the browser used to visualize the digital model. A linear measuring feature is included in several geometric modeling tools. One of the most specific for the treatment of geometric data coming from 3D scanning is the MeshLab [19,41] tool (developed by the authors and freely available under the GPL license). In this tool the user simply selects two points on David’s surface to compute the linear distance between those two points.
FIGURE 2.20
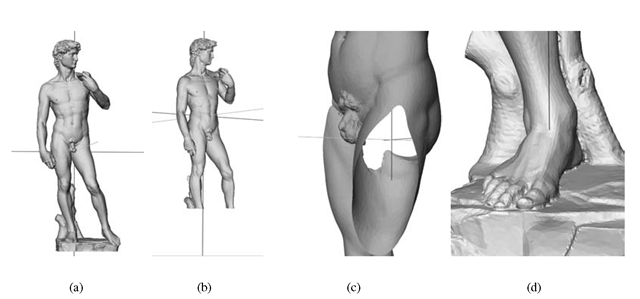
Spatial location of David’s barycentre: (a) with and (b) without basement and feet; zoomed images of the former in (c) and (d).
FIGURE 2.21
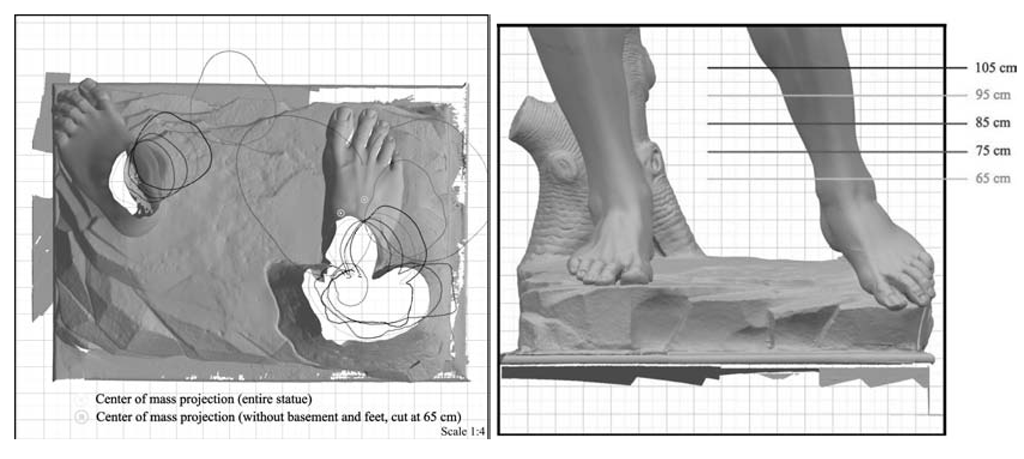
Visualization of the projection of the center of mass (marked by a yellow circle) and of the profiles of some cut-through sections (ankles, knees, and groin; see the respective height of those cut-through sections in the right-most image).
FIGURE 2.22
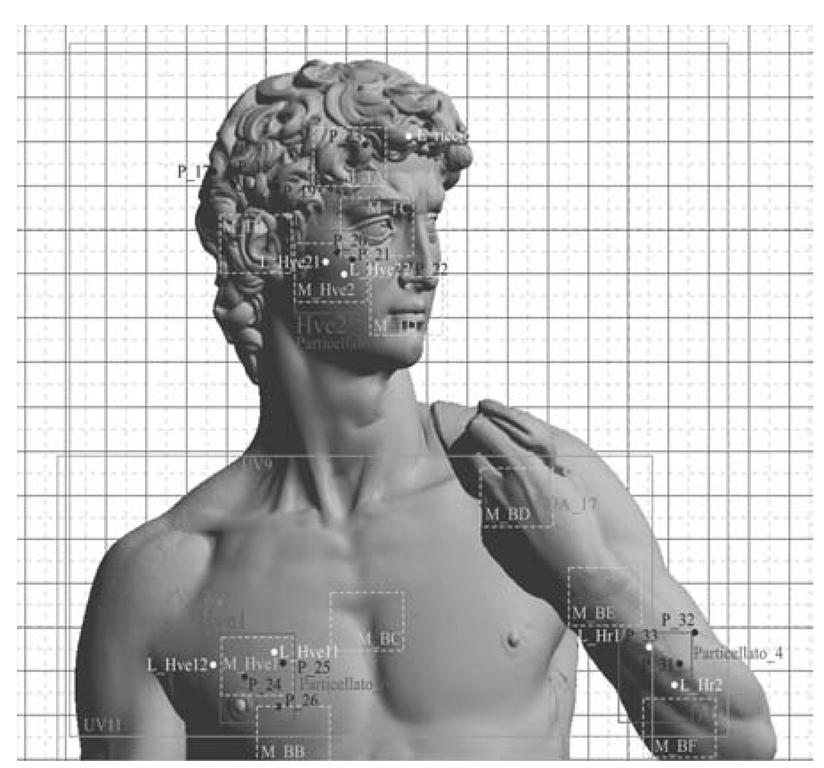
The digital model is used as an index to the scientific investigations performed on selected points or on subregions of the statue’s surface.
One of the issues evaluated in David’s restoration was the static of the statue, since some cracks on the back of the ankles worried the curators. These cracks could have been generated by a wrong distribution of the mass of the statue, since there are historical papers which sustain that the original basement (up to the mid nineteenth century) was not properly planar and that the statue was slanting forward. Therefore, an investigation on the statics of the statue was done during the last restoration project. The basic data for the static investigation are the mass properties (volume, center of mass, and the moments and products of inertia of the center of mass), which were computed directly on the digital 3D model using an algorithm that exploits an integration of the whole volume assuming constant density of the mass [47]. From this computation, the obtained center of mass of the statue was placed in the interior of the groin, approximately in the pelvis (see a visualization in Figure 2.20). The vertical projection of the center of mass on the base of the statue (i.e., the sculptured rocky base where the David stands) is the blue line, which exits from the marble on the high posterior part of the left thigh and enters again in the marble on the right foot. The center of mass was estimated also after the digital removal of the basement (cutting the statue at the height of the main cracks); the new position is shown again in Figure 2.20. The projection of the center of mass on the statue base was documented with a large size plot (see Figure 2.21) produced by an application [48] designed to support the easy production of large format prints (orthographic drawings and cut-through sections, rendered according to the user-selected reproduction scale) from very high resolution digital models produced with 3D scanning technology.
It’s important to underline here that the results presented in this subsection were produced around six years ago by writing specific small software components. Nowadays, most of those computations can be easily performed by using in a coordinated manner one or multiple features or filters of the above-mentioned MeshLab system.
FIGURE 2.23
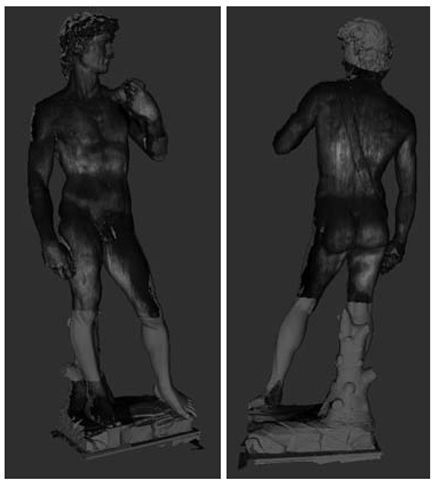
Mapping multiple UV images on the digital 3D model.
Tools Supporting Knowledge Management
A second important use for digital 3D models is to consider them as an instrument to document, organize, and present the restoration data. During the David restoration campaign, a number of scientific investigations were performed; some of them will be repeated periodically, in order to monitor the status of the statue. These investigations include: different chemical analysis (to find evidence of organic and inorganic substances on the surface of the statue), petrographic and colorimetric characterization of the marble, UV imaging, X-ray, etc. All the results produced by the scientific investigations can be organized and made accessible using the 3D models as the integration medium. The 3D model of the David can be used to build different spatial indexes to those data (see Figure 2.22), pointing out their location on the surface of the statue and supporting hyperlinks to web pages describing the corresponding investigation and the results obtained. Specific features for linking or mapping multimedia data on a digital 3D model should be therefore supported by a 3D browser oriented to CH applications. Some works have been done in the CH domain to adopt or configure GIS technology to the specific needs of CH management. This has produced some specific systems, based on a 2D or 2.5D representation, that can represent the domain of interest (e.g., a 2D map or a 2D photo representing a portion of an architecture) and map it selectively on those space all the information available [49], following the GIS approach. Another option is to design new 3D browsers, by giving to the user the ability to create all the links required to connect the 3D representation with the multimedia info and the documents of interest. This entails being able to: store in a repository the set of links introduced on the 3D model and all the related documents; support selective visualization of the 3D model and of the set of links (which can be point-wise or based on the selection of a region). Coming back to the David diagnostic analysis, some of them produced image-based results, which can be directly mapped on the statue surface and presented in an integrated manner. An example is the case of the ultraviolet (UV) imaging investigation. Images produced under UV light are very important to give visual evidence to organic deposits on the marble surface (e.g., wax), which have to be removed with proper solvents. The UV investigation performed by the Opificio delle Pietre Dure (a renowned Italian public restoration institution) produced many 2D images taken from different viewpoints. These images can be mapped onto the 3D surface using an approach which computes the inverse projection and the camera specification from each single photograph and combines all the available photographs in a single texture map which is wrapped around the 3D geometry [48].
FIGURE 2.24
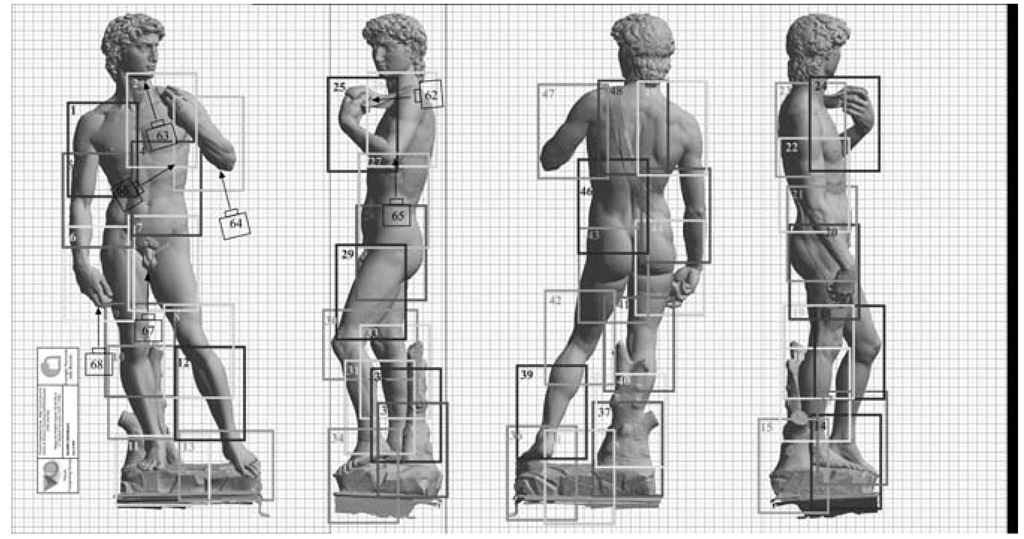
Schema of the photographic campaign, which divides the David surface in 68 photos.
In this manner, image-based information is mapped on the corresponding location of the 3D object surface and the information content of the input UV images can be inspected with the help of an interactive browser (Figure 2.23). Other important sources of data are the two high-resolution photographic surveys of the David, performed by a professional photographer with digital technology and according to specific guidelines of the restoration team. The photographic sampling was planned as shown in Figure 2.24 with the aim to document the status of the statue before and after the restoration. These RGB images can be mapped as well to the 3D mesh (see Figure 2.25) with the same methodology used for the UV images. At the time of the restoration (2003-2004) it was possible to map only a subset of the color data on a subset of the mesh (see Figure 2.25(a)); later on, the progress of multiresolution encoding schemes and of color mapping solutions allowed us to build a complete mapping of the photographic sampling on a full resolution 3D model of the David [10], and to support interactive access to that dataset by means of the Virtual Inspector tool (see Figure 2.25(b)). Moreover, the curators asked the restorers to produce detailed drawings reporting the results of a precise survey on the status of David’s surface. It was decided to manage this phase by drafting very accurate graphic annotations on the set of high-resolution photos depicting the pre-restoration status, which cover all the surface of the statue. These annotations describe in a very detailed manner:
• the imperfections of the marble (small holes or veins);
• the presence of deposits and stains (e.g., brown spots or the traces of staining rain);
• the surface consumption;
• the remaining traces of Michelangelo’s workmanship.
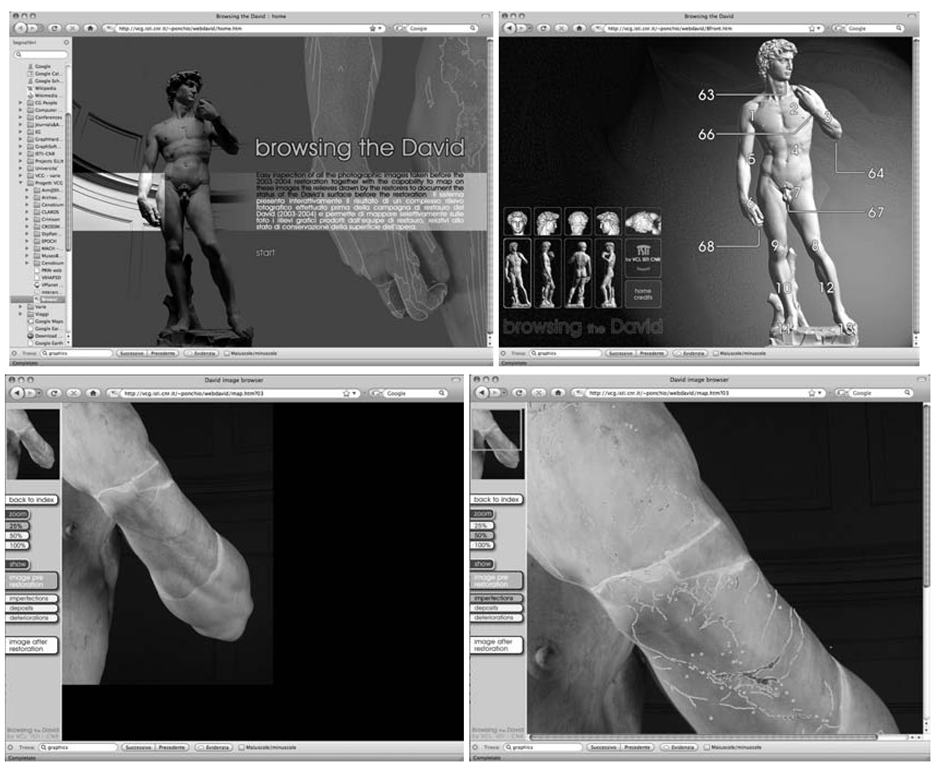
The restorers drew these annotations on transparent acetate layers positioned onto each printed photo (in A3 format). Therefore, four different graphic layers were created for each one of the sixty-eight high-resolution photos. These graphic reliefs have been scanned, registered (roto-translation+scaling) on the corresponding digital RGB image, and saved at the same resolution of the corresponding RGB image. Mapping all this image detail on the 3D model is not a good choice, since each relief has been drafted not taking into account the region of overlap with the nearby photos. Hence, after mapping all the photos on the 3D model, the overlapping regions would show different reliefs which would not be coherent on the surface of the model. Therefore, it was decided to visualize those data by following a more common 2D approach. A web-based system was implemented to browse the RGB images and to plot (in overlay) any relief layer selected by the user (see Figure 2.26). It was decided to use a 2D-based visualization approach, instead of trying to map reliefs and RGB images on the 3D surface, again due to performances reasons, ease of deployment, and data accuracy constraints. The amount of information contained in those 2D layers (each of them is a 5M pixels image) is impressive. A specific requirement of the curator was that the data (color and reliefs) should be presented at full resolution (in this case, the pixel resolution is much larger than geometric resolution of the 3D model).
FIGURE 2.25
Mapping of photographic sampling on the David’s digital model; (a) images rendered with MeshLab on the head portion, or (b) with Virtual Inspector on two complete David models with color coming from the pre- and post-restoration sampling.
In the near future, the availability of new technologies will allow one to draw similar reliefs directly on the digital skin of the 3D model. The solution, granted by the increased performances of GPUs and 3D scanning technology, is to allow the restorer to directly draw the relief on the surface of the digital model. A testbed is under implementation and evaluation during the writing of this topic in the framework of the diagnostic and pre-restoration investigation phase for the Nettuno statue (Florence, Italy). Restorers received a copy of a high-resolution model of the statue [51] in order to experiment with a pipeline where the reliefs are directly executed on the digital statue, by using the painting feature recently introduced in the MeshLab system.
FIGURE 2.26
A few snapshots from the web-based system to browse the David’s photographic campaign (pre- and post-restoration) and the restorers’ reliefs (access to the web browser is unfortunately restricted to authorized users only). The four images present (the order in which the figure are referred is Top-Left , Top-Right, Bottom-Left, Bottom-Right): the home page; one of the selection panels (the one to select the front-view images); snapshot from the presentation interface, with the image depicting the left arm shown at 25% resolution; finally, the same image, presented at 50% of its resolution and with one of the reliefs in overlay.
Conclusions
An overview of several applications of digital 3D technology in the cultural heritage framework has been presented in this topic. Even if the range of the possible uses of digital 3D models is extremely wide, according to the authors’ opinion only part of the potential of this medium and related technology have been explored until now. There is still ample space for the design of innovative tools, new processing and visualization methodologies, and, finally, for the consolidation of these new approaches in the CH domain.
As shown throughout this topic, several ongoing projects are facing the issue of designing 3D technology which could be easily adopted by CH experts, focusing on ease of use, ease of delivery, and reduced costs; one can easily predict that other innovative ideas will be surely presented in the next few years. It is possible that digital 3D models acquisition and visualization will assume, in the medium term, the same importance held nowadays by the digital photography medium in all CH contexts, from excavation to restoration, from study to musealization. Current years might be referred to, in the future, as the beginning of the digital 3D revolution in the CH domain. But reaching this goal depends not only on substantial technological progress, it will also depend on the capability to communicate and collaborate of the various communities (computer science, archaeology, history of art, restoration, chemistry, etc.) which are involved in this complex and important domain.
