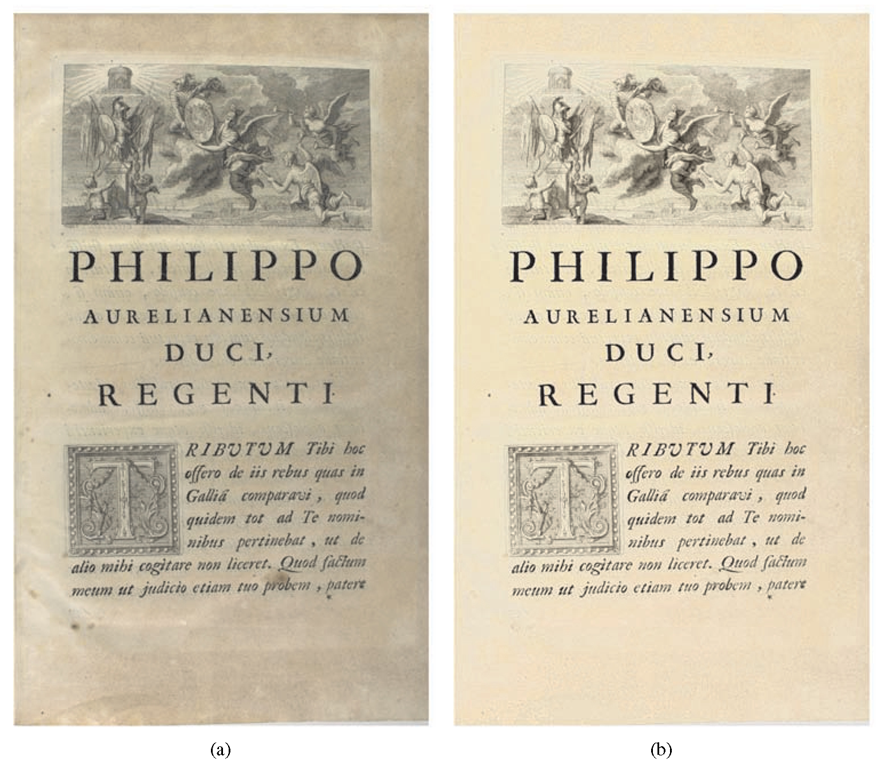
FIGURE 10.18
(a) An example of background with a variation of colors. Also a foxing stain is visible in the last line of text. (b) Image in Figure 10.18(a) after restoration.
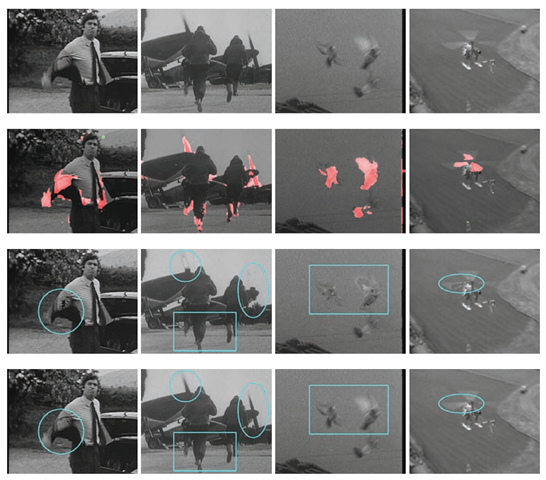
FIGURE 11.7
Top row: showing four frames from four different sequences exhibiting pathological motion. Second row from top: PM/blotch detection in red/green respectively. Third row: restoration employing standard detection without PM detection. Incorrectly reconstructed areas are highlighted in cyan. Last row: restoration with PM detection embedded in the blotch removal process. Note the better preservation of the PM regions while still rejecting blotches.
FIGURE 11.8
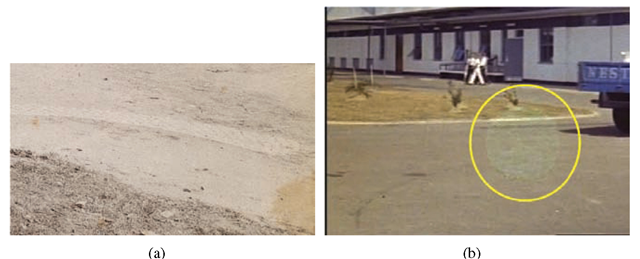
Examples of semi-transparent defects. The slightly visible semi-transparent blotch is circled in the right image.
FIGURE 12.2
Two figures from [7] demonstrate the differences between reassembling commercial jigsaw puzzles and reconstructing broken artifacts. As shown in (a), jigsaw pieces have readily identifiable corners (red dots) allowing programs to easily separate portions of the boundary (shown as different color curves) that will match with some other unique puzzle piece. Additionally, each boundary segment is a smooth planar curve having an isthmus or neck that is highly indicative for finding that unique matching puzzle piece. Figure (b) shows two hypothetical fragment boundaries. Note here that the problem is made much more difficult as corners are not easily identifiable and may not indicate the beginning or end of a curve that will uniquely match some other fragment. Worse, any portion of a boundary curve may match to any other fragment and the curve itself may match equally well with numerous similar boundaries from other fragments.
FIGURE 12.9
(a) An archaeological pot fragment excavated in Petra, Jordan. (b) A segmentation of the fragment surface in (a) from [53] obtained by dividing the surface into regions that are well approximated by a single quadratic surface patch. (b) Four quadratic surface patches indicated in orange, red, green, and brown. Blue surface points are those points that do not lie close to any of the estimated quadratic patches and typically include blemishes on the sherd surface created by calcification, chipping, and weathering. This asymmetric surface data can make automatic estimation of the vessel axis and profile curve problematic, and exclusion of these regions can greatly improve the accuracy and robustness of sherd surface estimation approaches.
FIGURE 12.12
In these modified figures from [7], we define the geometric features used by various approaches for assembly. In (a), the outer contour of the square ceramic tile, i.e., the intact boundary, Q0Uter, is shown in red; fracture boundaries, Qinner, are shown in blue; vertices, Qinner±, are shown as green points; and outer vertices, Oouter^, are shown as yellow points. Note that most automatic assembly algorithms including [8-11,22], only consider the fracture boundaries, Qinner, and perhaps the vertices, Oinner^. The black boxes in Figures (a,b) show “T” and “Y” junctions respectively that ceramics tend to generate when fractured. These junctions are typically high curvature locations along the fragment fracture boundary and are important for reconstruction as they often denote origin points for fracture boundaries that match to only one other fragment (c).
FIGURE 13.7
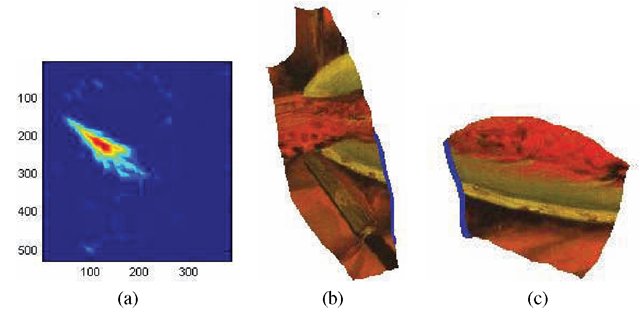
Similarity matrix (a) for the contour sequences of two fragments (b), (c). The correctly matched contour segments are shown in blue in (b), (c).
FIGURE 15.6
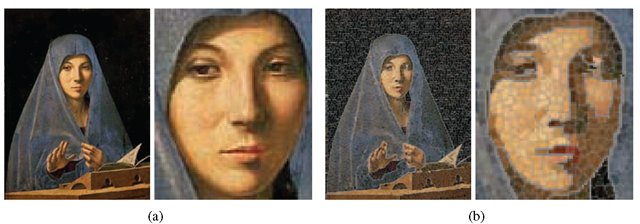
Examples of mosaics: (a) Schlechtweg et al. [39], (b) Liu et al. [32], (c) Liu et al.
FIGURE 15.7
Other examples of ancient mosaics: the original image
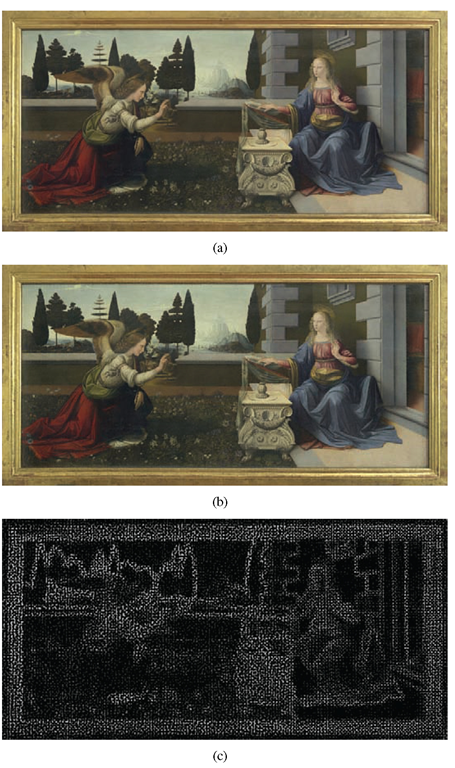
FIGURE 17.7
Leonardo da Vinci, “Annunciazione”: (a) the original image, (b) the watermarked image, (c) difference between (a) and (b) multiplied by a factor of 32.
![Two figures from [7] demonstrate the differences between reassembling commercial jigsaw puzzles and reconstructing broken artifacts. As shown in (a), jigsaw pieces have readily identifiable corners (red dots) allowing programs to easily separate portions of the boundary (shown as different color curves) that will match with some other unique puzzle piece. Additionally, each boundary segment is a smooth planar curve having an isthmus or neck that is highly indicative for finding that unique matching puzzle piece. Figure (b) shows two hypothetical fragment boundaries. Note here that the problem is made much more difficult as corners are not easily identifiable and may not indicate the beginning or end of a curve that will uniquely match some other fragment. Worse, any portion of a boundary curve may match to any other fragment and the curve itself may match equally well with numerous similar boundaries from other fragments. Two figures from [7] demonstrate the differences between reassembling commercial jigsaw puzzles and reconstructing broken artifacts. As shown in (a), jigsaw pieces have readily identifiable corners (red dots) allowing programs to easily separate portions of the boundary (shown as different color curves) that will match with some other unique puzzle piece. Additionally, each boundary segment is a smooth planar curve having an isthmus or neck that is highly indicative for finding that unique matching puzzle piece. Figure (b) shows two hypothetical fragment boundaries. Note here that the problem is made much more difficult as corners are not easily identifiable and may not indicate the beginning or end of a curve that will uniquely match some other fragment. Worse, any portion of a boundary curve may match to any other fragment and the curve itself may match equally well with numerous similar boundaries from other fragments.](http://what-when-how.com/wp-content/uploads/2012/06/tmp6ee881_thumb2222_thumb.png)
![(a) An archaeological pot fragment excavated in Petra, Jordan. (b) A segmentation of the fragment surface in (a) from [53] obtained by dividing the surface into regions that are well approximated by a single quadratic surface patch. (b) Four quadratic surface patches indicated in orange, red, green, and brown. Blue surface points are those points that do not lie close to any of the estimated quadratic patches and typically include blemishes on the sherd surface created by calcification, chipping, and weathering. This asymmetric surface data can make automatic estimation of the vessel axis and profile curve problematic, and exclusion of these regions can greatly improve the accuracy and robustness of sherd surface estimation approaches. (a) An archaeological pot fragment excavated in Petra, Jordan. (b) A segmentation of the fragment surface in (a) from [53] obtained by dividing the surface into regions that are well approximated by a single quadratic surface patch. (b) Four quadratic surface patches indicated in orange, red, green, and brown. Blue surface points are those points that do not lie close to any of the estimated quadratic patches and typically include blemishes on the sherd surface created by calcification, chipping, and weathering. This asymmetric surface data can make automatic estimation of the vessel axis and profile curve problematic, and exclusion of these regions can greatly improve the accuracy and robustness of sherd surface estimation approaches.](http://what-when-how.com/wp-content/uploads/2012/06/tmp6ee882_thumb2222_thumb.png)
![In these modified figures from [7], we define the geometric features used by various approaches for assembly. In (a), the outer contour of the square ceramic tile, i.e., the intact boundary, Q0Uter, is shown in red; fracture boundaries, Qinner, are shown in blue; vertices, Qinner±, are shown as green points; and outer vertices, Oouter^, are shown as yellow points. Note that most automatic assembly algorithms including [8-11,22], only consider the fracture boundaries, Qinner, and perhaps the vertices, Oinner^. The black boxes in Figures (a,b) show “T” and “Y” junctions respectively that ceramics tend to generate when fractured. These junctions are typically high curvature locations along the fragment fracture boundary and are important for reconstruction as they often denote origin points for fracture boundaries that match to only one other fragment (c). In these modified figures from [7], we define the geometric features used by various approaches for assembly. In (a), the outer contour of the square ceramic tile, i.e., the intact boundary, Q0Uter, is shown in red; fracture boundaries, Qinner, are shown in blue; vertices, Qinner±, are shown as green points; and outer vertices, Oouter^, are shown as yellow points. Note that most automatic assembly algorithms including [8-11,22], only consider the fracture boundaries, Qinner, and perhaps the vertices, Oinner^. The black boxes in Figures (a,b) show “T” and “Y” junctions respectively that ceramics tend to generate when fractured. These junctions are typically high curvature locations along the fragment fracture boundary and are important for reconstruction as they often denote origin points for fracture boundaries that match to only one other fragment (c).](http://what-when-how.com/wp-content/uploads/2012/06/tmp6ee883_thumb.png)
![Examples of mosaics: (a) Schlechtweg et al. [39], (b) Liu et al. [32], (c) Liu et al. Examples of mosaics: (a) Schlechtweg et al. [39], (b) Liu et al. [32], (c) Liu et al.](http://what-when-how.com/wp-content/uploads/2012/06/tmp6ee885_thumb2222_thumb.png)
