The purpose of this topic is to educate you about the options and possibilities for troubleshooting wired and wireless issues within your deployments. This also makes it easier for you to formulate a troubleshooting plan. It might even provide seasoned engineers with new options in troubleshooting their everday issues in a fresh manner.
The Wireless LAN Controller (WLC) has some diagnostic logs and tools built in it that can assist us when a potential problem arises. However, these tools alone are not comprehensive enough in most cases to fully troubleshoot many issues. In fact, the controllers do not contain nearly the amount or the caliber of information and logs that a typical IOS device contains. The controller does have features and other tools that do not exist on typical IOS devices that can make up for the differences, which this topic covers in detail.
Debugging
Debugging is one of the most common and usually initial forms of troubleshooting any network problem. Because the WLC products were acquired through a company acquisition, they obviously had a debugging system that was different from typical IOS debug commands. One of the challenges is getting used to a new list of debugs.For instance, one of the more useful debugs created in the newer 6.0 version of code is the new memory debugs that help detect a memory leak that can be initiated and applied to the WLC or the access point (AP) in question. Consider the following example of a WLC debug set:
■ config memory monitor errors {enable I disable}: Enables or disables monitoring for memory errors and leaks. Your changes are not saved across reboots. After the controller reboots, it uses the default setting for this feature. The default value is disabled.
■ config memory monitor leaks low_thresh high_thresh: Configures the controller to perform an auto-leak analysis between two memory thresholds (in kilobytes) if you suspect that a memory leak has occurred.
If the free memory is lower than the low_thresh threshold, the system crashes, generating a crash file.
The default value for this parameter is 10,000 kilobytes, and you cannot set it below this value. Set the high_thresh threshold to the current free memory level or higher so that the system enters auto-leak-analysis mode. After the free memory reaches a level lower than the specified high_thresh threshold, the process of tracking and freeing memory allocation begins. As a result, the debug memory events enable command shows all allocations and frees, and the show memory monitor detail command starts to detect any suspected memory leaks. The default value for this parameter is 30,000 kilobytes.
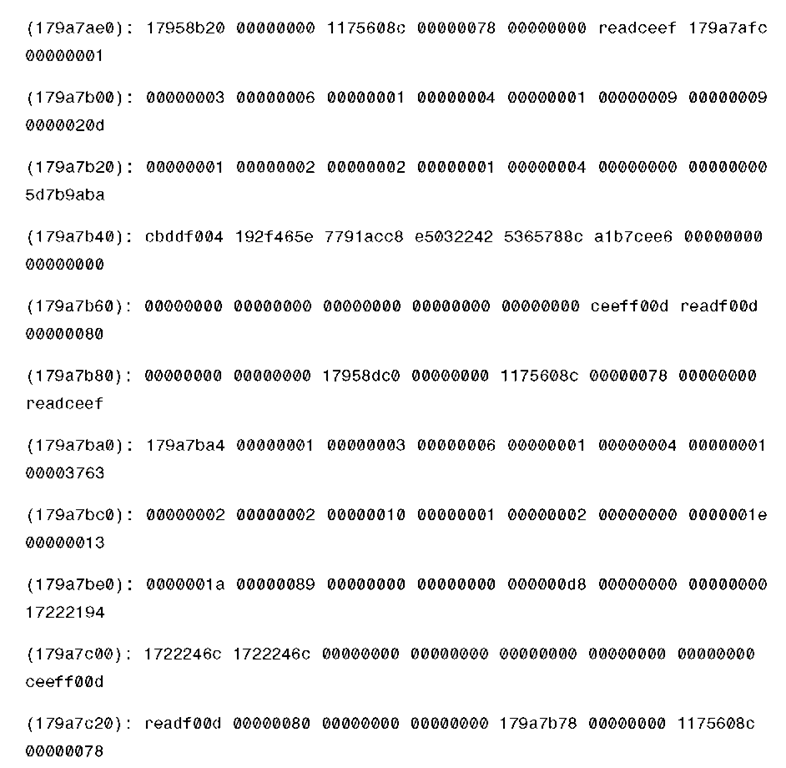
■ show memory monitor: Displays a summary of any discovered memory issues. Information similar to the following appears:
■ show memory monitor detail: Displays details of any memory leaks or corruption. Information similar to the following appears:
As far as the controller is concerned, the majority of the debugging will be done on this device. However, debugging on the AP is common also. It is best to be familiar with both devices. Debugging on the AP is called remote debugging and must be enabled because it is disabled by default. To enable the controller to send debug commands to an AP converted to lightweight mode, enter the following command:
When this command is enabled, the controller sends debug commands to the AP as character strings. You can send any debug command supported by Cisco Aironet APs that run Cisco IOS software in lightweight mode.To disable debugging on the AP, use the no debug all command.
Consider the following similar memory debugs that you can run on the AP side. If a memory leak occurs, enter the following command to enable debugging of errors or events during memory allocation:
Additional commands to display AP information useful for debugging are as follows:
■ show memory debug leaks
■ show buffers leak
■ show buffers address DataArea Example: 35DC7F4
■ show buffers input-interface GO dump
■ show interfaces gO
■ show buffers all dump
■ show memory processor dead
One rule of thumb to go by is that typically all the IOS commands are still available and will work, especially the show and debug commands. The list to be aware of is the current one that contains LWAPP/CAPWAP debugs. This is a small list, so you can see the difference between these APs and the 1000 series.
Other notable commands are as follows:
■ show cap client rcb: Displays AP config
■ show cap reap: Displays Remote-Edge AP (REAP) info
■ show cap reap association: Displays REAP association
■ show debug: Displays currently enabled debugs
■ test capwap restart: Restarts the AP, similar to rebooting
■ debug dtls events: Enables Datagram Transport Layer Security (DTLS) events debugging
■ debug dtls error: Enables DTLS error debugging
■ show capwap client rcb: Displays CAPWAP client config
■ debug capwap client events: Debugs CAPWAP client events
■ debug capwap client error: Debugs CAPWAP client errors
■ debug dtls client event: Debugs DTLS client events
■ debug dtls client error: Debugs DTLS client errors
A command is also available to enable remote debugging on the older 1000 series APs. This is used only in rare cases but is worth mentioning in the event it is needed. To enable or disable remote debugging of a Cisco 1000 series lightweight AP or to remotely execute a command on a Cisco 1000 series lightweight AP, use the same command as mentioned earlier. However, in earlier versions, you have to use the config ap remote-debug command:
config ap remote-debug {enable | disable | exc-command cmd} Cisco_AP
The following are a few commands used by the 1000 series APs.
■ help: Displays CLI command list
■ ping: Ping
■ reboot: Reboots AP
■ timeofday: Displays current time of day
■ version: Displays software version
■ get config: Displays current AP configuration
■ get ipaddr: Displays IP address
■ get ipmask: Displays IP subnet mask
■ get key: Displays encryption key
■ get keyentrymethod: Displays encyrption key entry method
■ get keysource: Displays source of encryption keys
■ get login: Displays login user name
■ get nameaddr: Displays IP address of name server
■ get power: Displays transmit power setting
■ get radiusname: Displays RADIUS server name or IP address
■ set antenna: Sets antenna
■ set authentication: Sets authentication type
■ set autochannelselect: Sets auto-channel selection
■ set beaconinterval: Modifies beacon interval
■ set cfpperiod: Sets contention-free period interval
■ set cfpmaxduration: Sets contention-free period max duration
■ set cfpstatus: Sets contention-free period status
■ set channel: Sets radio channel
■ set cipher: Sets cipher
■ set encryption: Sets encryption mode
■ set factorydefault: Restores to default factory settings
■ set fragmentthreshold: Sets fragment threshold
■ set frequency: Sets radio frequency (MHz)
■ set gateway: Sets gateway IP address
■ set groupkeyupdate: Sets group key update interval (in seconds)
Various debugging tools are available depending on the vendor of the device. For wireless, there are controller, AP, client, RADIUS, and even switch debugs. As you can see, almost every hop in a Cisco deployment has a debug point. Debugging is discussed in more depth in each topic when referring to the type of service or technology being discussed.
Advanced Debugging
One of the downfalls of the WLC is that it does not contain many of the IOS tools commonly found on Cisco routers and switches. For instance, you cannot look at the packet detail on a WLC without obtaining a packet trace. However, you can look at the raw data that hits the CPU on the controller. Starting from code Version 4.2, a new command exists to assist you in doing so. This is the debug packet command. What exactly does it do? It captures all the packets or the ones you specify that hit the CPU. That is critical to remember, because if your issue is in reference to traffic that does not interface with the CPU, this command will do you no good. The command is debug packet logging enable all number_of_packets; if you just press Enter, the default is 25. The output of this command is a raw text dump of all packets that transverse the CPU. The command allows you to specify a hex output as well. Example 6-1 shows the output.
Example 6-1 Debug Packet Logging Example
You might be thinking, "What can I do with this data?" If you take the output and save it to a text file, you can convert it to a capture file and actually view it as a wired trace. All you need is a coversion utility, which most packet capture software bundles contain. For example, Wireshark has a text2pcap program that converts the text to a pcap file that Wireshark can then read. Example 6-2 gives you an idea of how to do this.
Example 6-2 Converting Packet Debugs to Wired Traces
You can then view the file using Wireshark or your favorite packet viewing program. The command also allows you to create access control lists (ACL) and apply them if you happen to be looking for specific traffic types. The result is a built-in packet capture that allows you to view packets hitting the CPU of the controller. This is great for client-related issues, AP join issues, and so on.
This debug facility enables you to display all packets going to and from the controller CPU. By default, all packets received by the debug facility are displayed, but you can enable it for either received or transmitted packets or both. You can use ACLs to filter packets before they are displayed so you are not looking at so much data. Packets not passing the ACLs are discarded without being displayed. Each ACL includes an action (permit, deny, or disable) and one or more fields that can match the packet. The debug facility provides ACLs that operate at the following levels and on the following values:
■ Driver ACL
Network processing unit (NPU) encapsulation type Port
■ Ethernet header ACL Destination address Source address Ethernet type VLAN ID
■ IP header ACL Source address Destination address Protocol
Source port (if applicable) Destination port (if applicable)
■ Ethernet over IP (EoIP) payload Ethernet header ACL Destination address
Source address Ethernet type VLAN ID
■ EoIP payload IP header ACL Source address Destination address Protocol
Source port (if applicable) Destination port (if applicable)
■ CAPWAP payload 802.11 header ACL Destination address
Source address
Basic service set identifier (BSSID) Subnetwork Access Protocol (SNAP) header type
■ CAPWAP payload IP header ACL Source address
Destination address Protocol
Source port (if applicable)
Destination port (if applicable)
The first ACL that matches the packet is the one that is selected. You can identify multiple ACLs as each level. If you run into a scenario in which no packets are enabled, you can troubleshoot to determine why packets might not be displayed:
debug packet error {enable | disable}
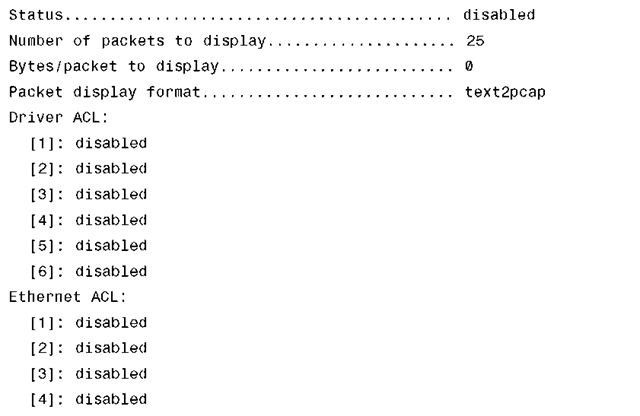
You can also use the typical show debug packet command to see what debug is actually enabled as well as demonstrated in Example 6-3.
Example 6-3 show debug packet Command Output
Example 6-3 show debug packet Command Output
Another advanced tool is the wireless sniffing mode of an AP. The controller enables you to configure an AP as a network "sniffer," which captures and forwards all the packets on a particular channel to a remote machine that runs packet analyzer software. These packets contain elements such as timestamps, signal strength, packet size, and additional information. Sniffers allow you to monitor and record network activity and to detect problems.
You can view additional information on how to set this up and configure it in any of the controller configuration guides.


