Gamma rays from supernova remnants
It is believed that cosmic rays below the so-called "knee" around 1 PeV have galactic origin and are produced in shell-type SNRs. The arguments leading to this important statement are, however, indirect and rather circumstantial. If SNRs are the principal sources of galactic cosmic rays providing the bulk of the observed flux, and if the particle acceleration proceeds through the so-called diffusive shock acceleration mechanism, then the relatively young remnants should be visible in Y-rays, first of all at TeV energies. Thus, the detection of positive TeV signals of hadronic origin from SNRs would provide the first straightforward proof of the shock acceleration of cosmic ray protons and nuclei in these objects.On the other hand, the failure to detect n0-decay Y-ray signals from several selected SNRs would impose strong constraints on the overall energy in accelerated protons per SNR, WCR < 1049 — 1050 erg. Contrary to the current belief, this would indicate an inability of the ensemble of galactic SNRs to explain the observed cosmic ray flux. Motivated by a perspective to make an important contribution to the solution of the long-standing problem of origin of galactic cosmic rays, the HEGRA, CAN-GAROO and Whipple collaborations have conducted extensive programs of observations of young and mid-age galactic shell-type SNRs.
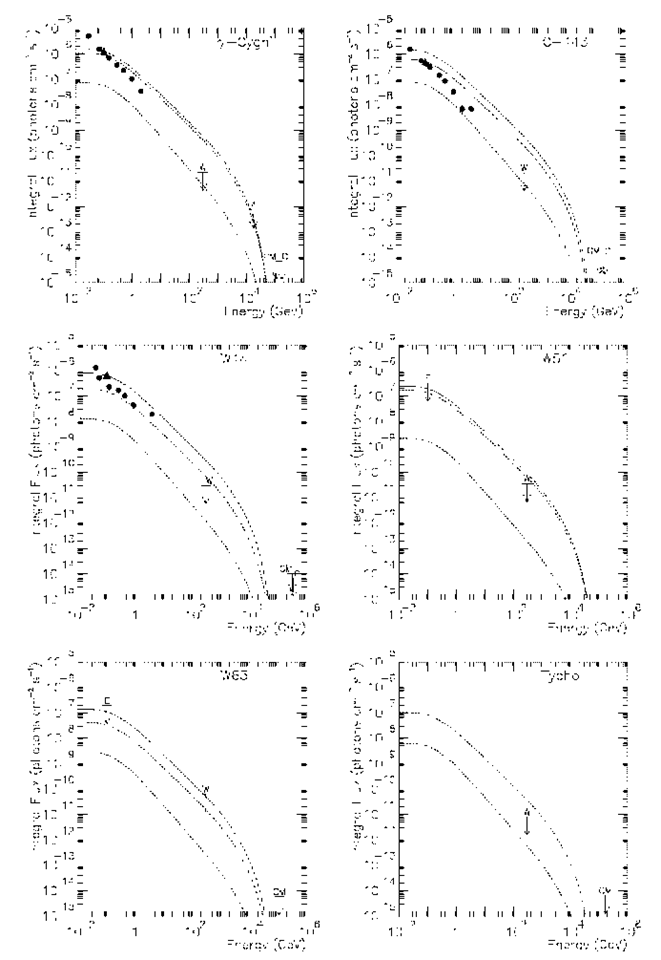
The first attempts led to the flux upper limits from several "good candidate" SNRs. The Whipple collaboration has published the results of observations of six SNRs (Buckley et al., 1998) shown in Fig.2.8, together with the flux upper limits at higher energies obtained by air shower arrays. The low-energy Y-ray measurements by EGRET from the directions close to three of these SNRs, IC 443, y Cygni, and W44, are also shown.
The SNRs shown in Fig.2.8 were selected as possible TeV candidates based on their nonthermal radio properties, relatively small distance, "right" age (to be in the so-called Sedov phase) and, in some cases, because of possible association with nearby molecular clouds. The solid curves are normalised to the EGRET fluxes at 100 MeV assuming that the EGRET emission is produced by hadronic interactions of accelerated particles with an E-21 type spectrum. The upper limits derived for IC 433, W44 and Y Cygni lie significantly below the "model" extrapolations represented by solid curves, and therefore initiated quite heated discussions in the Y-ray and cosmic ray communities concerning the possible need for revision of the standard concept of the origin of galactic cosmic rays – "diffusive shock acceleration in shell-type supernova remnants". Although a possible revision of current views cannot be excluded, at least for some specific aspects of the problem, the strong claims based on the above upper limits apparently are premature and to some extent exaggerated. The conclusions essentially rely on the normalisation to the EGRET data which, in turn, implies two assumptions: (a) the EGRET fluxes originate in the supernova remnants, and (b) they are produced entirely by hadronic interactions. Neither of these assumptions are, however, well justified. Indeed, (i) The localisation of Y-ray regions by EGRET is very poor, especially in the "crowded" regions in the galactic plane where these SNRs are placed.
Fig. 2.8 Whipple flux upper limits (W) from 6 SNR (from Buckley et al., 1998). Also are shown the EGRET fluxes (filled circles) or upper limits (E), as well as the flux limits obtained at higher energies by air-shower detectors – CASA-MIA (CM), CYGNUS (C), and AIROBICC (A). The experimental points are compared to extrapolations from the EGRET fluxes (solid curves), as well as to the conservative estimates of the allowable range of fluxes from the diffusive shock acceleration model (dashed curves).
Therefore, the proximity of the EGRET sources to SNRs should be treated as an interesting hint, but not yet as an established physical association.
(ii) Even adopting these associations as being real, one cannot be sure that the low energy Y-rays are the result of cosmic ray interactions. For example, they can be produced by embedded pulsars – a possible scenario in the case of y Cygni (Brazier et al., 1996).
(iii) Even if the low energy Y-rays are produced at interactions of particles accelerated by SNR shocks with the ambient diffuse gas, the contribution of the electron bremsstrahlung in the EGRET energy region can dominate over the hadronic interactions.
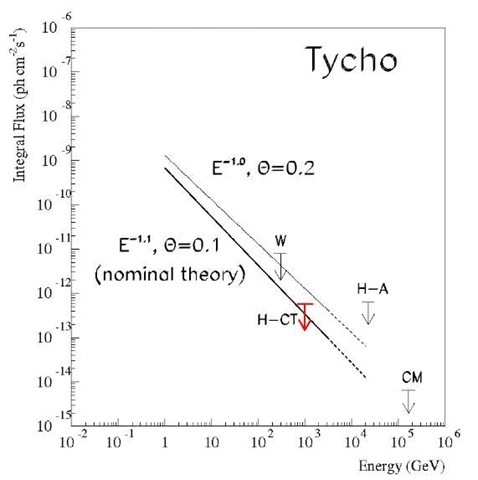
Fig. 2.9 Flux upper limit (indicated as H-CT) from Tycho’s SNR obtained with the HEGRA telescope system.The Whipple (W), HEGRA-AIROBIC (H-A) and CASA-MIA (CM) upper limits are also shown. The thin and thick solid lines correspond to the standard phenomenological predictions assuming two combinations of the power-law index (2.0 and 2.1) of accelerated protons and efficiency (0.1 and 0.2) of conversion of the kinetic energy of SNR explosion to cosmic rays.
Thus, until the arrival of high quality MeV/GeV data, unbiased constraints on the parameter space characterising the diffusive shock acceleration model can be derived only from TeV observations. In this regard, the dashed curves in Fig. 2.8 represent the range of TeV Y-ray fluxes based on the conservative estimates of parameters allowed by the standard shock acceleration model. Note that the typically (especially for SNRs in the galactic plane) poor information about the the nebular gas density and the distance to the source results in a significant (as large as an order of magnitude) combined uncertainty in the predicted TeV fluxes (F < n/d2). It is seen from Fig.2.8 that within such large uncertainties the Whipple upper limits are not in conflict with theoretical predictions.
Generally, it is reasonable to expect significant enhancement of Y-ray fluxes caused by the presence of high density environments, e.g. giant molecular clouds in the vicinity of a SNR. On the other hand, expansion of a SNR in a dense environment may prevent acceleration of particles to very high energies. Therefore, it is possible that the best TeV emitters are SNRs in relatively low density environments. Motivated by this argument, the HEGRA collaboration conducted a deep observation of Tycho’s supernova remnant that resulted in a flux upper limit at the 0.03 Crab level (Fig. 2.9). It is quite close to the conservative theoretical predictions that follow from the standard diffusive shock acceleration theory. This implies that the next generation of telescope arrays in the Northern Hemisphere and GLAST should be able to detect Tycho at GeV energies, or introduce significant corrections to our current understanding of particle acceleration processes in SNRs.
While the ultimate aim of the next generation IACT arrays will be inspection of the long-standing hypothesis that the population of shell-type SNRs as a whole is responsible for the galactic cosmic rays through the diffusive shock acceleration, presently we already have evidence that some individual representatives of this source population do accelerate, in one way or another, particles to energies well beyond 10 TeV. Importantly, this belief no longer relies merely on theoretical arguments, but has an observational backing.
SN 1006 and RX J1713.7-3946. The detection of featureless X-ray emission from several relatively young SNRs, of which the shells of SN 1006 and RX J1713.7-3946 are the most convincing examples, is best interpreted as synchrotron radiation of relativistic electrons accelerated to energies – 100 TeV (e.g. Koyama, 2001). Motivated by the ASCA X-ray discoveries, the CANGAROO group over the last several years has extensively observed SN 1006 and RX J1713.7-3946 and … found TeV y-ray signals from both objects. The original reports of detection of TeV Y-rays from these objects obtained with the 3.8 m telescope (Tanimori et al., 1998b, Muraishi et al., 2000) were later claimed to be confirmed by more sensitive observations with the new 7m and 10 m diameter telescopes (Tanimori, 2003).
The synchrotron origin of X-radiation from these objects implies the existence of 10 TeV electrons which should also produce TeV Y-ray emission trough upscattering of the 2.7 K CMBR. This idea was immediately adopted by the TeV and X-ray communities, and continues to dominate as the most likely and natural interpretation of the detected TeV Y-ray emission from both objects. However, this interpretation requires very small magnetic fields in the X- and Y-ray production regions, and might face a serious theoretical challenge connected with the limited acceleration rate allowed by the standard (parallel shock-acceleration) mechanism (Aharo-nian, 1999). On the other hand, it has been argued that in spite of certain problems, the hadronic origin of gamma-radiation should not be discarded based on simplified model calculations.
The question of the origin of the TeV emission from SN 1006 remains rather uncertain and controversial. Decisive tests can be obtained only after comprehensive spectrometric and morphological studies of properties of Y-ray emission. The most exciting upshot of these measurements could be the localisation of the TeV Y-ray production region. In the case of hadronic (n0-decay) origin of Y-rays we should expect, within the diffusive shock acceleration scenario, a quite compact region in the shell, because of the strong shock-compression of the target material. In contrast, the leptonic (inverse Compton) model predicts that the TeV emission should cover an extended region, because of fast diffusion of the most energetic electrons in the weak (required by this model) ambient magnetic fields.
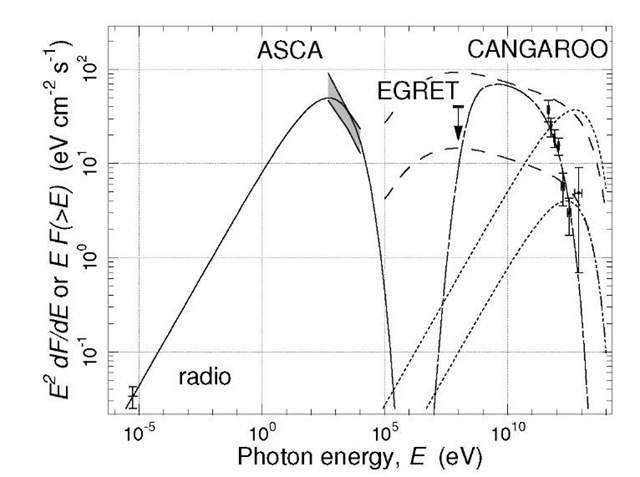
Formally, the above arguments concerning the question of the "hadronic versus leptonic" origin of TeV emission can be applied also to the second CANGAROO source, RX J1713.7-3946 (Muraishi et al., 2000). However, the case of this source seems to be even more complicated and knotty. Recently Enomoto et al. (2002) published the spectrum of TeV emission of this source based on newer CANGAROO observations. The spectrum is claimed to be steep with a power-law photon index r = 2.8 ± 0.2 between 400 GeV and 8 TeV (see Fig. 2.10). They argued that such a steep spectrum is inconsistent with the inverse Compton model, but can be explained by n0-decay Y-rays. If true, for the standard shock acceleration spectrum with power-law index « 2, this would require an energy cutoff in the proton spectrum around 10 TeV. Immediately after publication of this paper, Reimer and Pohl (2002) and Butt et al. (2002) criticised this interpretation arguing that it violates the Y-ray upper limits set by EGRET at GeV energies. Note that in Fig. 2.10 from Enomoto et al. (2002) the EGRET flux upper limit is indicated only at 100 MeV, whereas the flux upper limits above 1 GeV are more restrictive. However, this is not a sufficiently robust argument to discard the hadronic origin of the reported TeV emission.
On the other hand, the arguments against the IC model should be backed by thorough theoretical studies based on higher quality data from the radio, X-ray and Y-ray domains. The X-ray observations are of particular interest because the synchrotron X-ray fluxes reliably "control" the predictions of IC emission at TeV energies. The recent morphological and spectral studies of the northwest rim of RX J1713.7-3946 (the region where the acceleration of relativistic electrons and presumably also protons takes place) with Chandra unexpectedly revealed remarkable structure of this region with bright filaments and hot spots, accompanied by dark voids (Uchiyama et al., 2003).
Fig. 2.10 Multiwavelength spectral energy distribution of RX J1713.7-3946 (from Enomoto et al., 2002). The solid, dotted, dashed, and dot-dashed curves correspond to model calculation for synchrotron, inverse Compton, bremsstrahlung, and![]() decay radiation components. The upper and low curves for the inverse Compton and bremsstrahlung components are calculated for two representative magnetic fields, 3 and
decay radiation components. The upper and low curves for the inverse Compton and bremsstrahlung components are calculated for two representative magnetic fields, 3 and ![]() respectively. The absolute fluxes of
respectively. The absolute fluxes of![]() Y-rays are calculated assuming a spectral index of accelerated protons rp = 2.08, an exponential cutoff at
Y-rays are calculated assuming a spectral index of accelerated protons rp = 2.08, an exponential cutoff at![]() and
and![]() where Wp is the overall energy in
where Wp is the overall energy in
protons, d is the distance to the source, and n is the ambient gas density.
This adds more puzzles to this source which may challenge the perceptions of the standard diffusive shock-acceleration model, and makes new Y-ray studies with forthcoming IACT arrays like H.E.S.S. and CANGAROO-III extremely important Both the high TeV fluxes reported by the CANGAROO collaboration (approximately at the Crab level), and the typical angular dimensions of the relevant regions (from several to tens of arcminutes) perfectly match the performance of these instruments for an adequate spectral and spatial studies in a broad energy region from 100 GeV to 10 TeV.
Cas A. While the origins of TeV emission claimed to be detected from SN 1006 and RX J1713.7-3946 are not yet established, and remain controversial, it is likely that the TeV emission from the young supernova remnant Cas A detected by the HEGRA telescope system can be relatively easy explained by interactions of accelerated protons with the ambient gas. The "brute-force" observation strategy applied by the HEGRA collaboration to one of the most prominent objects in the sky, was eventually rewarded by detection of a tiny flux,![]() above 1 TeV.More than 200 hours of data accumulated during 3 years from 1997 to 1999, revealed a positive signal with statistical significance of 5a. The high quality of data obtained by the stereoscopic system of imaging Cherenkov telescopes, as we well as the power of the stereoscopic approach to control the background conditions, make this result highly reliable.
above 1 TeV.More than 200 hours of data accumulated during 3 years from 1997 to 1999, revealed a positive signal with statistical significance of 5a. The high quality of data obtained by the stereoscopic system of imaging Cherenkov telescopes, as we well as the power of the stereoscopic approach to control the background conditions, make this result highly reliable.
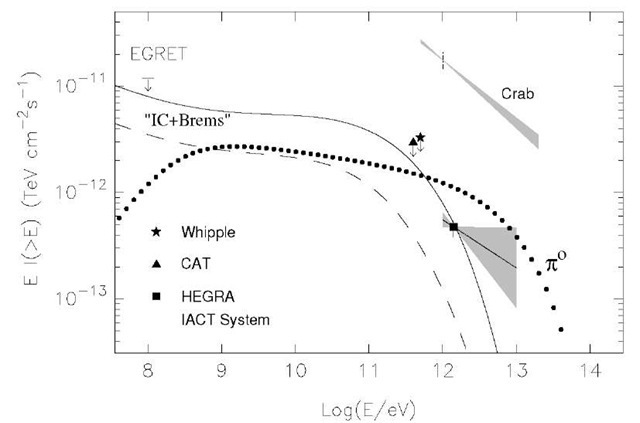
Cas A is the result of the youngest supernova event in our Galaxy that took place around 1680. It is a very bright radio source. The source is bright also in X-rays, a noticeable fraction of which may have nonthermal origin. But, unlike SN 1006 and RX J1713.7-3946, the hard X-ray emission of this source can be interpreted in different ways, therefore we still do not have strong observational evidence of acceleration of electrons in this object to multi-TeV energies. These electrons present a certain interest as contributors to the TeV Y-ray emission through the inverse Compton scattering. However, because of the well established strong magnetic field in the nebula, well over 100 ^G, it is likely that the inverse Compton contribution is not very significant, unless we assume multi-zone structures containing regions with a very low magnetic field.On the other hand, because of very low reported TeV Y-ray flux and high average density of the nebular gas, a little effort is needed to explain the TeV radiation by interactions of accelerated protons. This interpretation requires « 1049 erg total energy in accelerated protons (see Fig. 2.11) which exceeds by only a factor of 10 the energy in relativistic electrons derived from radio observations.
Crucial information about the radiation mechanism is contained in the energy spectrum. For example, inverse Compton scattering predicts a differential spectrum steeper than E-3. Therefore, the detection of a steep Y-ray spectrum would be an additional argument in favour of the hadronic origin of TeV emission. The tiny signal detected by HEGRA does not allow the derivation of the energy spectrum. But hopefully this information will be available soon with the forthcoming IACT arrays.
Fig. 2.11 Gamma-rays from Cas A. The shaded area shows the 1a error range for the fluxes measured by the HEGRA CT-system.Also indicated are the flux upper limits set by EGRET, Whipple and CAT telescopes. The model predictions are from Atoyan et al. (2000b). The dotted curve represents the fluxes for![]() decay Y-rays calculated for relativistic protons with power-law index
decay Y-rays calculated for relativistic protons with power-law index![]() 2.15 (identical to the spectral index of radio emitting electrons), exponential cutoff at
2.15 (identical to the spectral index of radio emitting electrons), exponential cutoff at ![]() and total energy
and total energy![]() The density in the shell is assumed
The density in the shell is assumed![]() The solid and dashed lines correspond to the Y-ray fluxes produced by electrons (IC+Bremsstrahlung) calculated in the framework of a 3-zone model for 2 set of basic parameters.
The solid and dashed lines correspond to the Y-ray fluxes produced by electrons (IC+Bremsstrahlung) calculated in the framework of a 3-zone model for 2 set of basic parameters.
Other galactic sources
The high Y-ray detection rate capability of atmospheric Cherenkov telescopes makes them effective tools for searches for possible episodic or burstlike TeV emission from compact objects in our Galaxy. After the failure of the present generation of ground-based instruments to confirm the early optimistic claims of detection of TeV signals from X-ray binaries and cataclysmic variables, these sources have been removed from the highest priority target list of ground-based observations. However, after the discovery of galactic sources with relativistic jets, or the so-called microquasars, which unexpectedly revealed that non-thermal high energy processes play an important role in these accretion-powered objects, the X-ray binaries regained popularity in the gamma-ray community. Some models of X-ray binaries with synchrotron radio jets predict that in addition to comptonized thermal X-ray emission formed in the hot accretion disks, one may also expect hard nonthermal X-rays produced in the jets by synchrotron radiation from ultrarelativistic, multi-TeV electrons. Under certain conditions, the same electrons may effectively radiate episodic VHE Y-ray emission through the inverse Compton channel.Also, microquasars have been recently claimed as possible sources of high energy neutrinos due to photo-meson processes in the inner parts of the jets (Distefano et al., 2002). If true, high energy neutrinos should be accompanied by observable gamma-radiation as well.
In this regard, the reports about tentative (but unfortunately not yet confirmed) detections of transient TeV signals from GRS 1915+105 and from the accreting X-ray binary Cen X-3 (Chadwick et al., 1998b) represent intriguing evidence that VHE phenomena indeed may take place in these objects. Therefore, it is quite important to monitor these sources with the next generation of IACT arrays. The possible links between relativistic motion and accretion phenomena in these objects may provide a key insight into the nature of not only compact galactic X-ray sources, but also for the engines of AGN and quasars.
The episodic character of VHE Y-ray emission from highly variable sources requires detailed search strategies supported by multiwavelength observations. TeV episodic sources can be revealed also serendipitously during systematic surveys of the galactic plane. Generally, the atmospheric Cherenkov telescope technique is designed for pointing observations. However, the stereoscopic approach coupled with the relatively large field of view of the imaging cameras, provides highly accurate reconstruction of Y-ray arrival directions up to 2 degrees off-axis, thus allowing reasonable surveys of the sky from single tracking positions. The HEGRA collaboration has demonstrated the effectiveness of this technique using the system of telescopes equipped with 271 pixel cameras with 4.3° diameter FoV for the first sensitive TeV survey. One quarter of the galactic plane![]() has been covered, which included 86 radiopulsars, 63 supernova remnants, and nine GeV sources. In total, 115 hours of high quality data distributed over 92 individual locations were accumulated. For reference and calibration purposes, several observations of the Crab Nebula in different periods were also carried out.
has been covered, which included 86 radiopulsars, 63 supernova remnants, and nine GeV sources. In total, 115 hours of high quality data distributed over 92 individual locations were accumulated. For reference and calibration purposes, several observations of the Crab Nebula in different periods were also carried out.
No evidence for TeV emission was found; the flux upper limits range from 0.15 Crab to several Crab units depending on the observation time and angular size of the objects. The ensemble sums over selected pulsar, SNR and the so-called GeV-source sample (Lamb and Macomb, 1997) do not show positive signals either. Nevertheless they allow quite robust upper limits from these potential source populations – 3.6%, 6.7%, and 5.7% of the Crab flux for the pulsar, SNR, and GeV-source subsets, respectively.
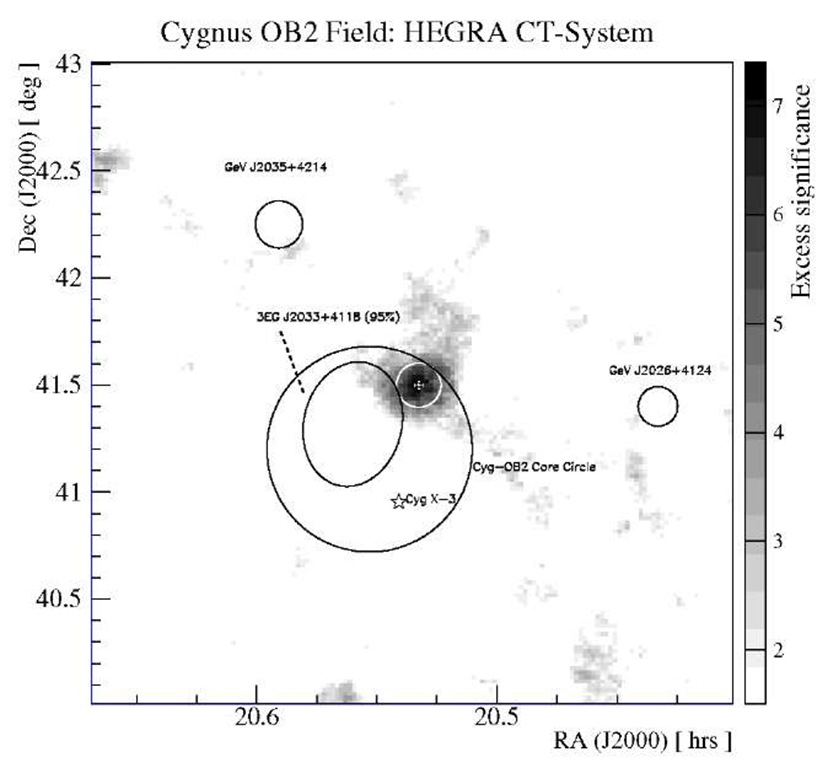
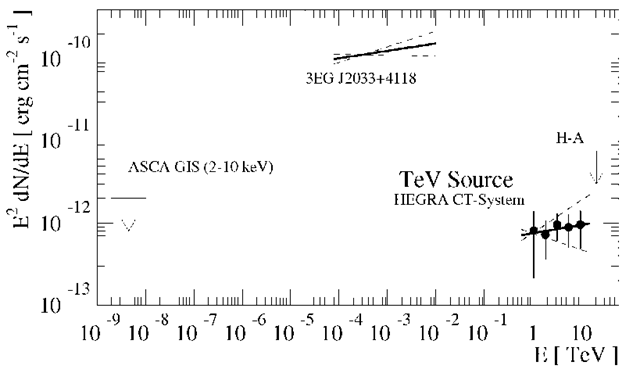
The observations followed mainly the galactic equator with a spacing between individual scan positions of 1 degree, but in some regions, in particular in the Cygnus region, the survey covered a larger range in galactic latitude, although at the expense of a reduced overlap between adjacent points. In addition, the Cygnus region has been later observed more extensively due to several pointing observations in search of TeV counterparts for two EGRET GeV sources, GeV J2035+4214 and GeV J2026+4124, as well as from the binary X-ray source Cyg X-3. These observations during 1999, 2000 and 2001 (for a total 113 hours) have serendipitously revealed a signal positionally inside the core of the OB association called Cygnus OB2.The sky-map of the excess events of this region obtained by the HEGRA telescope system is shown in Fig. 2.12. The excess significance at the source center of gravity amounts to 5.9a, which however is reduced to 4.6a after accounting for the statistical trial factor. The source did not show flux variability, but the marginal signal accumulated over 3 years does not allow a strong statement in this regard. On the other hand, the source seems to be extended with an intrinsic radius of about 5 arcminutes. Another interesting feature of the source is its quite hard spectrum (see Fig. 2.13) that can be approximated as power-law with a photon index![]() The integral flux above 1 TeV amounts to 25 mCrab.
The integral flux above 1 TeV amounts to 25 mCrab.
TeV J2032+4130, the same region was monitored again in 2002. The observations over 130 hours confirmed the presence of the TeV source at the same position with the same (originally reported) flux and angular size of Y-ray emission. The excess significance from all data exceeds 7a (G. Row-ell, private communication). The energy spectrum also appeared consistent with the previous result, confirming that the hard spectrum extends to — 10 TeV.
Although the TeV source is located in a remarkable place, in the core of Cygnus OB2 (Knodlseder, 200), where the total mechanical energy of young stellar winds exceeds several times 1039 erg/s, so far no remarkable counterpart is identified with the TeV source. No luminous star or catalogued X-ray source from the ROSAT survey lies within the TeV error circle. The archival ASCA GIS data give a 99% upper limit of 2 x 10-12 erg cm-2 s-1 in the interval 2-10 keV (see Fig. 2.13).
Fig. 2.12 Sky-map of event excess significance for a 3° X 3° region centered on TeV J2032+4130. Only significances larger than 3a are shown. The locations ellipses (95 % confidence) of 3 EGRET unidentified sources, the nearby X-ray binary Cyg X-3, and the core of Cygnus OB2, are also shown.
Such results may imply that the particle accelerator is not co-located with the TeV source, i.e. the particle acceleration and Y-ray production regions are well separated. This scenario generally favours a hadronic origin of the radiation. While this radiation should peak in the highest density environments, e.g. in the nearby dense molecular clouds, the TeV Y-ray emissivity immediately in the accelerator can be quite modest because of low density of the target material inside, as well as due to fast escape of the highest energy particles from the acceleration region. In this scenario, the hard TeV spectrum of the observed emission can be readily explained by (energy-dependent) diffusion effects characterising propagation of protons from the accelerator to the target.Assuming that the TeV source is indeed located in Cygnus OB2, the distance to which is estimated as 1.7 kpc, the TeV Y-ray luminosity of![]() : between 1 and 10 TeV requires a reasonable total energy in
: between 1 and 10 TeV requires a reasonable total energy in![]() protons,
protons,![]() where n is the gas density in the Y-ray production region.
where n is the gas density in the Y-ray production region.
Fig. 2.13 The differential energy spectrum of TeV J2032+4130.The energy flux of the EGRET source 3EG J2033+4118 and the ASCA GIS upper limits are also shown.
An alternative mechanism for extended TeV emission can be the inverse Compton scattering of ultrarelativistic electrons. This mechanism can be realized in two possible scenarios – in a plerion (with possibly a misaligned pulsar) or in a jet-driven termination shock. The second case apparently implies the existence of a nearby microquasar. One may speculate that two EGRET sources in the proximity of the TeV source in Fig. 2.12 (one of them, 3EG J2033+4118, is possibly associated with Cyg X-3; see Mori et al., 1997), could be possible candidates for such a microquasar. Independent of the origin of accelerated electrons, the inverse Compton model requires a rather low magnetic field in the region of Y-ray production, not larger than 10 ^G, otherwise the synchrotron radiation of multi-TeV electrons would exceed the ASCA upper limit.
And finally, it is quite possible that the TeV source is a representative of a new source population in our Galaxy. The discovery of this source required more than 100 h observation time with the HEGRA stereoscopic system. Because of its hard spectrum, the source is not accessible, for any reasonable observation time, for other current ground-based instruments. However, with arrival of the next generation of IACT arrays with significantly improved sensitivities at TeV energies (by a factor of 5 or more compared to the HEGRA telescope system at 1 TeV), statistically significant signals from similar sources should appear after several hours of observations. The discovery and detailed study of spectral and angular properties of more TeV objects of this kind seems very promising in the context of planned deep survey of the the galactic plane with the H.E.S.S. IACT array, given its ideal location in the southern hemisphere, effective energy threshold around 100 GeV, superior flux sensitivity![]() (above 1 TeV for less than 10 hour observation time, and for relatively compact objects with angular size less than several arcmin), and large, 5-degree FoV.
(above 1 TeV for less than 10 hour observation time, and for relatively compact objects with angular size less than several arcmin), and large, 5-degree FoV.
TeV blazars
Many nonthermal extragalactic objects representing different classes of AGN and located within 1 Gpc are potential TeV sources. First of all this concerns the BL Lac population of blazars of which four representatives, Mkn 421 (at redshift z = 0.031), Mkn 501 (z = 0.034), 1ES 1959+650 (z = 0.047), and 1ES 1426+428 (at z = 0.129) are firmly established by independent observations of several groups as TeV Y-ray emitters. The current list of extragalactic TeV sources contains two more BL Lac objects detected at 4 to 6 standard-deviation significance level – 1ES 2344+51 at z = 0.044, and PKS 2155-304 at z = 0.116, as reported by the Whipple (Catanese et al., 1998) and Durham (Chadwick et al., 1999) groups, respectively. The Crimean group has claimed detection of TeV Y-rays from two other AGN – 3C 66A (Neshpor et al., 1998) and BL Lacertae (Neshport et al., 2001). The reported Y-ray fluxes significantly exceed the upper limits set by other groups with more sensitive instruments. But this cannot be interpreted as contradiction, given the highly variably behaviour of blazars. It should be noted in this regard that BL Lacertae (z = 0.069) – the prototypical object for a class of AGN (BL Lacs) that are characterised by strong variability in continuum emission and polarization, but with very weak emission and absorption lines – has not been established as an outstanding MeV/GeV Y-ray emitter until the remarkable optical outbursts in 1997 July, when the follow-up observations with EGRET revealed strong Y-ray flux above 100 MeV (Bloom et al., 1997). On the other hand, the claim about detection of TeV Y-rays from the distant blazar 3C 66A (z = 0.44) seems rather unlikely on theoretical grounds, given the fact that only a negligible fraction of TeV Y-rays would survive severe intergalactic absorption due to interactions with the diffuse extragalactic radiation fields.
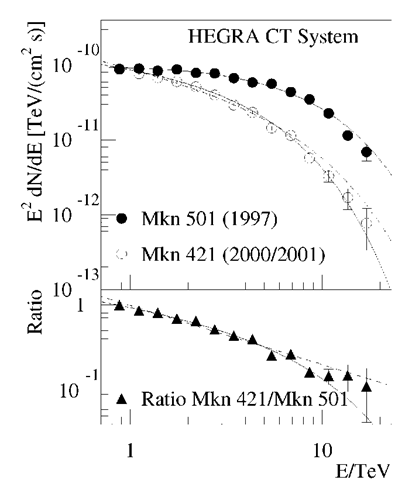
Since the discovery of TeV Y-radiation of Mkn 421 by the Whipple group (Punch et al., 1992), this object has been subject of intensive studies through multiwavelength observations. The source is variable with typical average TeV flux between 30% to 50% that of the Crab Nebula, but with rapid, as short as 0.5 h, flares.Until the spectacular high state of the source in 2001, the spectral studies were based mainly on the data taken during quiescent or moderately high states. In particular, the spectrum measured by HEGRA during the 1998 "ASCA" campaign (Takahashi et al., 2000) is fitted by a steep power-law with photon index r ~ 3. The exceptionally bright and long-lasting activity of Mkn 421 in 2001 allowed the HEGRA and VERITAS groups to derive the time-averaged gamma-ray spectrum of the source in the high state which up to ~ 15 TeV is described as dN/dE = exp (—E/E0),i.e. by the same canonical "power-law with exponential cutoff" function found earlier by the HEGRA group for the high-state, time-averaged spectrum of Mkn 501.The spectra of these sources are not, however, identical. In Fig. 2.14 are shown the spectral energy distributions based on approximately 40,000 and 60,000 (!) TeV Y-ray events detected by the HEGRA telescope system during the exceptionally high states of Mkn 501 in 1997 and Mkn 421 in 2001, respectively. They are described by different [r, E0] combinations: r = 1.92 and E0 = 6.2 TeV for Mkn 501 and r = 2.19 and E0 = 3.6 TeV
The power-law part of the spectrum of Mkn 421 is steeper, and the exponential cutoff starts earlier. The difference is clearly seen from the the lower panel of Fig. 2.14 where the ratio of two energy spectra is shown. Since both sources are located at approximately the same distance, the difference in the cutoff energies can be interpreted as an indication against the hypothesis that attributes the cutoffs to the pure intergalactic-absorption effect.
For the typical energy resolution of Cherenkov telescopes of about 20% or larger, one has to be careful with conclusions concerning the spectral shape at energies well beyond the cutoff energy E0.
Fig. 2.14 The spectral energy distributions of Mkn 501 and Mkn 421 in high states. The observed differential spectra are well described by a power law with exponential cut-off. Both the cut-off energy and the photon index are different for the two energy spectra (see the text). A fit of a fixed cut-off energy at 6.2 TeV, as measured for Mkn 501 but letting the photon index vary, applied to the Mkn 421 data, results in the dashed curve in the upper. To demonstrate the difference in the two energy spectra and to reduce the impact of possible systematic effects, the ratio of the Mkn 421 and Mkn 501 spectra is shown in the lower panel.
Obviously for determination of spectra with sharper (super-exponential) cutoffs, a significantly better energy resolution is required. Motivated by this, the HEGRA collaboration recent re-analysed the "1997 high-state" spectrum of Mkn 501 using an improved method for energy reconstruction with ~ 10% resolution achievable for the stereoscopic mode of observation (Hofmann et al., 2000). The new analysis confirms the result of the previous study up to 17 TeV, but provides a stronger constraint on the flux at 21 TeV.With this new point, the Mkn 501 spectrum at very high energies is better described by a power-law with super-exponential cutoff (see Fig. 10.3).
The low fluxes of Mkn 421 and Mkn 501 detected by EGRET indicate that the "power-low with a (super)exponential cutoff" spectral presentation at TeV energies with photon index « 2 in the high states of these objects, cannot be extrapolated towards low energies. There is little doubt that significant spectral changes should occur in the transition region from GeV to TeV energies.
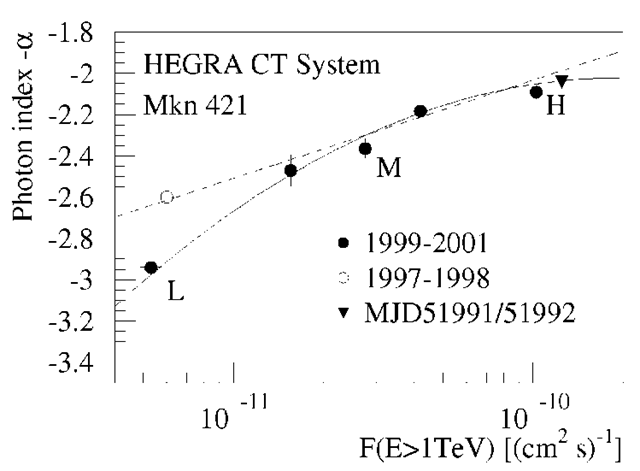
Fig. 2.15 The "photon index – absolute flux" relation based on the TeV measurements of Mkn 421 at different epochs.The energy spectra get harder with increasing flux as is seen when splitting data in separate flux intervals ("L", "M", and "H" indicate the levels of low, medium, and high fluxes, respectively) and fitting by a power law with a fixed exponential cut-off energy (3.6 TeV) to the individual energy spectra. Also indicated are the values for the night MJD51991/51992, as well as the average flux from the 1997/1998 observations of Mkn 421.
Therefore, the spectral studies at energies around 100 GeV are of a great interest. During the high state of Mkn 421 in 2001, an important measurement at 140 GeV was performed by STACEE – a Cherenkov-wave-front sampling detector using heliostats of the National Solar Thermal Test Facility near Albuquerque, New Mexico (Boone et al., 2002). The temporal evolution of the flux during the March to May period appeared consistent with observations in both the TeV (Whipple) and X-ray (RXTE) bands. The mean energy flux of about 10-10 erg/cm2s is comparable with the TeV flux averaged for the same period of activity of the source. However, the lack of information about fluxes derived by STACEE and Whipple for precisely overlapping time intervals, prevents a broad-band compilation of the Y-ray spectral energy distribution, given the variability of the source on timescales of several hours or less.
Despite the huge overall photon statistics, the spectra of both sources above 10 TeV can only be determined using data accumulated over long periods of observations. Obviously, the time-averaged spectra of variable sources obtained in such way can be considered as astrophysically meaningful only if the spectral shape is time-independent, i.e. does not strongly correlate with the absolute flux. Remarkably, during the high state in 1997 the shapes of daily spectra of Mkn 501, despite dramatic flux variations, remained essentially stable, albeit for some specific flares non-negligible spectral variations cannot be excluded. For example, the CAT group (Djannati-Atai et al., 1999) found evidence for a noticeable hardness-intensity correlation for the 1997 April 7 and 16 flares.
The sensitivity of current ground-based detectors is not sufficient to study the spectral variability of TeV radiation of Mkn 421 and Mkn 501 in quiescent states on timescales less than several days. However, even the time-averaged spectra in low states are of certain interest. The HEGRA observations of Mkn 501 in 1998 and 1999, when the source was at a « 10 times lower flux level compared to the average flux in 1997, revealed a noticeable steepening (by 0.44 ± 0.1 in photon index) of the energy spectrum. Clear "spectral shape – absolute flux" correlations on large time-scales have been found also for Mkn 421 by the Whipple (Krennrich et al., 2002) and HEGRA groups (see Fig. 2.15).
Recently, similar behaviour has been observed from another TeV blazar – 1ES 1959+650 . This is an X-ray selected BL Lac object at z=0.047 with a steep X-ray spectrum. In the quiescent state, the synchrotron peak is located at several eV, but during strong flares it can be significantly shifted towards higher, keV energies. The first evidence of TeV emission from this source was reported by the Telescope Array group (Nishiyama et al., 1999). The source was monitored with the HEGRA system during the July 2000 – October 2001 period. The data, based on 94 h of observation time, revealed a positive (« 5a) Y-ray signal.The energy spectrum relevant to this period of observations with an average flux of the source of about 0.08 Crab is well described by a power-law with a photon index 3.3 ± 0.7 (see Fig. 2.16).
Fig. 2.16 The energy spectra of 1ES1959+650 in the low (2000/2001) and in the high states by combining data of May 18/19, 19/29, July 13 and July 14 flares.
In May 2002 the source suddenly entered a remarkably high state that lasted at least 3 months. The high TeV activity noticed by the Whipple collaboration (Dowdall et al., 2002), triggered intensive monitoring of the source also with the CAT and HEGRA telescopes, as well as by the pointed X-ray instruments aboard RXTE. During this period, the variable TeV flux of the source very often exceeded the Crab flux. The energy spectrum of 4 combined flares in May 18/19, 19/29, July 13 and July 14 is shown Fig. 2.16. The function E-15 exp(—E/E0) with E0 « 2.4 TeV describes the time-averaged spectrum quite well . Unfortunately, the limited spectral points detected by HEGRA cannot tell us whether the index of 1.5 reflects the real power-law photon index (slope) of the spectrum at energies E ^ E0 , or whether it should be treated as a formal fit parameter for the region above 1 TeV. In this regard, results from low-energy threshold CAT data, obtained at preferable (smaller) zenith angles (because of the location of this instrument at 42N latitude) is of great interest, in particular for derivation of constraints on the diffuse extragalactic background at near infrared and optical wavelengths.
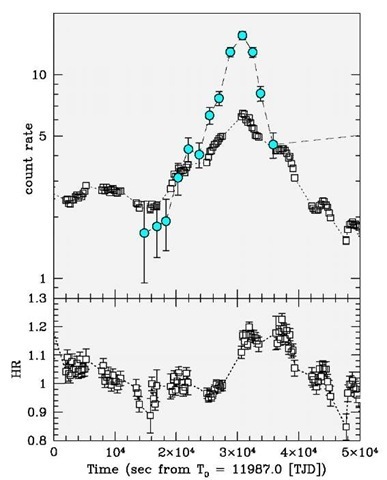
Fig. 2.17 Simultaneous X-ray and 7-ray observations of the 2001 March 19 flare of Mkn 421 by RXTE (squares) and VERITAS (circles). The bottom panel shows the RXTE/PCA "6-11 keV/3.5-4.5 keV" hardness ratio.
The imaging atmospheric Cherenkov telescopes are nicely suited to searches for short signals from TeV blazars in flaring states. In particular, they can follow flares at flux level « 10-11 erg/cm2s on timescales less than several hours, and thus are well-matched to the sensitivity and spectral coverage of X-ray detectors of the RXTE, BeppoSAX and XMM satellites for multiwavelength studies of flux variations. This is a key condition which makes simultaneous X- and Y-ray observations meaningful.
The first important results on the correlated TeV and X-ray flares were obtained during the extraordinary activity of Mkn 501 in 1997, as well as during the 1998 multiwavelength campaign of Mkn 421 (Takahashi et al., 2000). The best results so far in this regard became available after the well coordinated multiwavelength campaigns of spectacular flares of Mkn 421 in 2001. On several occasions, truly simultaneous observations by RXTE and TeV instruments with durations up to 6 hours per night were carried out. A nice sample of such events, the 2001 March 19 flare detected by RXTE and VERITAS shows a clear keV/TeV correlation on sub-hour timescales (Fig.2.17).
The detection of a large number of strong flares during the high activity of Mkn 421 in 2001 by the HEGRA telescope system shows that the temporal and spectral properties of individual flares can be very specific and essentially different from each other. This is demonstrated in Fig.2.18 where the time profiles of two flares observed during two subsequent nights, March 21/22 and March 22/23, are shown. Both flares have asymmetric profiles described by a surprisingly simple analytical function consisting of two exponentials that characterise the rise and decay times,
However, while the rise time of the first flare,![]() was 3 times longer that the decay time,
was 3 times longer that the decay time,![]() the rise time of the second flare,
the rise time of the second flare,![]() was almost an order of magnitude shorter than the decay time
was almost an order of magnitude shorter than the decay time![]()
For a deep understanding of acceleration and radiation processes in jets, it is crucial to search for spectral variability on timescales comparable to the characteristic dynamical times of flares. The strongest flares of Mkn 421 in 2001 provide us with such unique data. In particular, the HEGRA IACT system was able to perform spectral studies on hour timescales, when the flux was larger than 1-2 Crab units. This is seen in Fig. 2.18 where in the lower panels the hardness ratios of these two flares are shown as a function of time. During the rising stage, the spectra in both cases show a significant hardening, correlated with the absolute flux increase, and a softening at the end of the flare.
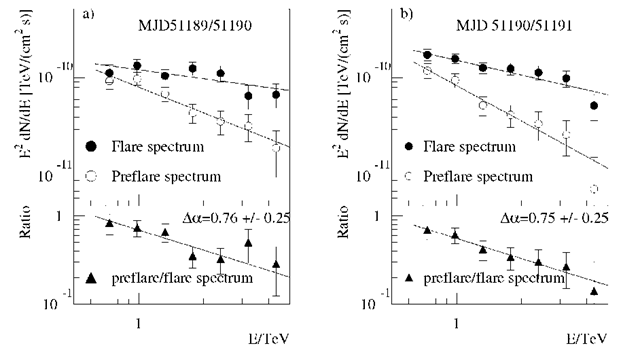
This behaviour is clearly seen in Fig.2.19, where the energy spectra are shown for two different time intervals that cover the pre-flare and flare stages (indicated by vertical lines in Fig. 2.18). For both flares, the pre-flare energy spectra are described by a power-law with a photon index of « 3, with a significant hardening by![]() during the flare.
during the flare.
The analysis of other flares detected by HEGRA show that the flux variations are not always accompanied by spectral changes.For example, one flare has been observed with very high flux, but with power-law photon index of « 2.9. On the other hand, very strong flares of a comparable strength sometimes may show significantly different energy spectra. 
Fig. 2.18 The time profiles of two Two flares of Mkn 421 during the night March 21/22, 2002 and March 21/22, 2002 (right panel). The solid lines indicate a fit of the function F(t) (see the text). The lower panels show the time evolution of the spectral hardness ratios of these flares.
Such an "irregular" relation between the absolute flux and the energy spectrum indicates that the spectral variations are result of dramatic nonlinear changes of conditions and principal parameters in the particle acceleration and Y-ray production regions, rather than a consequence of quantitative changes of the power that initiates and drives these flares. For a proper understanding of complex processes in the blazar jets, the TeV data should be treated in the context of multiwavelength observations, first of all together with X-rays. Remarkably, TeV observations of Mkn 421 in 2001 have been perfectly coordinated with X-ray observations. Many strong flares of this exceptionally high state of Mkn 421 have been continuously observed by the RXTE detectors together with the HEGRA and Whipple telescopes.
As mentioned above, simultaneous X-ray (RXTE) and TeV (CAT,HEGRA, Whipple) data of high quality have been obtained also during the high state of 1ES 1959+650 in 2002. These data, together with the multiwavelength observations of Mkn 501 in 1997 and Mkn 421 in 2001 constitute solid observational material for further phenomenological and theoretical studies. At the same time, it would be naive to expect that these result will immediately bring harmony to the current paradigm of the TeV blazars.
Fig. 2.19 The evolution of the energy spectra of two flares detected during the nights March 21/22 and March 22/23. Both flares show a significant spectral hardening while the flux increases.
There is little doubt that these data will require significant modification, if not a dramatic revision of the existing models of TeV emission, including the currently popular synchrotron-self-Compton (SSC) or external Compton models.
A real problem for the existing models could come also from the TeV blazar 1ES 1426+428 detected recently in TeV Y-rays by the Whipple (Horan et al., 2002, Petry et al., 2002), HEGRA and CAT (Djannati-Atai et al., 2002) groups. Although the statistical significances of reported signals in each case were at the level of 5a, the three independent measurements do not leave a doubt in the discovery of the 4th TeV blazar.
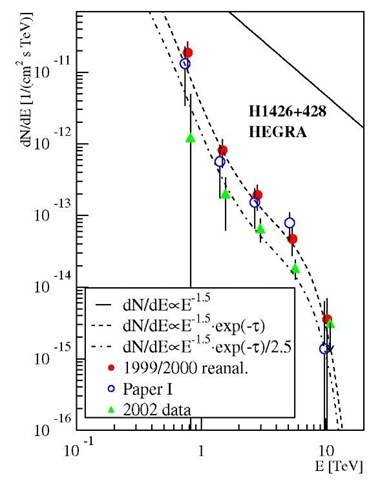
Motivated by this result, the HEGRA CT-system has been used for very deep (more than 200 hours) observations of the source in 2002. Although during this period, the flux was by a factor of « 2.5 lower than during the previous observations in 1999/2000 (Fig. 2.20), the source was again detected at 5.3 a level, thus confirming this object as a TeV source.
Because of the relatively large redshift of 1ES 1426+428 (z = 0.129), the TeV radiation from this extreme BL Lac object suffers severe intergalactic absorption. Therefore the discovery of TeV Y-rays was, to a certain extent, a big surprise. Despite large uncertainties in the Cosmic-Infrared-Background (CIB), which is a part of the overall diffuse extragalactic background radiation (DEBRA) at optical and IR wavelengths, there is little doubt that the TeV Y-rays from this source arrive after significant absorption.
Fig. 2.20 The energy spectra of 1ES 1426+428 derived by the HEGRA CT-system for the different data sets. The reanalysed data set taken in the years 1999 and 2000 reproduces the initially published spectrum.The solid curve represents a possible intrinsic (source) 7-ray spectrum, and the dashed and dot-dashed curves represent the observed spectrum after intergalactic absorption for the 1999/2000 and 2002 measurements, respectively. The data set taken in 2002 is compatible with the 1999/2000 data with a flux level reduced by a factor of 2.5.
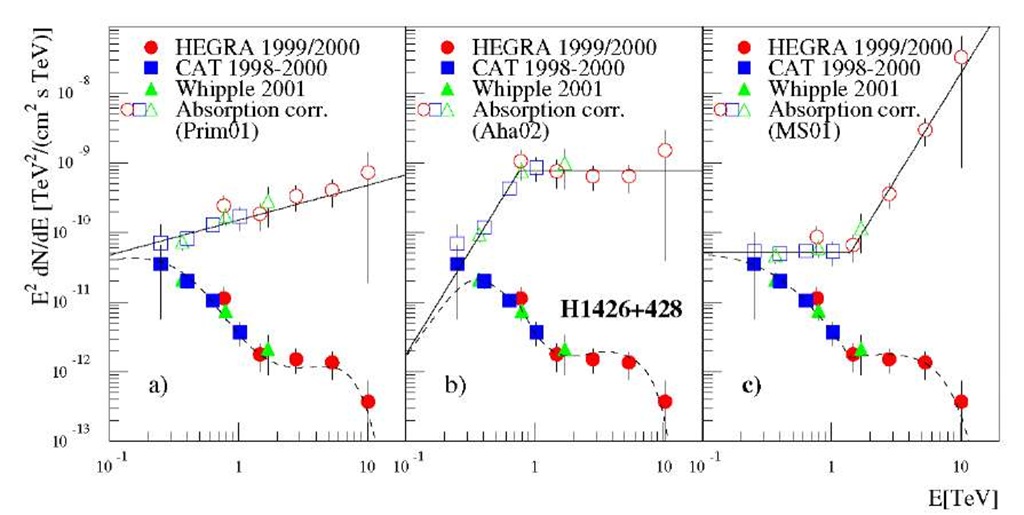
For any reasonable CIB model, the absorption effect is at least factor of 10 or, more likely, factor of 100 (see Fig.10.10). This implies not only significant deformation of the primary spectrum, but also very large TeV luminosity of the source. The spectrum of Y-rays detected by HEGRA, CAT and Whipple has a quite unusual shape – it is steep below 1 TeV, but becomes flat above 1.5 TeV (see Fig. 2.21). However, the source spectra (i.e. the spectra after correction for the intergalactic absorption), look significantly different compared to the observed spectrum. It is demonstrated in Fig. 2.21 for three different models of the diffuse extragalactic background radiation. While for the CIB model suggested by Primack et al. (2001) the intrinsic Y-ray spectrum has a surprisingly "decent" power-law form with a photon index close to 1.5 (Fig. 2.21a), for two other CIB models the reconstructed source spectra have unusual forms with very sharp positive slopes (E2 dN/dE <x E3) below 1 TeV, or above 1 TeV (Fig. 2.21c; for the CIB spectrum suggested by Malkan and Stecker, 2001). Such a strong dependence of the Y-ray source spectra on the CIB model, which is explained by very large optical depth at all energies of detected Y-rays, implies that gamma-ray astronomers are quite close to resolve the diffuse infrared background between 1 an 10 um.
Fig. 2.21 Energy spectra of 1ES 1426+428. The filled symbols indicate the measured fluxes reported by the Whipple, HEGRA and CAT groups, the open symbols — intrinsic fluxes after correction for the intergalactic absorption based on three models of CIB.
This would require, however, significant experimental efforts. In particular, one should be careful when drawing conclusions about the energy spectrum based on a compilation of fluxes obtained by different groups at different observation epochs. Derivation of the energy spectrum from 100 GeV to 10 TeV by a single instrument during a relatively short observation period is a crucial condition for unbiased conclusions concerning the spectral shape of radiation relevant to the well defined states of the source. The low fluxes and the significant variability make this a rather difficult task, which however can be successfully performed with the next generation of IACT arrays. The detection of at least one more object at similar redshift, z ~ 0.1 — 0.15, is highly desirable for conclusions concerning the impact of intergalactic absorption on deformation of the intrinsic Y-ray spectra. And finally, the reduction of the energy threshold down to 100 GeV at which the absorption effect becomes rather small (see Fig.10.10), is another important issue. Observations of 1ES 1426+428 by the MAGIC and VERITAS telescopes and PKS 2155-304 by the CANGAROO-III and H.E.S.S. telescope arrays, promise cosmological information of extraordinary significance about the diffuse extragalactic background at optical and infrared wavelengths.
In any case, this source seems to be a representative of a new class of Y-ray blazars that can be different from both the GeV blazars and the "standard" TeV BL Lac objects. It should be noted, however, that the classification of TeV blazars based on a few detected objects is foolhardy. Therefore, in addition to detailed studies of spectral and temporal characteristics of selected individual objects, the discovery of a large number of new TeV blazars is the second key issue for further development of the field. In this respect, with the arrival of the new generation of IACT arrays, crucial results are expected in the near future. Both the significant improvement of flux sensitivities at TeV energies, and reduction of the energy threshold to 50-100 GeV, should result in a dramatic increase in the statistics of TeV blazars.

![tmp595153_thumb[2] tmp595153_thumb[2]](http://what-when-how.com/wp-content/uploads/2011/08/tmp595153_thumb2_thumb.png)
