Algorithm
Figure 2 provides an overview of the vision-realistic rendering algorithm, comprising three major components.
Constructing the Object Space Point Spread Function
A Point Spread Function (PSF) plots the distribution of light energy on the image plane based on light that has emanated from a point source and has passed through an optical system. Thus it can be used as an image space convolution kernel.
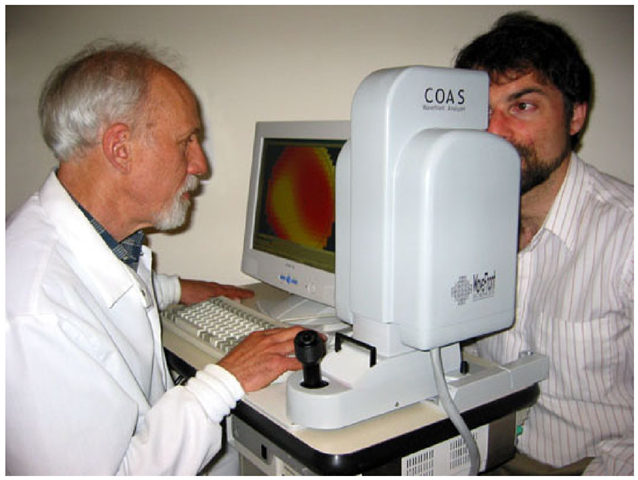
Fig. 3. Measuring the specific vision characteristics of a subject using a Shack-Hartmann wavefront aberrometry device
We introduce the object space point spread function (OSPSF), which is similar to the usual image space point spread function, as described above, except that it is defined in object space and thus it varies with depth. The OSPSF is a continuous function of depth; however, we discretize it, thereby defining a sequence of depth point spread functions (DPSF) at some chosen depths.
Since human blur discrimination is nonlinear in distance but approximately linear in diopters (a unit measured in inverse meters), the depths are chosen with a constant dioptric spacing AD and they range from the nearest depth of interest to the farthest. A theoretical value of AD can be obtained from the relation θ = pAD, where θ is the minimum subtended angle of resolution and p is the pupil size in meters. For a human with 20/20 visual acuity, θ is 1 min of arc; that is, θ = 2.91 x 10~4 [50, 51].
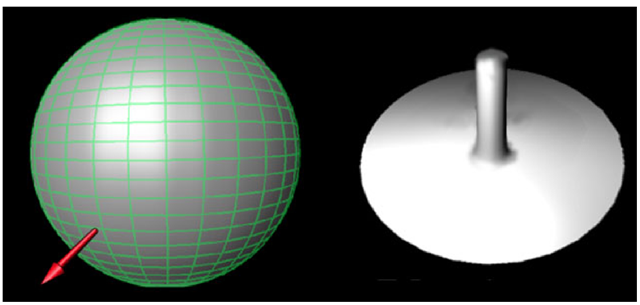
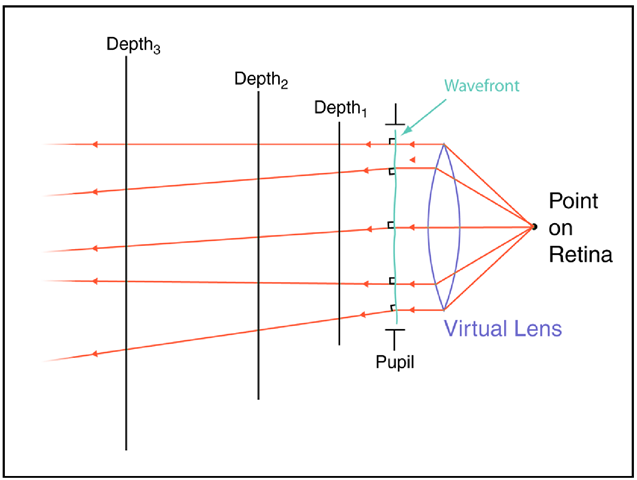
The DPSFs are histograms of rays cast normal to the wavefront (Figure 8). To compute these functions (Figure 9), we first place a grid with constant angular spacing at each of the chosen depths and initialize counters in each grid cell to zero. Then we iteratively choose a point on the wavefront, calculate the normal direction, and cast a ray in this direction. As the ray passes through each grid, the cell it intersects has its counter incremented. This entire process is quite fast and millions of rays may be cast in a few minutes. Finally, we normalize the histogram so that its sum is unity.
In general, wavefront aberrations are measured with the subject’s eye focused at infinity. However, it is important to be able to shift focus for vision-realistic rendering.
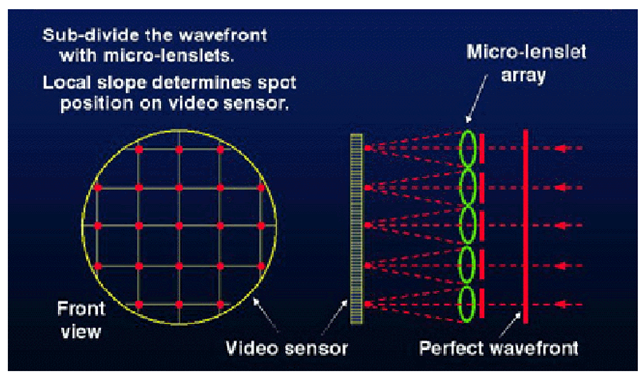
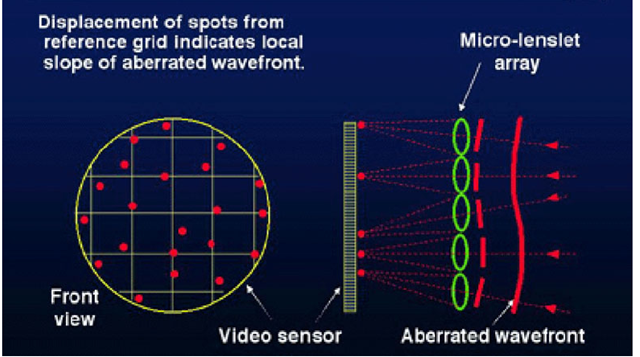
Fig. 4. A side view of a Hartmann-Shack device. A laser projects a spot on the back of the cornea. This spot serves as a point light source, originating a wavefront out of the eye. This wavefront passes through a lattice of small lenslets which focus the wavefront onto a CCD sensor.
Recent research results in optometry [52] showed that aberrations change significantly with accommodation. When aberrometric data is available for the eye focused at the depth that will be used in the final image, our algorithm exploits that wavefront measurement.
In the situation where such data is not available, then we aassume that the aberrations are independent of accommodation. We can then re-index the DPSFs, which is equivalent to shifting the OSPSF in the depth dimension. Note that this may require the computation of DPSFs at negative distances.
We further assume the OSPSF is independent of the image plane location. In optics, this is called the “isoplanatic” assumption and is the basis for being able to perform convolutions across the visual field. For human vision, this assumption is valid for at least several degrees around the fixation direction.
Fitting a Wavefront Surface to Aberrometry Data
The output of the Shack-Hartmann device comprises a ray orientation (normal vector) at each lenslet. Current devices yield only 50 to 200 such vectors. To generate the millions of samples necessary to calculate the OSPSF (see Section 5.1 above), we first generate a smooth mathematical surface representation of the wavefront from this sparse data. Our wavefront surface is a fifth degree polynomial bivariate surface defined as a height field whose domain is the pupil plane. This surface is determined by a least squares fit to the Shack-Hartmann data.
We use a particular polynomial form which was developed in 1934 [54] by the Dutch mathematician and physicist Frits Zernike who was awarded the Nobel Prize in Physics 1953 for discovering the phase contrast phenomenon; for a discussion of Zernkie polynomials realted to the optical aberrations of eyes, the reader is referred to [53].
Fig. 5. Hartmann-Shack sensors measuring a perfect eye with no aberrations.
Fig. 6. Hartmann-Shack sensors measuring a normal eye with some aberrations.
Zernike polynomials are derived from the orthogonalization of the Taylor series. The resulting polynomial basis corresponds to orthogonal wavefront aberrations. The coefficients Zmn weighting each polynomial have easily derived relations with meaningful parameters in optics. The index m refers to the aberration type, while n distinguishes between individual aberrations within a harmonic. For a given index m, n ranges from —m to m in steps of two. Specifically, Z0 0 is displacement, Z11 is horizontal tilt, Z1—1 is vertical tilt, Z2 0 is average power, Z2 2 is horizontal cylinder, Z2 —2 is oblique cylinder, Z3 n are four terms (n = —3, —1,1,3) related to coma, and Z4 n are five terms (n = —4, —2,0,2,4) related to spherical aberration.
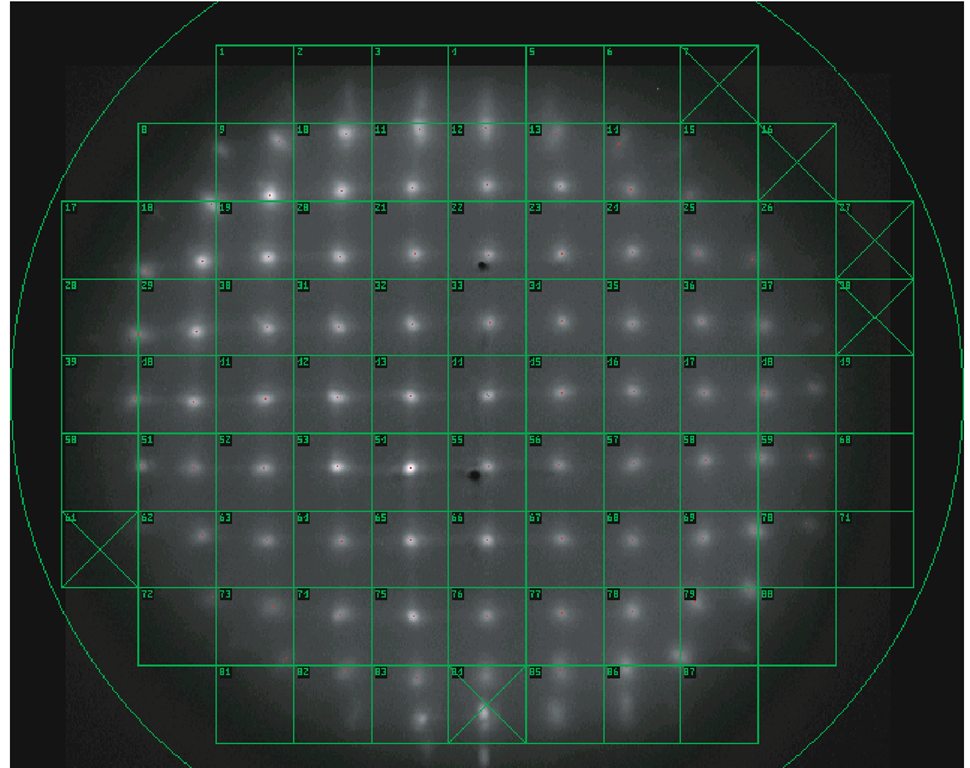
Fig. 7. Hartmann-Shack output lor a sample eye. The green overlay lattice is registered to correspond to each lenslet in the array.
Rendering Steps
Given the input image and its associated depth map, and the OSPSF, the vision-realistic rendering algorithm comprises three steps: (1) create a set of depth images, (2) blur each depth image, and (3) composite the blurred depth images to form a single vision-realistic rendered image.
Create Depth Images. Using the depth information, the image is separated into a set of disjoint images, one at each of the depths chosen in the preceding section. Ideally, the image at depth d would be rendered with the near clipping plane set to d + AD/2 and the far clipping plane set to d — AD/2. Unfortunately, this is not possible because we are using previously rendered images and depth maps. Complicated texture synthesis algorithms would be overkill here, since the results will be blurred anyway. The following technique is simple, fast, and works well in practice: For each depth, d, those pixels from the original image that are within AD/2 diopters of d are copied to the depth image. We handle partial occlusion by the techniques described in Section 6 and in more detail by Barsky et al. [7] [8].
Fig. 8. Each depth point spread function (DPSF) is a histogram of rays cast normal to the wavefront
Fig.9. A simplified view: Rays are cast from a point light source on the retina and pass through a virtual lens, thereby creating the measured wavefront. This wavefront is sampled and rays are cast normal to it. The DPSFs are determined by intersecting these rays at a sequence of depths.
Blur each Depth Image. Once we have the depth images, we do a pairwise convolution: Each depth image is convolved with its corresponding DPSF, thereby producing a set of blurred depth images.
Composite. Finally, we composite these blurred depth images into a single, vision-realistic rendered image. This step is performed from far to near, using alpha-blending following alpha channel compositing rules.
