Abstract. The graph cut framework presents a popular energy minimization tool. In order to be able to minimize contour length dependent energy terms an appropriate metric approximation has to be embedded into the graph such that the cost of every cut approximates the length of a corresponding contour under a given metric. Formulas giving a good approximation have been introduced by Boykov and Kolmogorov for both Euclidean and Riemannian metrics. In this paper, we improve their method and obtain a better approximation in case of the Euclidean metric. In our approach, we combine the well-known Cauchy-Crofton formulas with Voronoi diagrams theory to devise a general method with straightforward extension from 2D to 3D space. Our edge weight formulas are invariant to mirroring and directly applicable to grids with anisotropic node spacing. Finally, we show that our approach yields smaller metrication errors in both the isotropic and anisotropic case and demonstrate an application of the derived formulas to biomedical image segmentation.
Introduction
Graph cuts were originally developed as an elegant tool for interactive image segmentation [1] with applicability to N-D problems and allowing integration of various types of regional or geometric constraints. Nevertheless, they quickly emerged as a general technique for solving diverse computer vision and image processing problems [4]. Particularly, graph cuts are suitable to find global minima of certain classes of energy functionals [8] frequently used in computer vision in polynomial time [3]. Among others, these may include energy terms dependent on contour length or surface area. This is due to Boykov and Kolmogorov [2] who proved that despite their discrete nature graph cuts can approximate any Euclidean or Riemannian metric with arbitrarily small error and derived the requisite edge weight formulas.
In the following text, we focus on the Euclidean metric as it is essential for graph cut based minimization of many popular energy functionals such as the Chan-Vese model for image segmentation [6,10]. One of the main drawbacks of the formulas derived in [2] is that they assume isotropic node spacing in the underlying grid of pixels/voxels which is a limitation in some fields. For instance, volumetric images produced by optical microscopes often have notably lower resolution in the z axis than in the xy plane. Hence, before processing it is necessary to either upsample the z direction which substantially increases computational demands or downsample the xy plane which causes loss of information. The last option is to simulate the anisotropy using a more general Riemannian metric. Unfortunately, it turns out that the corresponding formulas have significantly larger approximation error. Once again, this error can be reduced only for the price of slower and more memory intensive computation taking into account larger neighbourhood.
In this paper, we show how to overcome the above mentioned problem and derive the weights required for the approximation of the Euclidean metric on anisotropic grids directly. For this purpose, we follow the method of [2] and exploit the well-known Cauchy-Crofton formulas from integral geometry. However, several amendments allow us to obtain a better approximation. Namely, we employ Voronoi diagrams theory to calculate the partitioning of angular orientations of lines which is required during the discretization of the Cauchy-Crofton formulas. This, among other things, makes our approximation invariant to image mirroring. Moreover, we show that our approach has much smaller metrication error, especially in the case of small neighbourhood or large anisotropy and that under specific conditions it is better even in the isotropic case.
The paper is structured as follows. The notation and known results are briefly reviewed in Section 2. In Section 3 we present our contribution and derive the formulas giving an improved approximation of the Euclidean metric on both 2D and 3D grids. Section 4 contains detailed discussion of the approximation error and gives example of an application of our results to biomedical image segmentation. We conclude the paper in Section 5.
Cut Metrics
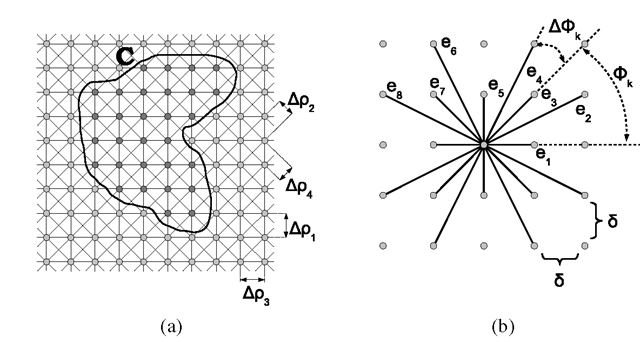
Consider an undirected graph G embedded in a regular orthogonal 2D grid with all nodes having topologically identical neighbourhood system and with isotropic node spacing δ. Example of such grid graph with 8-neighbourhood system is depicted in Fig. 1a. Further, let the neighbourhood system N be described by a set of vectors N = {e1,…, en}. We assume that the vectors are listed in the increasing order of their angular orientation![]() We also assume that vectors ek are undirected (we do not differentiate between ek and -ek) and shortest possible in given direction, e.g., 16-neighbourhood would be represented by a set of 8 vectors N16 = {e1,…, e8} as depicted in Fig. 1b. Finally, we define the distance between the nearest lines generated by vector ek in the grid as pk (for the 8-neighbourhood these are depicted in Fig. 1a).
We also assume that vectors ek are undirected (we do not differentiate between ek and -ek) and shortest possible in given direction, e.g., 16-neighbourhood would be represented by a set of 8 vectors N16 = {e1,…, e8} as depicted in Fig. 1b. Finally, we define the distance between the nearest lines generated by vector ek in the grid as pk (for the 8-neighbourhood these are depicted in Fig. 1a).
Let us assume that each edge ek is assigned a particular weight w£k and imagine we are given a contour C as shown in Fig. 1a. This contour naturally divides the nodes of the graph into two groups based on whether they lie inside or outside the contour. A cut C is defined as the set of all edges joining the inner nodes with the outer ones. The cut cost \C\g is the sum of the weights of the cut edges. The question stands whether it is possible to set the weights w£k so that the cost of the cut approximates the Euclidean length \C\k of the contour. Since algorithms for finding minimum cuts constitute well studied part of combinatorial optimization [3] this would allow us to effectively find globally minimal contours or surfaces satisfying certain criterion.
The technical result of [2] answers the question positively. Based on the Cauchy-Crofton formula from integral geometry the weights for a 2D grid should be set to:
Fig. 1. (a) 8-neighbourhood 2D grid graph. (b) 16-neighbourhood system on a grid with isotropic node spacing δ.
The whole derivation of the formula is omitted here, so is the extension to 3D grids. Both are being explained in more detail in the remaining text. Nevertheless, as already suggested in the introduction Euclidean metric is not the only one that can be approximated using graph cuts. The complete set of metrics that can be approximated via graph cuts has been described in [7].
Proposed Euclidean Metric Approximation
Up until now we have assumed that the grid graph has isotropic node spacing δ. To devise an improved approximation, it is important to investigate what happens in the anisotropic case.
2D Grids
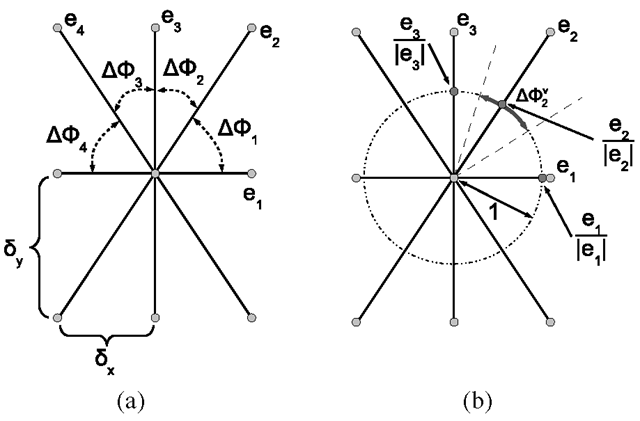
Consider an undirected graph G embedded in a regular orthogonal 2D grid with all nodes having topologically identical neighbourhood system. However, let the spacing of the grid nodes be δχ and δν in horizontal and vertical directions, respectively. Otherwise the whole notation remains unchanged. Example of an 8-neighbourhood system over an anisotropic grid is depicted in Fig. 2a.
Now, consider the Cauchy-Crofton formula that links Euclidean length \C\ε of contour C with a measure of a set of lines intersecting it:
where L is the space of all lines and nc(l) is the number of intersections of line l with contour C. Every line in a plane is uniquely identified by its angular orientation φ and distance ρ from the origin. Thus, the formula can be rewritten in the form:
Fig. 2. (a) 8-neighbourhood system on a grid with anisotropic node spacing. (b) Computation of ![]() in case of the 8-neighbourhood system.
in case of the 8-neighbourhood system.
and discretized by partitioning the space of all lines according to the neighbourhood system
where i enumerates lines generated by vector ek. Further, let be the total number of intersections of contour C with all lines generated by vector ek. We obtain:
From the last equation it can be seen that if we set
then according to [2] it holds that
Finally, as pointed out in [2] the distance between the closest lines generated by vector ek in the grid equals to:
and if we substitute Eq. 8 into Eq. 6 we obtain the aforementioned Eq. 1.
So far we have followed the method of [2]. However, when δχ = δν this approach has a serious flaw. One may notice that in the example depicted in Fig. 2a edges e2 and e4 will be assigned different weights because But this
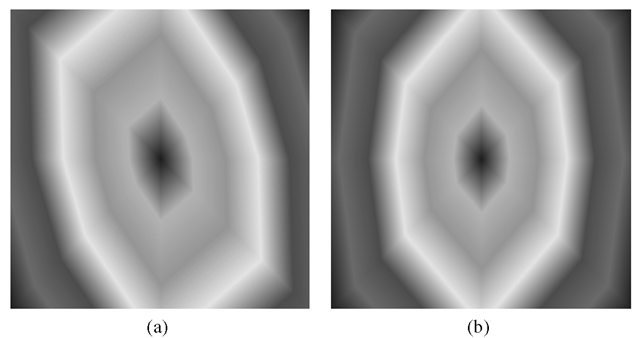
means that if we mirror the contour horizontally we may obtain a different cut cost. Hence, edge weights derived this way are not invariant to mirroring, which is rather inconvenient property causing additional bias of the approximation. In practice, this would cause the skewed distance map depicted in Fig. 3a. In fact, this bias is present in the isotropic case as well, but not for all neighbourhoods. For instance, in the 16-neighbourhood depicted in Fig. 1b edges e2 and e8 will be assigned different weights and it indeed has a negative effect on the approximation as we will show in the following section.
This can be avoided using a different partitioning of the space of all angular orientations. In 2D this space is represented by a unit circle. To obtain a smarter partitioning we introduce a new symbol which can be interpreted as a measure of lines closest to ek in terms of their angular orientation. The computation is done as follows. Let
  be a set of points lying on a unit circle. We calculate the Voronoi diagram of S on the 1D circle manifold and define
 to be the length of the Voronoi cell (circular arc) corresponding to point
 . The whole process is depicted in Fig. 2b. It reduces to the following formula in 2D:
Putting this together with Eq. 6 and Eq. 8 the final edge weights for a 2D grid with possibly anisotropic node spacing are calculated as:
Such edge weights still follow the distribution of the angular orientations of lines generated by vectors in N but in a smarter way causing the approximation to be invariant to mirroring while not breaking the convergence of the original approach at the same time.
3D Grids
In three dimensions the contour C is replaced by a surface C2 and the graph G is embedded in a regular orthogonal 3D grid with δχ, δν and δζ spacing between the nodes in x, y and z directions, respectively, with all nodes having topologically identical 3D neighbourhood system (e.g., 6-, 18- or 26-neighbourhood).
This time Apk expresses the “density” of lines generated by vector ek. It is calculated by intersecting these lines with a plane perpendicular to them and computing the area of cells in the obtained 2D grid of points. It can be easily computed using this formula:
Each vector ek is now determined by two angular orientations![]() corresponding to the partitioning of the unit sphere among the angular orientations of vectors in N. In fact, this formulation is rather vague and it is unclear how to calculate
corresponding to the partitioning of the unit sphere among the angular orientations of vectors in N. In fact, this formulation is rather vague and it is unclear how to calculate ![]() the way it is being described in [2]. Particularlybecause for almost all common 3D neighbourhoods (e.g., 18- or 26-neighbourhood) the distribution of the angular orientations is not uniform (this stems from the fact, that it is not possible to create a Platonic solid for such number of points).
the way it is being described in [2]. Particularlybecause for almost all common 3D neighbourhoods (e.g., 18- or 26-neighbourhood) the distribution of the angular orientations is not uniform (this stems from the fact, that it is not possible to create a Platonic solid for such number of points).
Fig. 3. Distance maps generated by a cut metric over an anisotropic grid where![]() and
and
8-neighbourhood is used. (a) Result generated using a biased cut metric. (b) Result generated using our mirroring-invariant approximation.
The cost of a cut is analogously defined as the sum of the weights of the edges joining grid nodes enclosed by the surface C2 with those lying outside and the goal is to set the weights w£k so that the cost of the cut approximates the area of the surface under the Euclidean metric. The Cauchy-Crofton formula for surface area in 3D is:
and using the same derivation steps as in the case of 2D grids yields the following edge weights:
The problem with the clarity of![]() is addressed easily by extending our concept of Voronoi diagram based weights .
is addressed easily by extending our concept of Voronoi diagram based weights . Let
Let be a set of points this time lying on a unit sphere. We calculate the Voronoi diagram of S on the 2D sphere surface manifold and define
 to be the area of the Voronoi cell corresponding to point
 This is a general and explicit approach that can be used for any type of neighbourhood. Unfortunately, the spherical case can not be reduced to a simple formula. To compute the spherical Voronoi diagram we recommend to use the convex hull based method described in [5]. Putting this all together we end up with the final formula for 3D anisotropic grids:
To conclude this section, this approach can be theoretically generalized to arbitrary number of dimensions. In the general N-D case one would have to calculate Voronoi diagram of points on a hypersphere to get ΑφνΊ weights. The adjustment of Apk is straightforward.
Fig. 4. Multiplicative metrication error (in percents) for several combinations of neighbourhood system and anisotropy ratio in 2D. A comparison of the proposed approach and the original method of Boykov and Kolmogorov [2] is presented.


![Multiplicative metrication error (in percents) for several combinations of neighbourhood system and anisotropy ratio in 2D. A comparison of the proposed approach and the original method of Boykov and Kolmogorov [2] is presented. Multiplicative metrication error (in percents) for several combinations of neighbourhood system and anisotropy ratio in 2D. A comparison of the proposed approach and the original method of Boykov and Kolmogorov [2] is presented.](http://what-when-how.com/wp-content/uploads/2012/06/tmp5839326_thumb.png)
