Demand Characteristics of Visual Encoding
A primary goal of visual encoding is to determine the nature and motion of the objects in the surrounding environment. In order to plan and coordinate actions, we need a functional representation of the scene layout and of the spatial configuration and the dynamics of the objects within it both in the picture plane and in depth. The properties of the visual array, however, have a metric structure entirely different from those of the spatial configuration of the objects. Physically, objects consist of aggregates of particles that cohere together. Objects may be rigid or flexible, but in either case, an invariant set of particles is connected to form a given object. The visual cues (such as edges or gradients) conveying the presence of objects to the brain or to artificial sensing systems, however, share none of these properties. The visual cues conveying the presence of objects may change in luminance or color, and they may be disrupted by reflections or occlusion by intervening objects as the view point changes. The various cues such as shading, texture, color binocular disparity, edge structure, and motion vector fields may even carry inconsistent object information. As exemplified by the dodecahedron drawn by Leonardo da Vinci (Figure 9.1a), any of these cues may be sparse, with a lack of information about the object structure across gaps where cues are missing. Also, any cue may be variable over time. Nevertheless, despite the sparse, inconsistent, and variable nature of the local cues, we perceive solid, three-dimensional (3D) objects by interpolating the sparse depth cues into coherent spatial structures generally matching the physical configuration of the objects.
In the more restricted domain of the surface structure of objects in the world, surfaces are perceived not just as flat planes in two dimensions, but as complex manifolds in three dimensions. Here we are using “manifold” in the sense of a continuous two-dimensional (2D) subspace of the 3D Euclidean space. A compelling example of perceptual surface completion, developed by Tse (1999), depicts an amorphous shape wrapping a white space that gives the immediate impression of a 3D cylinder filling the space between the curved shapes (Figure 9.1b). Within the enclosed white area in this figure, there is no information, either monocular (shading, texture gradient, etc.) or binocular (disparity gradient), about the object structure. Yet our perceptual system performs a compelling reconstruction of the 3D shape of a cylinder, based on the monocular cues of the black border shapes. This example illustrates the flexibility of the surface-completion mechanism in adapting to the variety of unexpected demands for shape reconstruction.
FIGURE 9.1 (a) Dodecahedron drawn by Leonardo da Vinci (1509). (b) Volumetric completion of the white surface of a cylinder (Reprinted with permission from Tse, 1999.) Note the strong three-dimensional percepts generated by the sparse depth cues in both images.
It is important to stress that such monocular depth cues as those in Figure 9.1 provide a perceptually valid sense of depth and encourage the view that the 3D surface representation is the primary cue to object structure.Objects in the world are typically defined by contours and local features separated by featureless regions (such as the design printed on a beach ball, or the smooth skin between facial features). Surface representation is an important stage in the visual coding from image registration to object identification. It is very unusual to experience objects (even transparent objects), either tactilely or visually, except through their surfaces. Developing a means of representing the proliferation of surfaces before us is therefore a key stage in the neural processing of objects.
Theoretical Analysis of Surface Representation
The previous sections indicate that surface reconstruction is a key factor in the process of making perceptual sense of visual images of 2D shapes, which requires a midlevel encoding process that can be fully implemented in neural hardware. A full understanding of neural implementability, however, requires the development of a quantitative simulation of the process using neurally plausible computational elements. Only when such a computation has been achieved can we be assured that the subtleties of the required processing have been understood.
Surface reconstruction has been implemented by Sarti, Malladi, and Sethian (2000) and by Grossberg, Kuhlmann, and Mingolla (2007) as a midlevel process operating to coordinate spatial and object-based attention into view-invariant representations of objects. The basic idea is to condition the three types of inputs as sparse local depth signals into the neural network, and allow the output to take the form of a surface in egocentric
This surface smoothness limit has now been validated by Nienborg et al. (2004) in cortical cells, indicating the relevance of a surface-level reconstruction of the depth structure even in primary visual cortex. Once the depth structure is defined for each visual modality alone (e.g., luminance, disparity, motion), the integration of the corresponding cues should be modeled by Bayesian methods in relation to the estimated reliability of each cue to determine a singular estimate of the overall 3D structure in the visual field confronting the observer.
The concept of surface representation requires a surface interpolation mechanism to represent the surface in regions of the field where the information is undefined. Such interpolation is analogous to the “shrink-wrapping” of a membrane around an irregular object such as a piece of furniture.
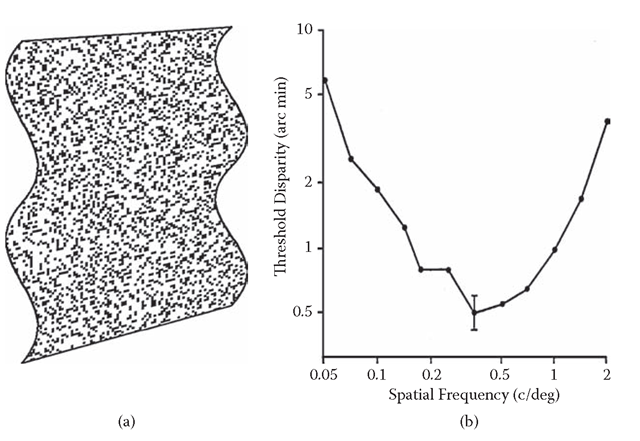
FIGURE 9.2 (a) Depiction of a random-dot surface with stereoscopic ripples. (b) Thresholds for detecting stereoscopic depth ripples, as a function of the spatial frequency of the ripples.Peak sensitivity (lowest thresholds) occurs at the low value of 0.4 cycle/deg (2.5 deg/cycle), implying that stereoscopic processing involves considerable smoothing relative to contrast processing.
Whereas a (2D) receptive-field summation mechanism shows a stronger response as the amount of stimulus information increases, the characteristic of an interpolation mechanism is to increase its response, or at least not decrease its response, as stimulus information is reduced and more extended interpolation is required. (Of course, a point will be reached where the interpolation fails and the response ultimately drops to zero.)
Once the object surfaces have been identified, we are brought to the issue of the localization of the object features relative to each other, and relative to those in other objects. Localization is particularly complicated under conditions where the objects could be considered as “sampled” by overlapping noise or partial occlusion—the tiger behind the trees, the face behind the window curtain. However, the visual system allows remarkably precise localization, even when the stimuli have poorly defined features and edges.Furthermore, sample spacing is a critical parameter for an adequate theory of localization. Specifically, no low-level filter integration can account for interpolation behavior beyond the tiny range of 2 to 3 arc min in foveal vision (Morgan and Watt, 1982), although the edge features of typical objects, such as the form of a face or the edges of a computer monitor, may be separated by blank regions of many degrees. Thus, the interpolation required for specifying the shape of most objects is well beyond the range of the available filters. This limitation poses an additional challenge in relation to the localization task, raising the “long-range interpolation problem” that has generated much interest in relation to the position coding for extended stimuli, such as Gaussian blobs and Gabor patches (Morgan and Watt, 1982; Hess and Holliday, 1992; Levi, Klein, and Wang, 1994).
Need for 3D Surface Representation
One corollary of the surface reconstruction approach is a postulate that the object array is represented strictly in terms of its surfaces, as proposed by Nakayama and Shimojo (1990). Numerous studies point to a key role of surfaces in organizing the perceptual inputs into a coherent representation. Norman and Todd (1998), for example, show that discrimination of the relative depths of two visual field locations is greatly improved if the two locations to be discriminated lie in a surface rather than being presented in empty space. This result is suggestive of a surface level of interpretation, although it may simply be relying on the fact that the presence of the surface provides more information about the depth regions to be assessed. Nakayama, Shimojo, and Silverman (1989) provide many demonstrations of the importance of surfaces in perceptual organization. They show that recognition of objects (such as faces) is much enhanced where the scene interpretation allows them to form parts of a continuous surface rather than isolated pieces, even when the retinal information about the objects is identical in the two cases. This study also focuses attention on the issue of border ownership by surfaces perceived as in front of rather than behind other surfaces. Although their treatment highlights interesting issues of perceptual organization, it offers no insight into either the neural or computational mechanisms by which such structures might be achieved.
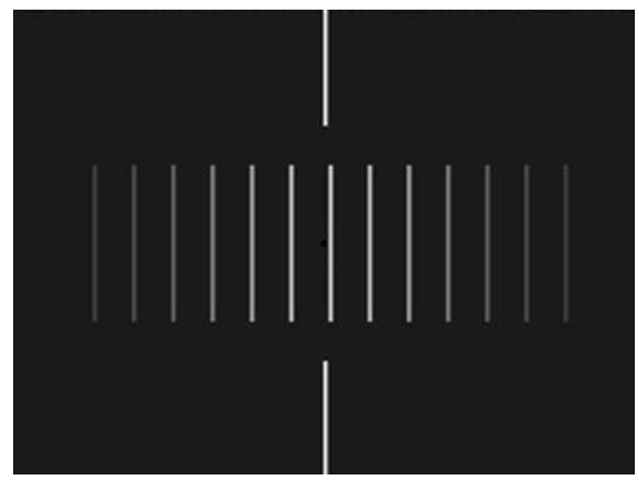
A key issue raised by the small scale of the local filters for position encoding is the mechanism of long-range interpolation.This sampled paradigm is a powerful means for probing the properties of the luminance information contributing to shape perception. Surprisingly, the accuracy of localization by humans is almost independent of the sample spacing. The data showed that as few as two to three samples are all the information about a 1° Gaussian bulge that could be processed by the visual system. Adding further samples (by increasing sampling density) had no further effect on the discriminability of the location of the Gaussian, as long as the intersample spacing was beyond the 3 arc min range of the local filters. Kontsevich validated the surprisingly local prediction of this limit, finding that localization performance was invariant for spacing ranging from 30 down to 3 arc min separation, but showed a stepwise improvement (to Vernier levels) once the sample spacing came within the 3 arc min range. Sample positions were randomized to prevent them from being used as the position cue.
FIGURE 9.3 Sampled Gaussian luminance profile used to study long-range interpolation processes.
The implication to be drawn from this study is that some long-range interpolation mechanism is required to determine the shape of extended objects before us (because the position task is a form of shape discrimination). The ability to encode shape is degraded once the details fall outside the range of the local filters. However, the location was still specifiable to a much finer resolution than the sample spacing, implying the operation of an interpolation mechanism to determine the location of the peak of the Gaussian despite the fact that it was not consistently represented within the samples.
The conclusions from this work are that (1) the interpolation mechanism was inefficient for larger sample numbers, because it used information from only two to three samples even though up to 10 times as many samples were available; (2) the interpolation mechanism could operate over the long range to determine the shape and location of the implied object to a substantially higher precision than the spacing of the samples (~6 arc min); and (3) the mechanism was not a simple integrator over the samples within any particular range.
Evidence for a Functional Role of 3D Surface Representation
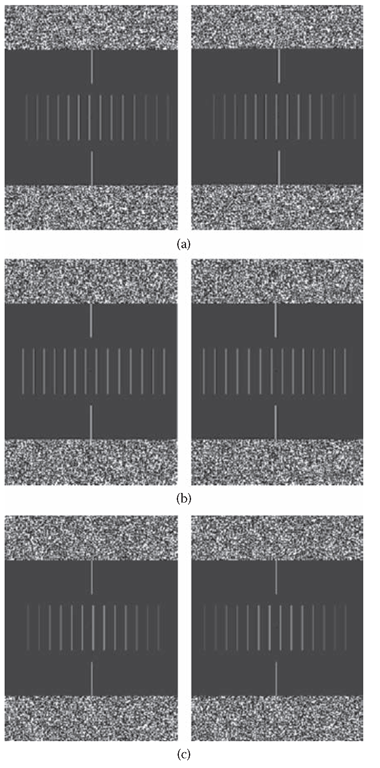
The luminance of the sample lines carried the luminance profile information (Figure 9.4a), and the disparity in their positions in the two eyes carried the disparity profile information (Figure 9.4b)”. In this way, the two separate depth cues could be combined or segregated as needed. Both luminance and disparity profiles were identical Gaussians, and the two types of profiles were always congruent in both peak position and width.
Figure 9.4 Stereograms showing examples of the sampled Gaussian profiles used in the Likova (2003) experiment, defined by (a) luminance alone, (b) disparity alone, and (c) a combination of luminance and disparity. The pairs of panels should be free-fused to obtain the stereoscopic effect.
Observers were presented with the sampled Gaussian profiles defined either by luminance modulation alone (Figure 9.4a), by disparity alone (Figure 9.4b), or by a combination of luminance and disparity defining a single Gaussian profile (Figure 9.4c). The observer’s task was to make a left/right judgment on each trial of the position of the joint Gaussian bulge relative to a reference line, using whatever cues were available. Threshold performance was measured by means of the maximum-entropy Y staircase procedure.It should be noticeable that the luminance profile evokes a strong sense of depth as the luminance fades into the black background. If this is not evident in the printed panels, it was certainly seen clearly on the monitor screens. Free fusion of Figure 9.4b allows perception of the stereoscopic depth profile (forward for crossed fusion). Figure 9.4c shows a combination of both cues at the level that produced cancellation to flat plane under the experimental conditions. The position of local contours is unambiguous, but interpolating the peak, corresponding to reconstructing the shape of someone’s nose to locate its tip, for example, is unsupportable.
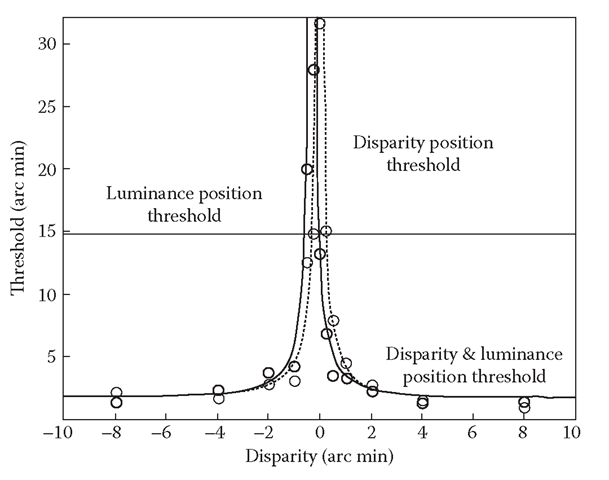
Localization from disparity alone was much more accurate than from luminance alone, immediately suggesting that depth processing plays an important role in the localization of sampled stimuli (see Figure 9.5, gray circles). Localization accuracy from disparity alone was as fine as 1 to 2 arc min, requiring accurate interpolation to localize the peak of the function between the samples spaced 16 arc min apart. This performance contrasted with that for pure luminance profiles, which was about 15 arc min (Figure 9.5, horizontal line). Combining identical luminance and disparity Gaussian profiles (Figure 9.5, black circles) provides a localization performance that is qualitatively similar to that given by disparity alone (Figure 9.5, gray circles). Rather than showing the approximation to the lowest threshold for any of the functions predicted by the multiple-cue interpolation hypothesis, it again exhibits a null condition where peak localization is impossible within the range measurable in the apparatus. Contrary to the multiple-cue hypothesis, even with full luminance information, the peak position in the stimulus becomes impossible to localize as soon as it is perceived as a flat surface. This null point can only mean that luminance information, per se, is insufficient to specify the position of the luminance profile in this sampled stimulus. The degradation of localization accuracy can be explained only under the hypothesis that interpolation occurs within a unitary depth-cue pathway.
FIGURE 9.5 Typical results of the position localization task. The gray circles are the thresholds for the profile defined only by disparity; the black circles are the thresholds defined by disparity and luminance. The dashed gray line shows the model fit for disparity alone; the solid line shows that for combined disparity and luminance, as predicted by the amount of disparity required to null the perceived depth from luminance alone.The horizontal line shows threshold for the pure luminance. Note the leftward shift of the null point in the combined luminance/disparity function.
Perhaps the most startling aspect of the results in Figure 9.5 is that position discrimination in sampled profiles can be completely nulled by the addition of a slight disparity profile to null the perceived depth from the luminance variation. It should be emphasized that the position information from disparity was identical to the position information from luminance on each trial, so addition of the second cue would be expected to reinforce the ability to discriminate position if the two cues were processed independently. Instead, the nulling of the luminance-based position information by the depth signal implies that the luminance target is processed exclusively through the depth interpretation. Once the depth interpretation is nulled by the disparity signal, the luminance information does not support position discrimination (null point in the solid curve in Figure 9.5).
This evidence suggests that depth surface reconstruction is the key process in the accuracy of the localization process. It appears that visual patterns defined by different depth cues are interpreted as objects in the process of determining their location.
Evidently, the full specification of objects in general requires extensive interpolation to take place, even though some textured objects may be well defined by local information alone. The interpolated position task may therefore be regarded as more representative of real-world localization of objects than the typical Vernier acuity or other line-based localization tasks of the classic literature. It consequently seems remarkable that luminance information, per se, is unable to support localization for objects requiring interpolation. The data indicate that it is only through the interpolated depth representation that the position of the features can be recognized. One might have expected that positional localization would be a spatial form task depending on the primary form processes (Marr, 1982). The dominance of a depth representation in the performance of such tasks indicates that the depth information is not just an overlay to the 2D sketch of the positional information. Instead, it seems that a full 3D depth reconstruction of the surfaces in the scene must be completed before the position of the object is known.
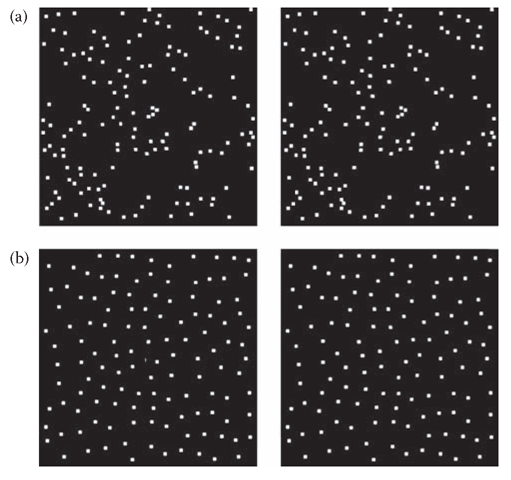
The samples may be in the form of a random-dot pattern constrained (Figure 9.6b) to a minimum dot spacing of half the average dot spacing (in all directions). Thus, the samples carrying the luminance, disparity, and motion information will always be separated by a defined distance, preventing discrimination by local filter processing. The shape/position/orientation information therefore has to be processed by some form of interpolation mechanism. Varying the luminance of the sample points of the type of Figure 9.6b in the same Gaussian shape generates the equivalent luminance figure, and such sampled figures can be used to generate the equivalent figure for structure-from-motion (cf, Regan and Hamstra, 1991, 1994; Regan, Hajdur, and Hong, 1996).
Figure 9.6 (a) Stereopair of a Gaussian bulge in a random-dot field. It should be viewed with crossed convergence. (b) Similar stereopair in two-dimensional sampled noise with a minimum spacing of 25 pixels. Note the perceived surface interpolation in these sampled stereopairs, and that the center of the Gaussian is not aligned with the pixel with the highest disparity.

