Abstract
This paper presents a network monitoring framework with an intuitive visualization engine. The framework leverages a kernel method with spatial and temporal aggregated IP flows for the off/online processing of Netflow records and full packet captures from ISP and hon-eypot input data and is operating on aggregated Netflow records and is supporting network management activities related to the anomaly and attack detection.
Keywords: Netflow records, Visualization, Kernel Function, Honeypot.
Introduction
The business of network monitoring has been studied a lot and still, there are a lot of problems to be solved. Problems, as full automation of monitoring processes respectively the evaluation are still challenging. Network incidents may have most different natures, i.e. attacks, component failures or unusual user activities. In most cases, incident evaluation requires strong and fast interpretation skills of network operators, because countermeasures have to be taken quickly. Another challenge is the quantity of available data. Information on network borders are mostly Netflow1 records, which can also be exported by most commercially available routers today, but evaluating these large quantities of Netflow records in real time remains an open issue. A convenient solution is to use condensed forms of packets or to refer to a more novel approach by spatially aggregating flow records over time. In this paper, a new network monitoring framework for on/off-line processing of temporal-spatial aggregated IP flows is described, which aims to detect network incidents/attacks and to visualize them in an intuitive way. For the network monitoring task, a modified version of the Aguri tool [2] is used, which monitors IP flow records and summarizes them into traffic profiles. These traffic profiles are applied to a specific kernel method for evaluation purpose. The kernel function captures topological and traffic changes without having a manual profile comparison. The kernel results are then mapped onto an intuitive image with adaptive colour gradients. To proof the validity of this method, two different data sets were applied to PeekKernelFlows. The first data set is originated from an ISP and the second from an High Interaction Honeypot [10] with a vulnerable ssh-server.
Section 2 describes the different modules of the framework PeekKernelFlows. A short description of IP flow aggregation is given, the kernel method described and the visualization method is explained. In Section 3, the evaluation of the monitoring framework is given. Section 4 presents relevant work in this area and section 5 describes future work and presents the conclusions.
The Monitoring Framework
The following section presents the theoretical components and implemented features of the monitoring framework PeekKernelFlows (see Fig. 1). The routers with Netflow record exporting functionality log Netflow records from the network and store them on the Collector. Then, Netflows are processed by PeekKer-nelFlows, which has four main components. The first module, modifed Aguri, is the monitoring feature, which accepts Netflow records and performs the spatial-temporal aggregation task.
Fig. 1. The Monitoring Framework PeekKernelFlows
The AguriProcessor-module included the kernel calculus model. The AguriViz-module maps the outcomes of the kernel calculus onto an image by referring to an adaptive colour gradient. The AguriUI-module is the interface towards the end-user of the system.
Aggregated Netflow Records in Space Over Time
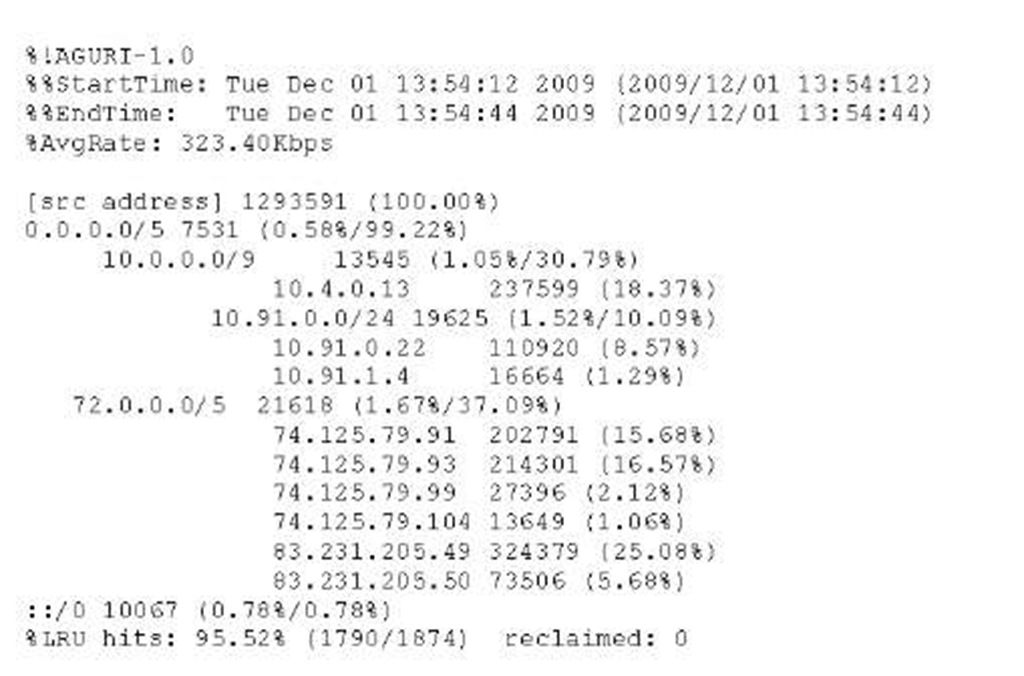
Aguri [2] is a near real-time flow-monitoring tool that spatially aggregates IP flows over time. The advantage is that instead of considering single flow records, an overview on subnet layer can be given due to aggregation. This module has been modified by implementing a custom import interface, such that the input format are Netflow records, called modified Aguri. The spatial-aggregation task is performed by assembling small records into larger ones in prefix based trees. This means, for a time period of n seconds, Aguri generates a traffic profile by spatially summarizing subnets, hosts and traffic volumes. The tool can generate 4 distinct profiles: source address profile, destination address profile, source protocol profile and destination protocol profile. An example for a source address profile is shown in Fig. 3, reflecting the local network activity for 32 seconds in a tree-like structure. By inspecting the Aguri tool, it has been detected that monitored time intervals are not constantly n seconds, but sometimes n + t seconds. A source code analysis showed that the monitoring time period (start and end time) are deduced from packet captures and not based on a simple timing mechanism. A consequence of this is that moments of silence, where no packets are transmitted, are not taken into consideration, such that a time interval becomes n + t seconds.
Digging into Netflow Records with a Kernel Function
Kernel functions are an interesting tool for the evaluation of high dimensional data. Referring to [11], a kernel function is defined as a simple mapping K : X x
![]() [ from input space X to a similarity score
[ from input space X to a similarity score![]()
![]() , where
, where![]() is a feature vector over x. In the module Aguri-Processor, a new kernel function based on topology and traffic volume has been defined to compare Aguri profiles.
is a feature vector over x. In the module Aguri-Processor, a new kernel function based on topology and traffic volume has been defined to compare Aguri profiles.
The kernel function is defined by two kernel function parts. The first part s(a,i,bj) assesses topological changes in the network by considering suffix lengths of nodes (see Eq. 2). The second part v(aj, bj) is a Gaussian kernel treating traffic volume changes in tree nodes (see Eq. 3).
A more comprehensive version of the kernel function is presented in [12]. The kernel function takes as input successive Aguri profiles, i.e. (Ti,T2) and determines the similarity between K(Ti) and K(T2). The higher the K-value, the more similar are the successive trees.
Visualizing Processed Netflow Records
The visualization task has two modules, the AguriViz-module is the mapping of kernel values into an image and the AguriUI-module is the user interface. The main task is the mapping of a kernel function value Ki onto an RGB scheme image. A vector v describing the traffic evolution is created and mapped into a colored rectangle. The colour of the rectangle is a function over a kernel score Ki, where the colour intensity describes the evolution of the network topology and traffic load. An RGB [3]-mapping function is used for the generation of the image. The simplified RGB 3-byte scheme is used, where each byte stands for a different colour. By this, a kernel value Ki is mapped onto the RGB-scheme where the lower bits represent the colour ‘blue’, the next bits are colour ‘green’ and the higher bits are the colour ‘red’. The RGB mapping function ki is defined as
where B is a brightness factor providing a higher decimal precision of a kernel value Ki. I is an intensity factor to linearly shift the kernel values in the RGB-space for better visibility. The rectangles are sequentially mapped onto the image that is defined as a 2-dimensional space having a (x, y) coordinate system. The rectangle has a size of rxr pixels. The first rectangle is located in the top left corner of the image having coordinates (x0, y0). The i-th rectangle is placed on coordinates (xi + r, yi). When inserting a line break, coordinates for x are reset to 0 and for y are incremented by the rectangle height r. To have an actual view of the network traffic, a freshness parameter r has been introduce for the image,
where n is the time window for exporting Aguri trees and height, width the image size. This freshness parameter has been introduced, because the data window size impacts the image freshness, so a small window means fresher images, whereas for large data windows an image reflects an network evolution overview.
The main interests are first, the detection if a host performs scanning on other systems or, if there are dominant (i.e. like ssh-brute force attack) respectively long-lasting TCP sessions on the network and secondly, to get insights into the traffic to a host.
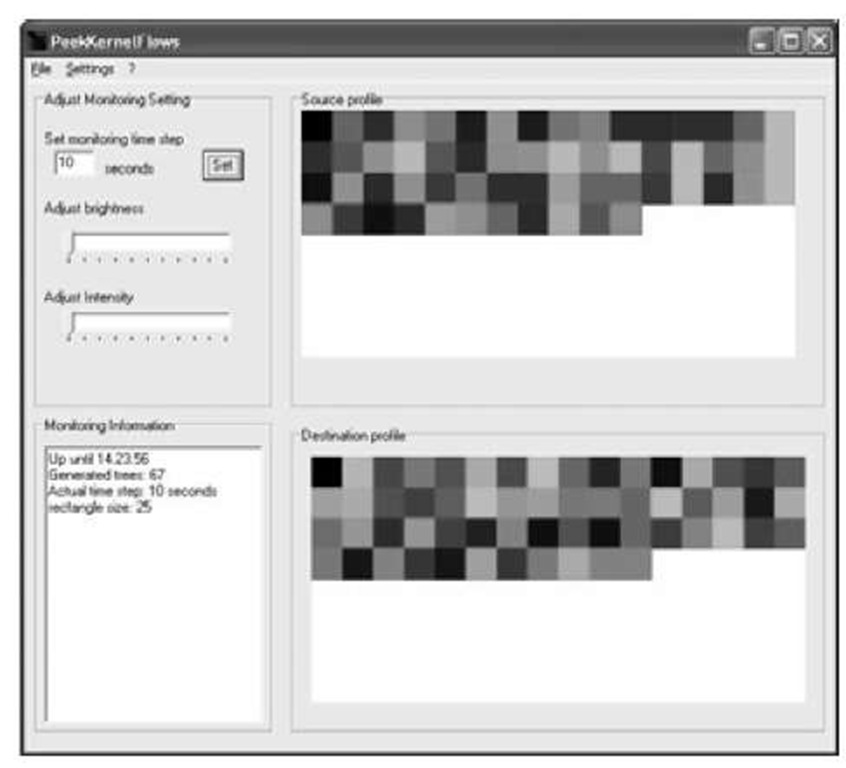
The AguriUI-module represents the outcomes of the AguriViz-module on a visual user interface. It shows the outcomes for the Aguri source profiles as well as the outcomes for the destination profiles. Different configuration parameters can be realized on this interface by a network operator. The graphical representation looks similar to a Self-Organizing-Map, but is only a simple graphical representation. A representation of the AguriUI-module is shown in Fig. 2. The different parameters can be adjusted by the network operator, like the monitoring time for Aguri profiles (n), Brightness (B) or Intensity (I). Additionally, statistical information in text-form has been added.
Fig. 2. PeekKernelFlows GUI
Fig. 3. Aguri Profile Tree
Experimental Results
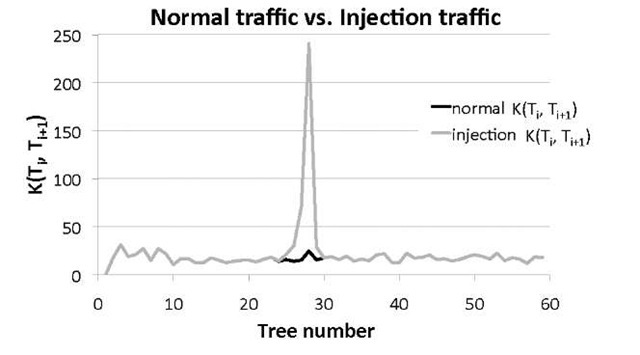
For the experimental part, two different data sets have been used to evaluate the framework PeekKernelFlows. The first data set, uses Netflow records from an ISP and the second data set is from an honeypot [10], both are given in Table 1. In the experiments, Aguri parameters have been set as such: Aguri-profile generation n set to n= 5 seconds and the aggregation threshold t = 1%, to give a fine-grained view of the network. In the first part, only source profiles generated by Aguri have been used. Different tests for the accuracy evaluation and performance for the kernel function have been done. In Fig. 4, the influence of the kernel function by adding hosts to the network can be seen. It can be distinguished between normal traffic on the network and an injection attack, where hosts are added to the network, represented by the peek value. By studying different cases of incidents on networks, it can be illustrate that a kernel function per se can be helpful in the identification of network incidents. To validate the kernel function performance, a clustering algorithm called K.-T.R.A.C.E [1] has been used. The aim is to classify kernel function values obtained from the network traffic into attacks or benign traffic. The K.-T.R.A.C.E algorithm is a an iterative k — means algorithm variant, supporting a revised method of T.R.A.C.E. (Total Recognition by Adaptive Classification Experiments).
Table 1. ISP Network Monitoring Data Set Description
|
ISP data set |
Honeypot data set |
||
|
Average number of nodes |
42 |
Number of addresses |
47 523 |
|
Number of flows |
3733680 |
Exchanged TCP packets |
1 183 419 |
|
Total bytes |
19.36G |
Operation time |
24 hrs |
|
Global capture duration |
300 s |
Used Bandwidth |
64 Kbits/s |
|
Average bandwidth |
528Mbit/s |
Colour (bit) |
24 |
Fig. 4. Normal Traffic vs. Traffic with Injected Nodes
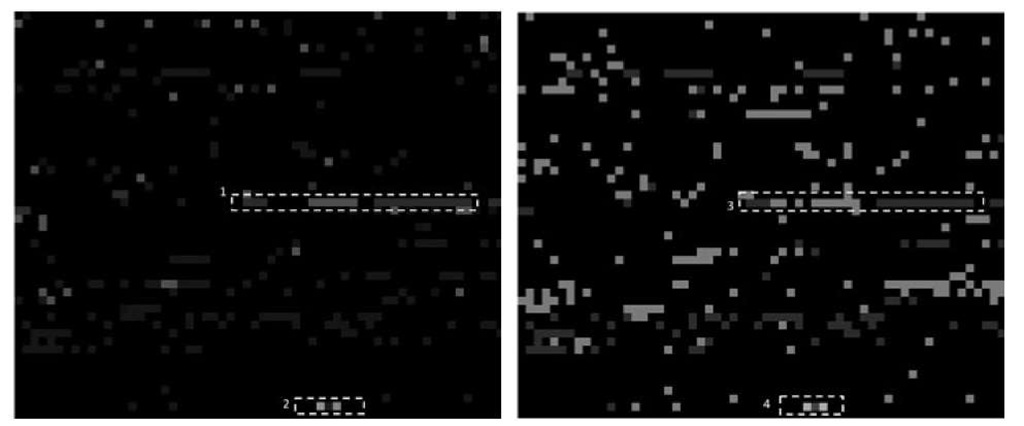
Fig. 5. PeekKernelFlows Results for Source (left) and Destination (right) Profile
It is a supervised learning algorithm that estimates k barycenters for each class and data is assigned to a class such that the Euclidean distance to a barycenter is minimal. The K.-T.R.A.C.E input are similarity scores estimated by the kernel function![]() By adjusting the different parameters in the kernel function, classification results between 77 to 98% were obtained.
By adjusting the different parameters in the kernel function, classification results between 77 to 98% were obtained.
In the second data set, a high interaction honeypot exposing a vulnerable ssh-server for 1-day on a public IP-address has been operated and logged. Fig. 5 summarizes the graphical evaluation of the honeypot data set for source (left picture) and destination (right picture) profiles. The picture resolutions are 1 200×1 000 pixels, Aguri kernel values have a 20 x 20 pixels size each and the monitoring time is n = 5 seconds. A figure holds 4 000 Aguri trees, the equivalent of 4 hours monitoring. To validate the visual results, a manual investigation of the data set has been additionally realized. A problem of manual investigations is that a honeypot is under most different attacks, which can generate a lot of noise in the data set. In the visual traffic representation a lot of ‘noise’ can be observed by looking at the black rectangles in the images. From a kernel function perspective this means that Aguri trees are thoroughly different, whereas a ‘white’ colour in the image means similar Aguri profiles.
Common attacks on honeypots are brute-force attacks against the honey-pot or attacks compromising the honeypot in order to control the system or to scan/launch new attacks against other targets. In the graphical representation, four relevant patterns can be seen in Fig. 5 for the source profile (left). By help of a manual exploration of the Netflow record data set, the three successive ‘green’ lines, annotated by 1 represent ssh brute-force attacks. In the bottom of the source profile representation a ‘coloured’ line, annotated by 2 can interpreted as scanning activities of the operated honeypot against other hosts. For the scanning activities it has been observed that attackers nearly used the full available bandwidth for scanning entire sub-networks. These activities can be observed because the scanning activities last over a longer time period inducing that more Aguri profiles have similar structures.
The destination profile image (Fig. 5 right) gives a more fine-grained overview about the targets of the attacker. The same pattern as for the source profile on the left figure, annotated by 3 and 4 can be observed, which represent the communication intensity of both parties. Different patterns as the coloured segments (4) represent the durations of the attackers stay at a dedicated target and the amount of exchanged traffic. Another observation is that dominant TCP sessions, like ssh brute-force attacks, are represented in intense colours, whereas scanning activities are represented by dark colours. This can be explained by the used kernel function, which has a dominant topological kernel part in the volume/traffic part. It is shown that PeekKernelFlows can first detect anomalies by the evaluation of the kernel function and then easily represent them on the visual interface for the network operators.
Related Work
Netflow records are commonly used in network monitoring activities. A feature is that they can be generated for most different traffic types. Since most commercially available routers support netflow exports today, costs have been cut a lot. The main drawback of Netflow records is the storage or the mechanisms for online analysis. While introducing Netflow sampling [7], the problem is partially solved, but finding good sampling rates remains difficult. In recent past, a lot of significant progress has been made in the evaluation of Netflow data, pure statistics have been replaced by complex machine learning techniques as Flow Mining [9] or kernel methods. The analysis of Netflow records is time-consuming, complex and error prone. To facilitate network operators duty, it is often referred to visualization for the analysis of large scale data. Goodall et al. [5] present a visualization tool for port usage, called FlowViz. Their tool refers to a rectangle coloration technique, such that the idea of rectangles is similar to our, but we refer to a mapping of a kernel value onto the RGB-color space. Mans-mann et al. [6] use TreeMaps for their intrusion detection system evaluation.
Glanfield et al. [4] have presented a tool called OverFlow, where flow relationships are represented by concentric circles following flow hierarchies. PeekKer-nelFlows respects flow hierarchies by using Aguri, but we focus more on the differences between flows over time. A first version of the theoretical analysis of PeekKernelFlows is presented in [12], where a game-theory driven model has been used to assess the performance of the framework. Furthermore, in [12] different attack strategies and defense measures are described, as for example the manipulation of traffic load or hidden attacks. Nevertheless, a detailed and complete overview of this framework has not been described yet.
Conclusion
In this paper, a framework called PeekKernelFlows, for the evaluation of spatial and temporarily aggregated Netflow records has been presented. PeekKer-nelFlows uses a kernel function that maps Aguri trees onto a similarity score that is further mapped onto the RGB color-space in on/off-line mode. Furthermore the visualization technique has a an easily understandable outcome representation. A limitation of PeekKernelFlows is that by generating too much noise, an attacker can not be detected anymore. To improve PeekKernelFlows, in future work a new method for the spatial aggregation of Netflow records is planned and the Human-Machine interaction increased by implementing additional features like zoom or decisional features.


