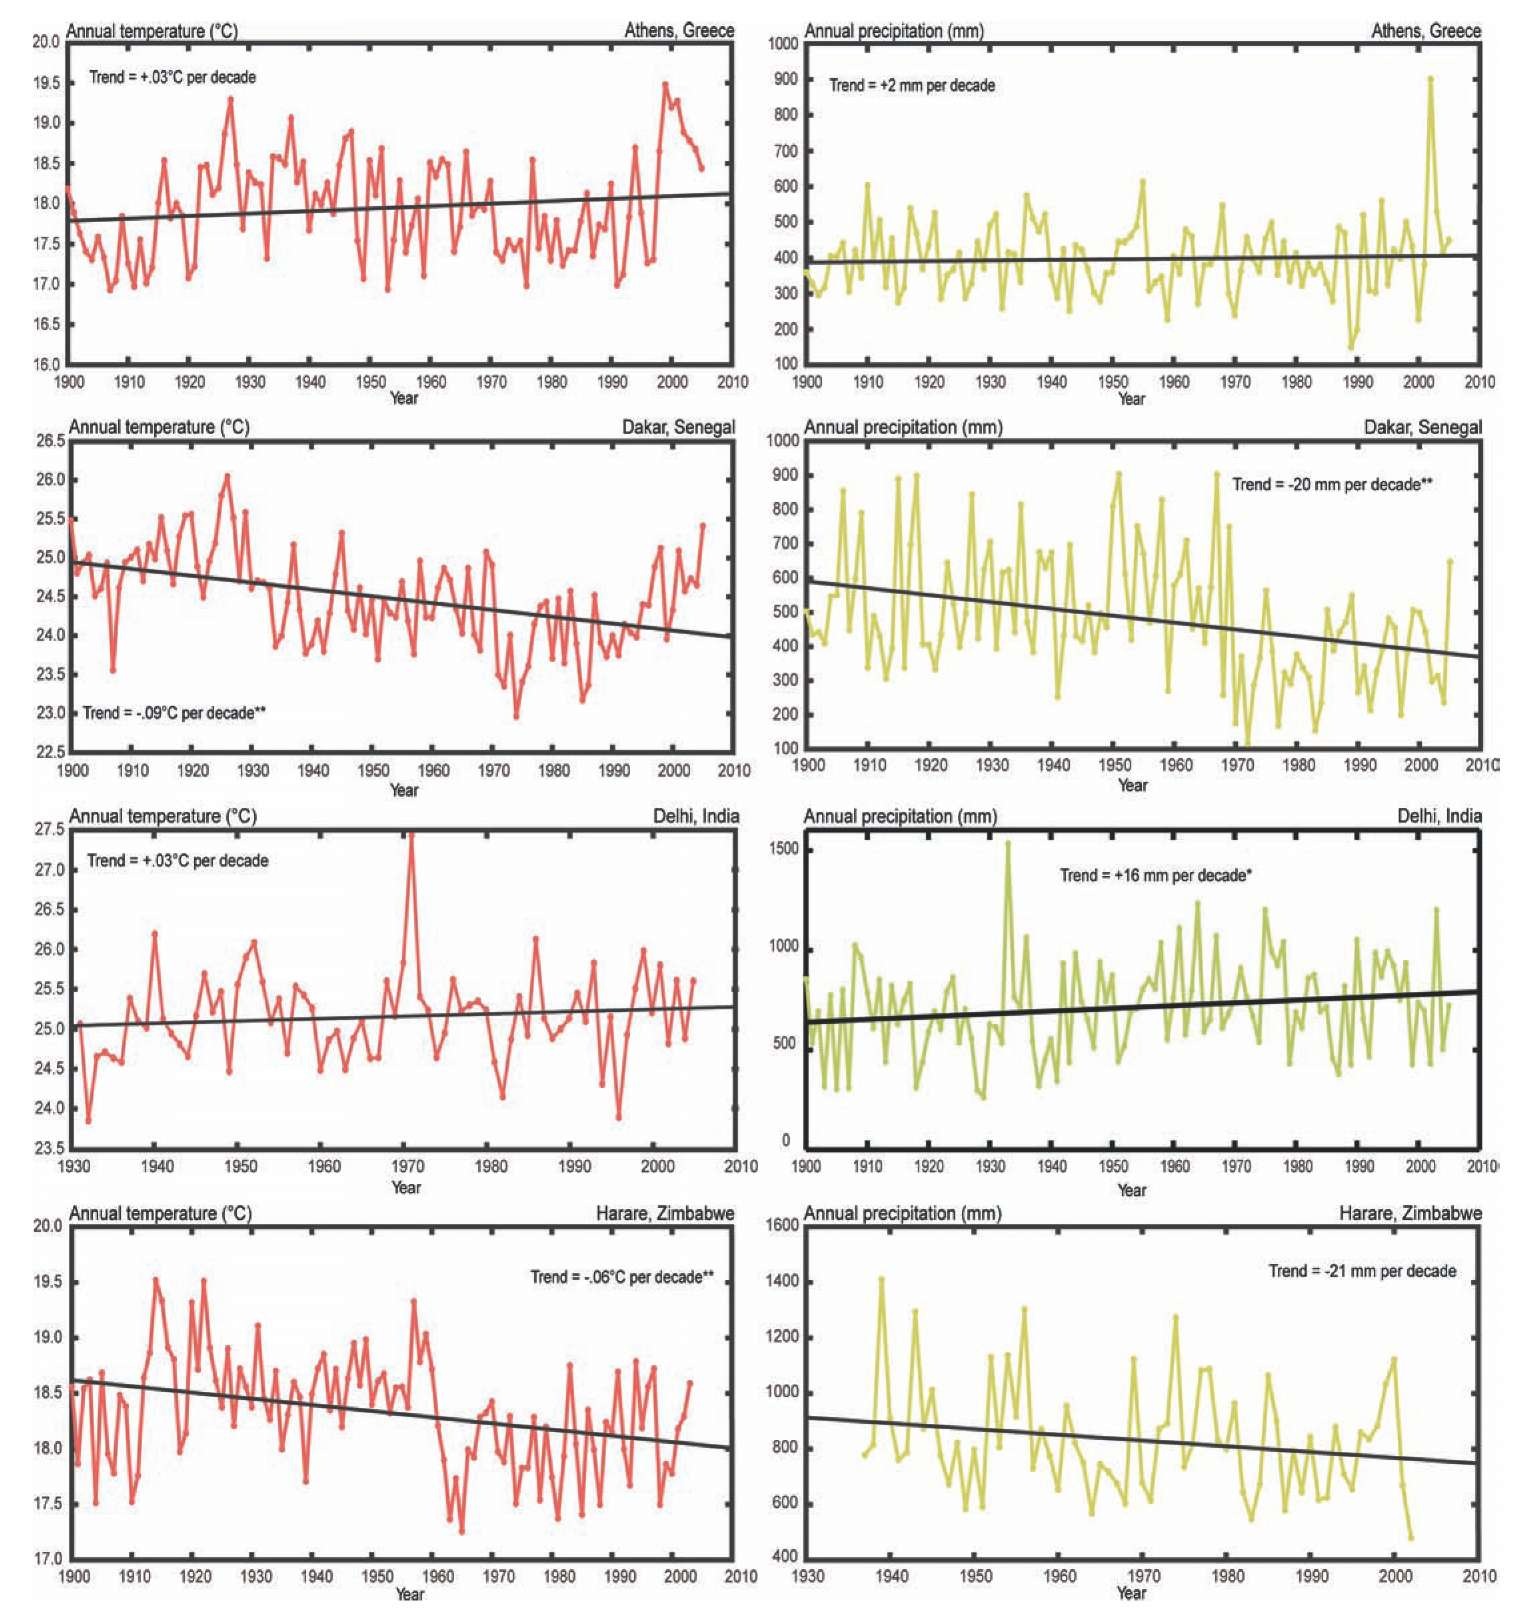
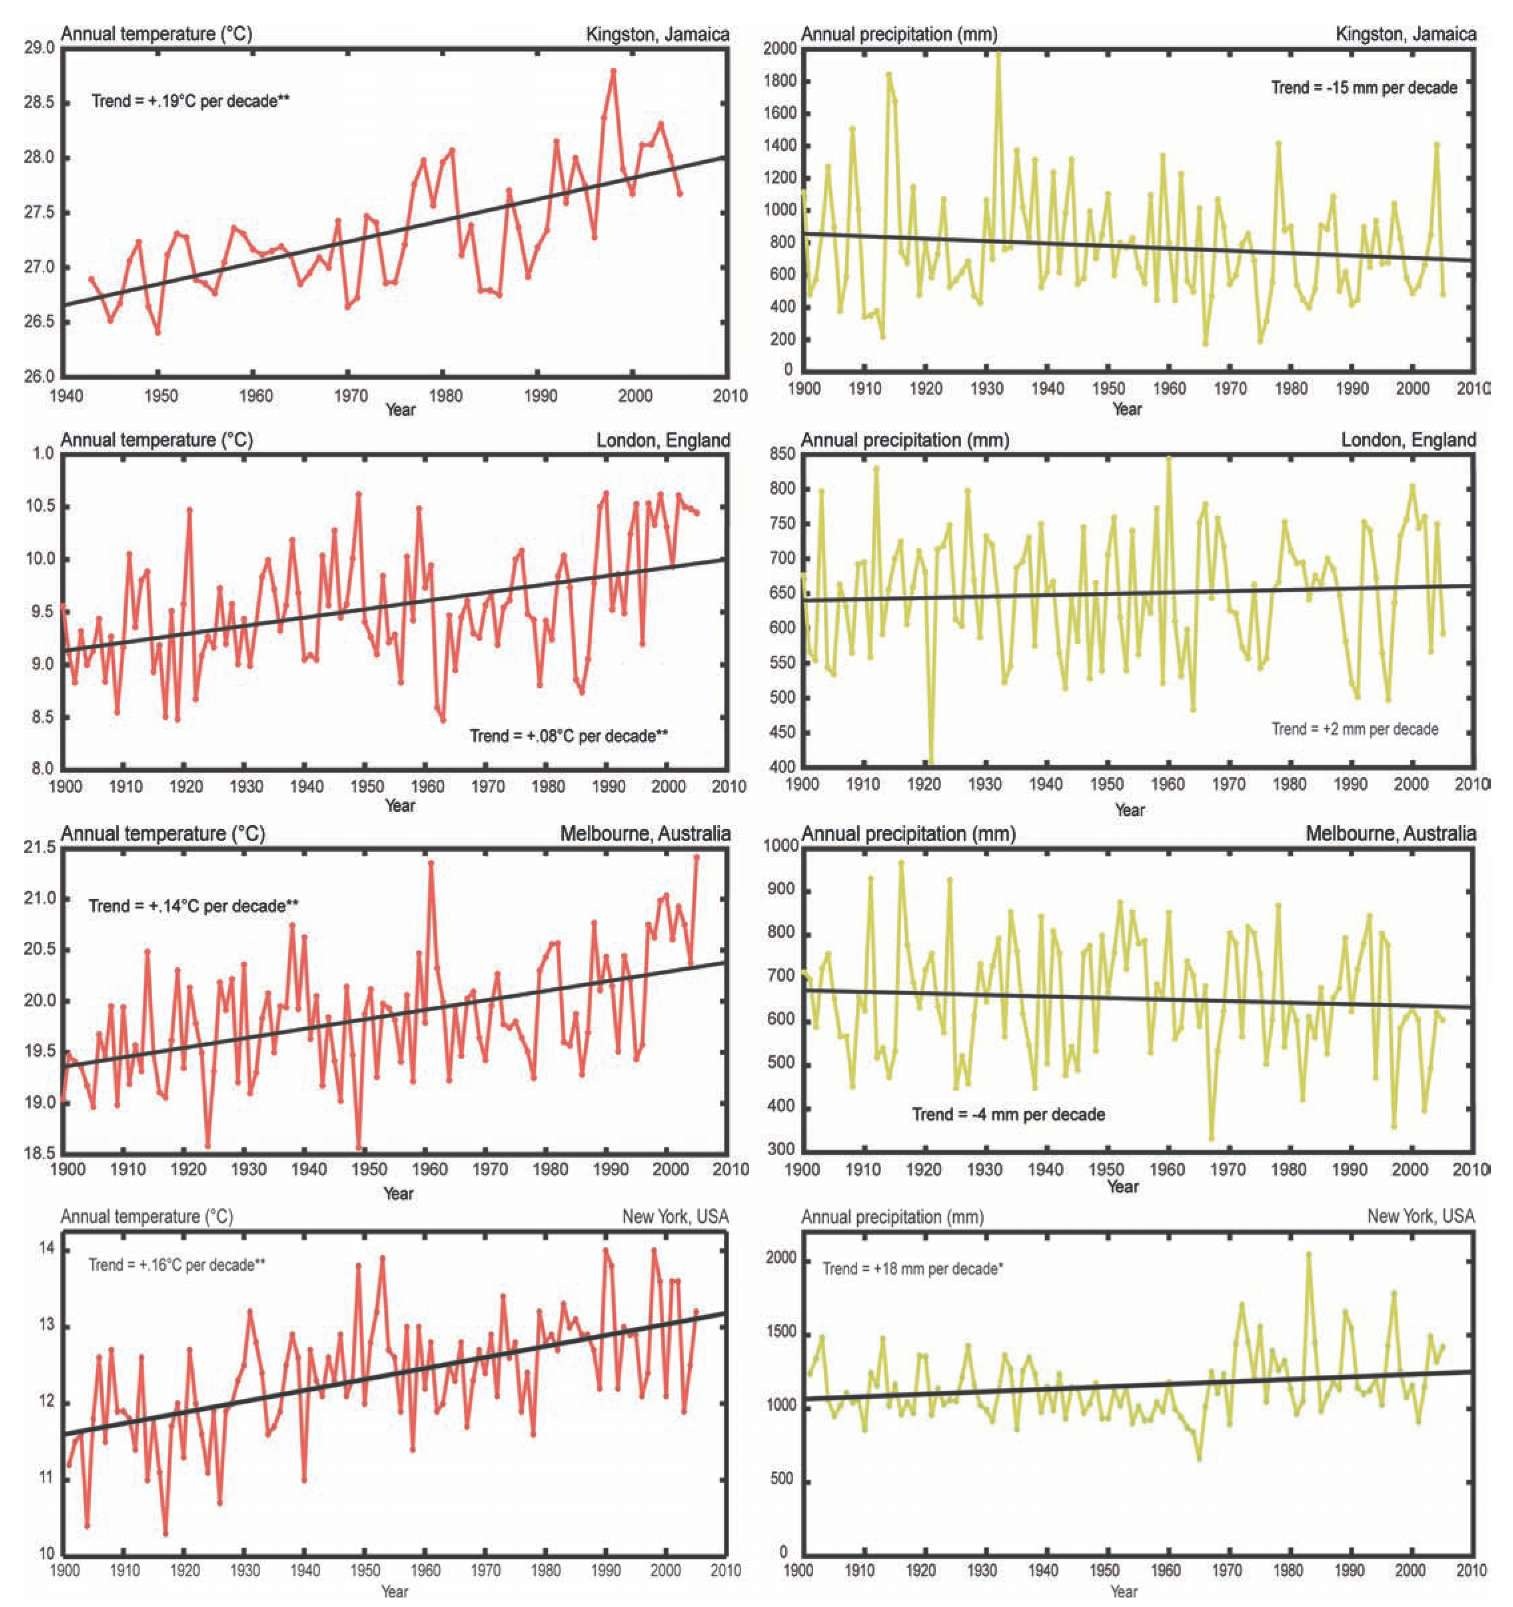
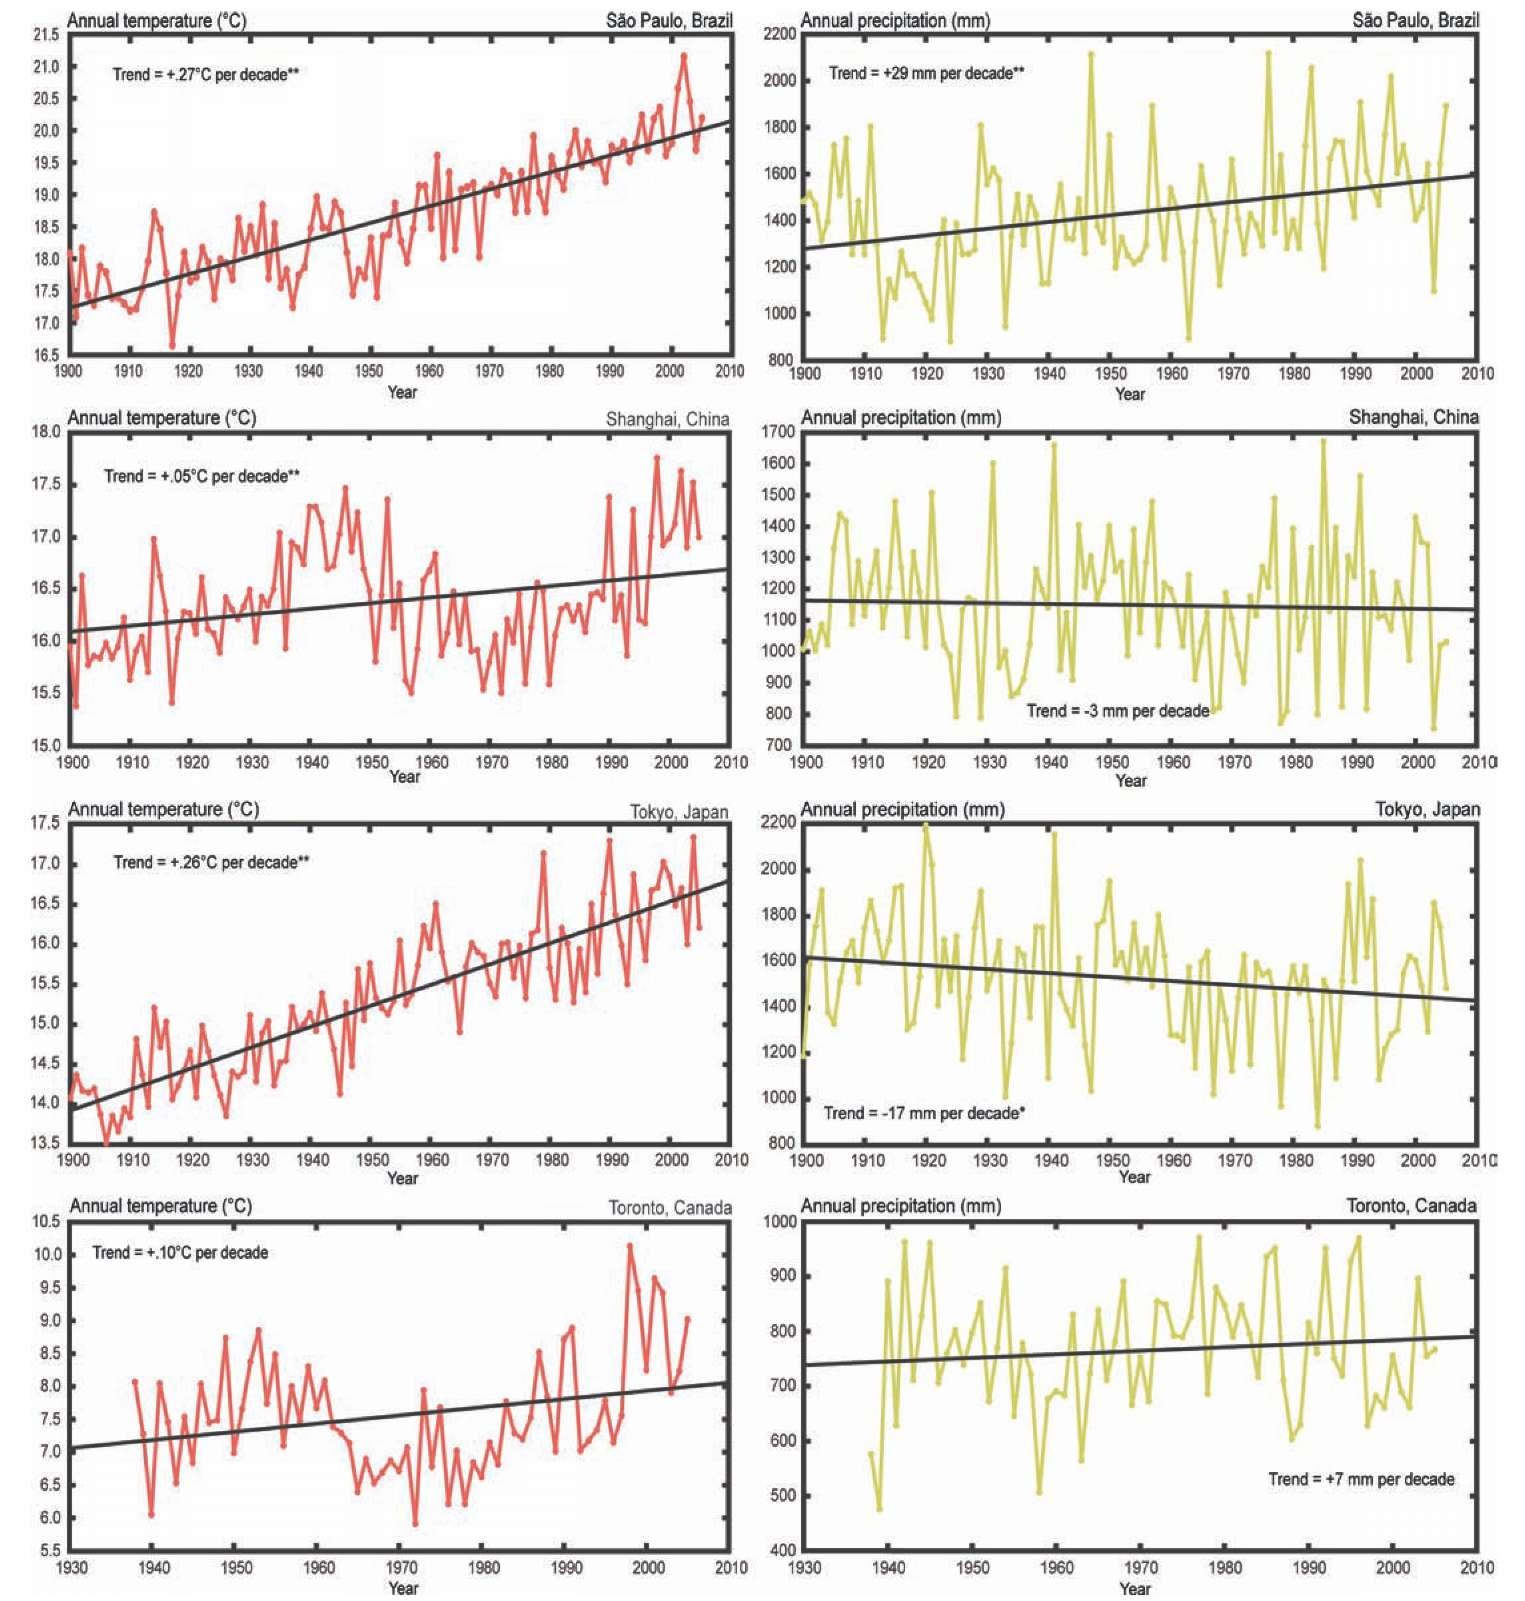
We present observed long-term climate data for the 12 cities to evaluate whether there are long-term trends. The urban heat island effect that may exist in each case should in principle be captured by the urban weather stations used. The selected cities include a wide range of climate zones. Tropical cities such as Dakar are characterized by warm temperatures throughout the year. The mid-latitude cities, in contrast, all experience a continental climate, with large temperature differences between summer and winter seasons. Some cities such as Delhi have a monsoonal climate, with the majority of the precipitation occurring during one part of the year, while other cities such as New York experience substantial precipitation during all months. These differences in background climate can be thought of as the foundation for the unique blend of climate change hazards each city faces, since climate changes are superimposed on a city’s baseline climate.
Over the past century, there have been significant observed trends in climate hazards including annual mean temperature, annual precipitation, and extreme events, such as heat waves and intense precipitation, at global scales (IPCC, 2007). Trend analyses are a first step towards attributing changes to factors ranging from variability to greenhouse gases, to changes in the urban environment.
The observed annual temperature and precipitation values for each city were computed using a monthly data set.1 The months in the data set that were missing were replaced by the climatolog-ical average for that month over the full time series for the city. The period over which the observed trends were analyzed was 1900 to 2005 unless otherwise noted. For the temperature trends, the following cities did not have data sets running the entire length of this period; Toronto (1938-2005), Delhi (1931-2005), Kingston (1943-2005), and Harare (1900-2002). For the precipitation trends, Toronto (1938-2005) and Harare (1937-2002). A brief city-by-city summary for observed trends in temperature and precipitation is shown in Table 3.2. The statistical significance of the trends is also included. Graphs of the observed climate data for each of the 12 cities are shown in Figure 3.10.
Temperature
Observations of annual mean temperature are used to determine whether or not a city is experiencing warming or cooling. In addition to mean temperature, maximum temperature and minimum temperature can also be used to identify changes in the climate. For these variables, finer temporal scales (daily data) are useful for analysis of observed climate trends. However, because of the limited data records for some cities, obtaining climate data on these small timescales can be difficult. These additional temperature variables can also be used in the analysis of extreme climate events, including hot days and heat waves.
For the 12 cities that were selected for the topic, observed trends in annual mean temperature showed warming in 10 of the cities. Over the past century the most rapid rate of warming has occurred in Sao Paulo. The city had a trend of +0.27 °C per decade. The two cities that showed cooling (temperatures decreasing over the time period) were in Africa. Dakar and Harare had observed trends in annual mean temperature of -0.09 °C and -0.06 °C respectively. However, for these two cities, while the overall trend is negative, both have seen warming in the past two decades.
Table 3.2: Observed climate trends in cities.
|
City |
Years |
Number of missing months |
Temperature trend ( °C per decade) |
|
Athens |
1900-2005 |
15 |
0.03 |
|
Dakar |
1900-2005 |
57 |
-0.09** |
|
Delhi |
1931-2005 |
10 |
0.03 |
|
Harare |
1900-2002 |
44 |
-0.06** |
|
Kingston |
1943-2005 |
59 |
0.19** |
|
London |
1900-2005 |
0 |
0.08** |
|
Melbourne |
1900-2005 |
0 |
0.14** |
|
New York |
1900-2005 |
0 |
0.16** |
|
Sao Paulo |
1900-2005 |
30 |
0.27** |
|
Shanghai |
1900-2005 |
33 |
0.05** |
|
Tokyo |
1900-2005 |
2 |
0.26** |
|
Toronto |
1938-2005 |
4 |
0.10 |
|
City |
Years |
Number of missing months |
Precipitation trend (mm per decade) |
|
Athens |
1900-2005 |
11 |
2 |
|
Dakar |
1900-2005 |
24 |
-20** |
|
Delhi |
1900-2005 |
18 |
16* |
|
Harare |
1937-2002 |
26 |
-21 |
|
Kingston |
1900-2005 |
19 |
-15 |
|
London |
1900-2005 |
0 |
2 |
|
Melbourne |
1900-2005 |
0 |
-4 |
|
New York |
1900-2005 |
0 |
18 |
|
Sao Paulo |
1900-2005 |
16 |
29** |
|
Shanghai |
1900-2005 |
24 |
-3 |
|
Tokyo |
1900-2005 |
2 |
-17* |
|
Toronto |
1938-2005 |
4 |
7 |
Annual temperature and precipitation statistics are computed for all cities using data from the National Climatic Data Center Global Historical Climatology Network (NCDC GHCN v2 ), UK Met Office and Hadley Centre, Australian Bureau of Meteorology, and Environment Canada.
The single star (*) indicates that the trend is significant at the 95 percent level and the double star (**) indicates that trend is significant at the 99 percent level.
Although most of the cities did show a warming trend, the trends in each individual city vary by their rate of change. For example, one city may have had a slow increase for a large part of the twentieth century with a rapid warm up at the end of the period, while another may have seen a moderate increase over the entire time period. Further investigation of the trend for each individual city is necessary to understand the possible causes and potential impacts of warming temperatures. The rate at which the urban heat island is increasing in each city will affect observed temperature trends. For example, approximately one-third of the warming trend in New York City has been attributed to urban heat island intensification (Gaffin et al., 2008). In developing countries, the rate is probably higher (Ren et al., 2007).
Tokyo’s heat island
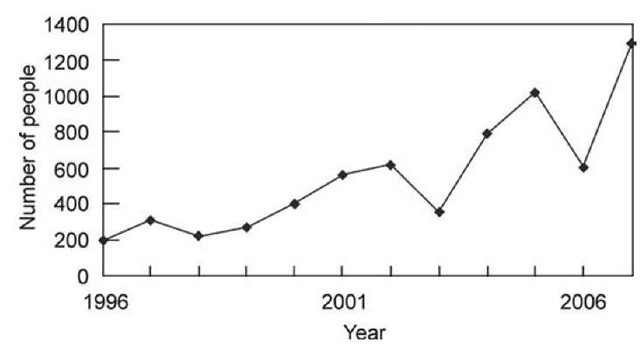
As temperatures rise in Tokyo, residents are experiencing more health problems, including heatstroke and sleeping difficulties. Both are associated with higher nighttime temperatures (Figure 3.11).
Figure 3.10: Observed climate trends in cities. Trends and statistical significance are shown for the data available for the twentieth century (see Table 3.2 for specific years for each city). Note differences in temperature and precipitation scales.
Figure 3.10:
Additional impacts include ecosystem changes such as earlier flowering dates and changes in insect and amphibian populations.
Observed temperature trend in Sao Paulo, Brazil
For the cities chosen for the topic, Sao Paulo had the most rapid rate of increase in mean annual temperature. Over the period from 1900 to 2005, mean temperature in the city rose at a rate of 0.27 °C per decade. Much of the warming is occurring at night, with minimum temperature increasing at a faster rate than maximum temperature. The average of these two variables, maximum and minimum temperatures, is the mean temperature. Sao Paulo’s warming was greater in winter than in summer. Some of the warming in Sao Paulo may be caused by land use changes due to urbanization (Marengo and Camargo, 2008).
Figure 3.10:
The observed warming in mean annual temperature appears to be greatest over approximately the past 20 years, as compared to the 20 years prior to that. Some of this variation between time slices can be explained by changes in the frequency of modes of natural climate variability. ENSO events in recent years coincide with the more rapid rates of warming. In addition, warming temperatures in the South Atlantic Ocean also may influence the warming mean temperatures in Sao Paulo (Marengo and Camargo, 2008).
Figure 3.11: Urban heat island impacts in Tokyo, Japan. The number of people sent to the hosptal with heatstroke has been increasing over time.


