Cities are vulnerable to modes of natural climate variability (that is, not caused by climate change), or preferred oscillations in atmospheric circulation. These preferred oscillations tend to recur at seasonal to multi-year timescales, have somewhat predictable impacts on temperature and precipitation in specific regions, and impact large portions of the planet.
Modes of climate variability centered in one location are able to impact temperature and precipitation in distant regions through a process called teleconnections, whereby wave motions transport energy outward from climate variability source regions along preferred paths in the atmosphere (Hurrel et al, 2003). Natural climate variability can cause significant impacts, for example by influencing the frequency and intensity of extremes of temperature and precipitation. It is, therefore, important for stakeholders to recognize these risks, which may be overlooked when assessing climate hazards associated with long-term global change.
Modes of natural climate variability have some level of forecast predictability, which can help cities prepare for climate extremes associated with the modes. However, many cities, especially in the developing world, lack capacity to make forecasts on their own. It must also be kept in mind that these modes of variability are only responsible for a portion of the temperature and precipitation variability experienced by cities. It is therefore not uncommon for cities to experience climate anomalies of opposite sign to what the particular phase of the mode would suggest. For example, in Zimbabwe during the El Nino year of 1997-1998, drought conditions were predicted, and policy decisions were made based on the expectation of drought and reduced maize yields. However, rainfall ended up being above normal, which reduced perceived credibility of climate forecasts (Dilley, 2000). Conveying subtleties such as probability, uncertainty, and risk management to stakeholders around the globe can be a major challenge.
One lesson is that intra-regional rainfall patterns in these El Nino (and other modes) impacted areas can be very complex (Ropelewski, 1999). Another is that, while climate models of projected impacts are improving, achieving accurate seasonal climate predictions months in advance is still a research goal. In addition, with global climate change, patterns of natural climate variability themselves may change (in terms of strength, frequency, and duration of the modes). Even if the modes remain the same, climate change may alter the teleconnection patterns that drive regional climate impacts.
We highlight two specific modes that have large impacts on temperature and precipitation in many cities around the world: the El Nino-Southern Oscillation and the North Atlantic Oscillation. Additional modes are briefly described, followed by a discussion of interactions between climate variability and climate change.
El Nino-Southern Oscillation
Among climate oscillations, the coupled atmosphere-ocean phenomenon, known as the El Nino-Southern Oscillation (ENSO), impacts the most cities worldwide. The oceanic manifestations of this mode, known as El Nino episodes, are mainly characterized by the warming of the tropical central and eastern Pacific. La Nina tends to exhibit the opposite cooling effects. The main atmospheric manifestation, known as the Southern Oscillation, is a seesaw of the global-scale tropical and subtropical surface pressure pattern, which also involves changes in the winds, tropical circulation patterns, and precipitation (Trenberth and Caron, 2000).
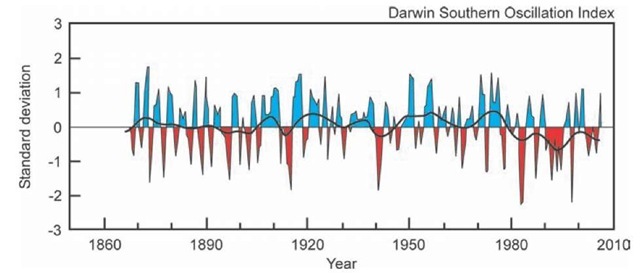
ENSO is measured by several indices, including the surface pressure difference between Darwin and Tahiti (Southern Oscillation Index, SOI) and the sea surface temperatures in some selected regions in the central and eastern equatorial Pacific (Figure 3.6). El Nino episodes occur about every three to seven years, but their frequency and intensity vary on inter-decadal timescales.
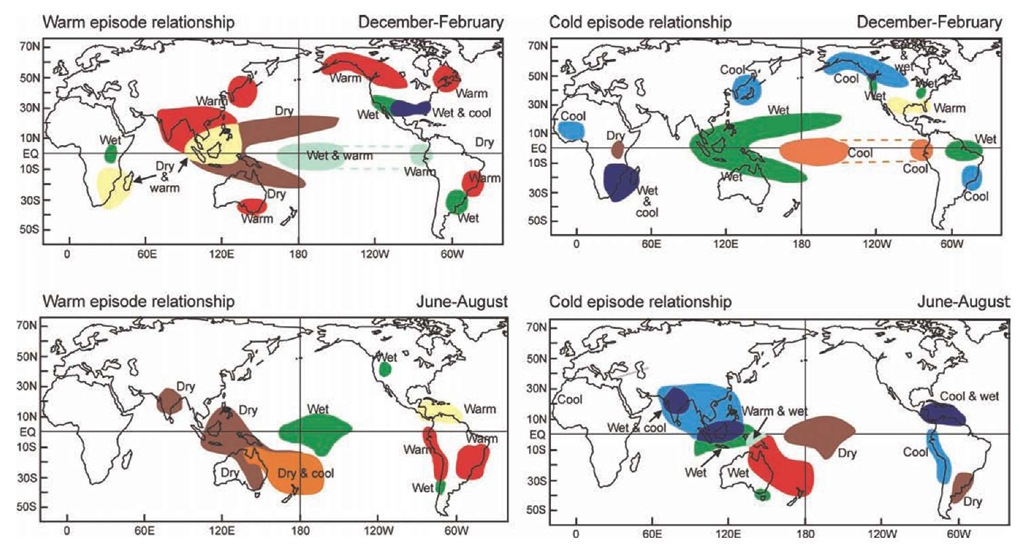
There are tropical-extra-tropical teleconnections (Figure 3.7) caused by energy transfer from the tropics, which also cause circulation, precipitation, and temperature variations in subtropical and higher latitudes, such as the Pacific-North American (PNA) and Pacific-South American (PSA) patterns. These tel-econnections are associated with precipitation anomalies (departures from long-term averages) in cities in South and Southeast Asia, Australia, southern Africa, the southern United States, and tropical and subtropical South America.
Figure 3.6: Southern Oscillation Index. The SOI is one measure of the El Nino-Southern Oscillation, a pattern of natural climate variability. Red indicates El Nino episodes, and blue La Nina episodes.
The impacts of ENSO vary by season in different regions of the world, and therefore in different cities. For example, in southeastern South America, impacts are strongest during the austral spring (Grimm et al., 2000). Opposite effects may occur in different periods of an ENSO episode, and thus annual anomalies can be weak even if strong anomalies happen during particular months or seasons (Grimm, 2003, 2004). For example, in Jakarta, Indonesia, reduced precipitation in the fall of El Nino years is often partially offset by enhanced precipitation the following spring (Horton, 2007).
Box 3.1 describes the impacts of ENSO in Rio de Janeiro.
Figure 3.7: ENSO Teleconnections. Teleconnections for both warm (El Nino) and cold (La Nina) episodes are shown. The variation of the teleconnections by season for each episode is also included.
Climate-proofing Rio de Janeiro, Brazil
As flooding and landslides in April 2010 and January 2011 have demonstrated, Rio de Janeiro and the surrounding region continue to be at high risk of climate impacts. Approximately 200 deaths were attributed to the April 2010 floods and landslides, and several thousand people were made homeless, while 450 died in mudslides in the state of Rio de Janeiro in early 2011." Efforts will need to be made to "climate proof" the metropolitan region, increasing its resilience to floods induced by climate change and variability.
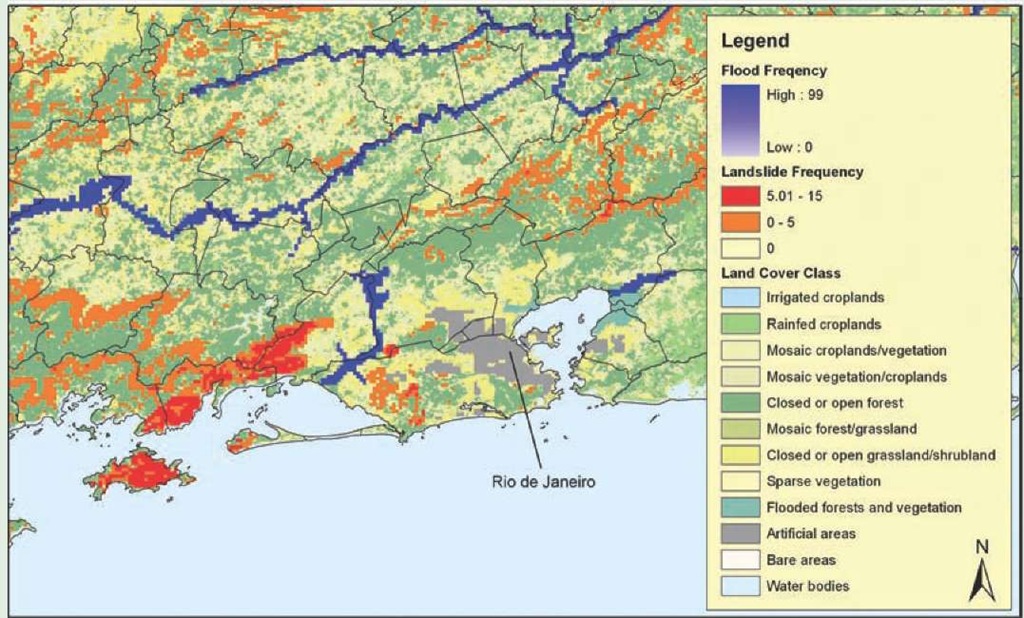
The city and metropolitan region of Rio de Janeiro have populations of 5 million and 11 million, respectively. Guanabara Bay, where Rio is situated, faces almost due south. Rio’s dramatic topography has made it prone to landslides and flooding in low-lying areas (Box Figure 1). With the Atlantic rainforest having been stripped away from many hillsides, the thin soils have become prone to landslides, and the granite and gneiss bedrock has been left exposed to weathering, making it more prone to decomposition and erosion.
The coastline in this area was characterized by lagoons, estuaries, and low-lying coastal marshes, many of which have been filled in. The flat topography of low-lying areas, combined with a lack of drainage, has continued to result in flooding during the summer rainy season (January-March). The few remaining lagoons, mangroves, and marshes have been affected by land fill and sedimentation, reducing their absorptive capacity during extreme rainfall events. Low-lying areas around Lagoa de Tijuca and Lagoa de Jacarepagua will largely be submerged with sea level rise of 0.5-1m.iii
The city receives higher than normal precipitation during the summer months of some El Nino events, but the connection with ENSO is not consistent. In the summer of 1998, in the end of an El Nino episode, the city was affected by severe floods as a result of two intense periods of rainfall in early February that produced a total of 480 mm of rain, which constitutes one-third the annual average rainfall of 1,200-1,500 mm (depending on location). The flooding in early April 2010 was precipitated by 288 mm of rainfall in a 24-hour period. These floods were associated with a weak El Nino event, but the floods in early 2011 were actually associated with a La Nina event, so the linkage is not consistent.™
Rio’s peculiar physical setting, and the circumscribed nature of suitable building sites, has spawned two kinds of response. One is the construction of high-rise apartments close to the coastline (e.g., Copacabana, Ipanema and Leblon) and in flood-prone areas further inland; the other is unregulated construction on steep slopes, particularly on the Tijuca mountain range.
Box Figure 3.1: Rio de Janeiro: flood and landside risk (Global Risk Data Platform Preview). Flood frequency is the expected average number of events per 100 years. Landslide frequency is the expected annual probability and percentage of pixel of occurrence of a potentially destructive landslide event x1,000,000.
In terms of human vulnerability, Rio’s income distribution is highly skewed. The existence of pockets of extreme poverty side-by-side with affluent neighborhoods is characteristic of the city. The 2000 census reported that 1.1 million people live in favelas, or 20 percent of the municipality’s population. The city is also densely settled: the municipality has an average density of 4,640 persons per sq km but densities in the smaller administrative units of the metro area are between 8,000 and 12,000 persons per sq km.
Rio has a large migrant population from the poorest parts of Brazil’s arid northeast region. The fact that many of them do not have personal experience with mudslides or mass wasting may account for their building practices. Migrants move up hillsides in search of new land, consistently eating away at the vegetation cover on the slopes above the favelas, despite government efforts to cordon off such areas to prevent further development. New regulations have been put in place that restrict building in hazard-prone areas. Efforts to "regularize" favelas have also been underway for several years, with various government programs to undertake cadastral surveys, grant deeds to de facto owners and provide basic infrastructure. These same plans limit the further expansion of favelas in flood-prone or steeply sloped areas. Rio de Janeiro has invested more than US$600 million in its Programa Favela Bairro to improve access to basic infrastructure, health and education for half a million of its poorest residents.vi In terms of social cohesion, the favelas do have some rudimentary organization, including neighborhood watches and self-improvement societies. These can be important for self-help and early warning systems. The drug traffic entrenched in many favelas (and the violence it spawns) is a major counter-force to these elements – a problem that has no end in sight.
Although favelas have always suffered during rainy seasons, the development up slope and paving of walkways has had the effect of increasing runoff to the low-lying areas. Runoff is channeled down cemented and quasi-natural watercourses to the narrow coastal lowlands, where they join canals whose limited flow capacity causes frequent flooding. By contrast, the Baixada Fluminense, a large marshy lowland somewhat removed from the steeper parts of the city, has had reasonably adequate drainage since the 1930s.vii
Generally, precipitation extremes are expected to increase in severity with climatic change, and these will have adverse impacts on Rio, given that the city already experiences extreme flooding and landslides on a roughly 20 year basis. Poor neighborhoods are particularly vulnerable to this extreme precipitation: roughly 300 people died and more than 20,000 people were made homeless during a 1967 flood, and in 2010 the Morro do Bumba slum built on a former garbage dump in Niteroi collapsed and slid downhill, burying homes and killing more than 200 people. Extreme and unpredictable rainfalls and floods converge with projected sea-level rise to increase stresses that will be difficult for Rio to handle owing to the city’s topography (narrow coastal shelf backed by steep mountains subject to mass erosion), poor building conditions, the lack of secure land tenure for a notable portion of the city’s population, poverty coupled with large income inequalities, and large problems with sanitation systems and sewage disposal.
Little in the way of concrete flood protection infrastructure has been set up in the wake of the 1988 floods. It is possible to speak of highly vulnerable sub-populations living in favelas and near waterways, and relatively less vulnerable upper classes living in high-rise apartments in locations less susceptible to inundation. This speaks to the need to upgrade slums, limit settlement on steep slopes and unstable locations, relocate some settlers on some slopes, revegetate hillsides, create more green verges near waterways for water absorption, and improve drainage systems in low-lying areas. Part of this will entail cleaning and maintenance of existing waterways and canals. A number of more specific suggestions for climate proofing are provided in the volume by Gusmao et al. (2008).
Sao Paulo and the El Nino-Southern Oscillation
The ENSO can have a strong effect on rainfall in Sao Paulo, Brazil, although this city is situated between regions of opposite effects of ENSO in the rainy season, Central-East and South Brazil. In Central-East, ENSO affects the frequency of extreme daily precipitation events in opposite wasy in the early and peak summer rainy season (Grimm and Tedeschi, 2009). In Sao Paulo, the behavior is different: there is significant impact in the early rainy season (October-November) but no consistent impact in the peak rainy season (January-February). Enhanced precipitation in the early rainy season, which is more frequent during El Nino episodes, can have a significant impact, since in this case urban floods and landslides may become more frequent during the rainy season. Flooding and landslides are disruptive, costly, and deadly.
Effects of the North Atlantic Oscillation on cities
The North Atlantic Oscillation (NAO) is the dominant pattern of atmospheric circulation variability in the North Atlantic region (Hurrell et al., 2003).
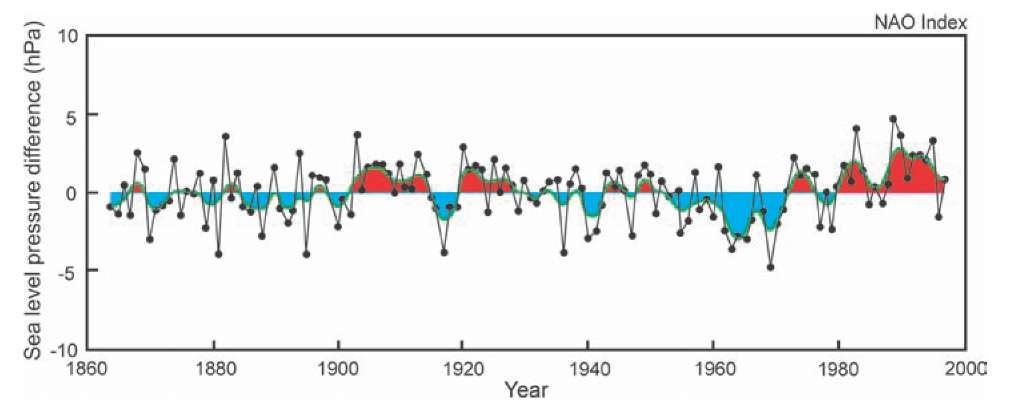
Figure 3.8: NAO Index. One measure of the NAO Index is the difference in sea level pressure between the polar low near Iceland and the subtropical high near the Azores. Red indicates the positive phase of the NAO and blue indicates the negative phase of the NAO.
Although concentrated there, the impacts on climate extend over cities in a much larger region, from central North America to Europe, Asia, and Africa. When the NAO index is positive, there is a higher than usual subtropical high pressure (located in the general area spanning Portugal and the Azores) and a deeper than normal Iceland low pressure (Visbeck et al, 2001; Figure 3.8) This larger pressure difference produces stronger-than-average westerly winds at middle latitudes, resulting in warm and wet winters in eastern USA and most of Europe and cold and dry winters in Canada and Greenland. Drier and colder conditions also prevail over southern Europe, the Mediterranean, and northern Africa. The oscillation and its aforementioned impacts are strongest in winter, but are present throughout the year. The NAO index varies from month to month and from year to year; however, the long-term average tends to remain in one phase for multi-year periods.
The negative NAO index refers to a weaker and eastward-displaced subtropical high, and a weaker Iceland low, leading to anomalies that are largely opposite of those associated with the positive NAO index. The mid-latitude winds are weaker and in a more west-east direction during negative NAO events. Warm and moist air is brought into southern Europe and cold temperatures prevail in northern Europe and in eastern USA. Canada and Greenland experience higher winter temperatures.
The impacts of NAO on precipitation and temperature in North America and Europe have urban consequences for hydropower generation (through water availability), energy consumption (through temperatures and humidity), water supply, and ecosystems (drought and forest fires, for example) among other sectors. Cities highlighted in this topic that are impacted by the NAO include New York City, Toronto, London, and Athens. A London example is presented below.
London and the North Atlantic Oscillation
One city featured in this topic that is affected by the NAO is London. Changes in the phase of the NAO have an impact on temperature and precipitation in the city, especially during the wintertime. The general relationship between the phase of the NAO and climate in London is that the positive phase brings wetter and warmer conditions, while the negative phase brings drier and colder conditions (Wilby et al., 1997). In early 2009, London experienced a rare heavy snowfall, which crippled the transportation system and forced many businesses to close. At that time, the NAO was in the negative phase, which helped transport cold air to the city. The snowfall in 2009 is an example of how expected relationships of natural climate variability do not always hold. While the colder temperatures were typical for the negative NAO, the increased precipitation was not.
Other modes of natural climate variability
In addition to ENSO and the NAO, there are other modes of natural climate variability that impact cities. These include the Pacific Decadal Oscillation (PDO), the Southern Annular Mode (SAM), the Atlantic Multidecadal Oscillation (AMO), the Indian Ocean Dipole (IOD), and the Madden-Julian Oscillation (MJO). The PDO is a longer timescale (decadal compared to inter-annual) pattern of variability that affects the climate in the Pacific Basin. The SAM is a mode of extra-tropical variability in the Southern Hemisphere that affects the climate in South America and Australia. The AMO is a mode of natural variability of North Atlantic Ocean sea-surface temperatures that influences Atlantic Basin hurricane activity. The Indian Ocean Dipole (IOD) is a coupled ocean-atmospheric mode centered on the tropical Indian Ocean Basin. The Madden-Julian Oscillation is an intra-seasonal mode of variability that primarily influences precipitation in the tropics.
Natural variability and global climate change
The frequency and intensity of the modes of natural climate variability and their associated teleconnections may change with global climate change. Because of the non-linearity of the climate system, it is not possible to simply add the teleconnections of a particular mode to a changing background climate (Hoerling et al., 1997). It is important to analyze long-term observations of the modes to learn how they have varied in the past and if they are exhibiting any trends in the current climate. Climate change and climate variability may interact in complex and unpredictable ways. For example, shifts in mean wind patterns (such as the jet stream) associated with climate change may modify the regional teleconnections of the modes. It is possible that the accuracy of seasonal forecasts may change in some regions as climate change accelerates.
There remains much uncertainty as to how El Nino/La Nina conditions may change with a warmer climate. While some studies suggest that with increased greenhouse gas concentrations, the El Nino pattern may become more dominant, there is great uncertainty surrounding this issue (Collins, 2005).
For the NAO, some scientific evidence including modeling studies suggests that, with a warmer atmosphere, ocean temperatures will rise in a pattern that reinforces the positive phase of the NAO. As was the case with projections of ENSO with global warming, future patterns of the NAO also remain extremely uncertain (Visbeck et al., 2001).


