Hazards and vulnerability
Ekanade et al. (2008) describe the nature and magnitude of the climate change hazards for the city level using different greenhouse gas emission scenario models. The IPCC (2001a) Special Report on Emission Scenarios A2 and B1 climate change scenarios were utilized to project 30-year timeslices for temperature and rainfall values for the City of Lagos and Port Harcourt and the coastal areas of Nigeria. This study did not, however, project sea level rise.
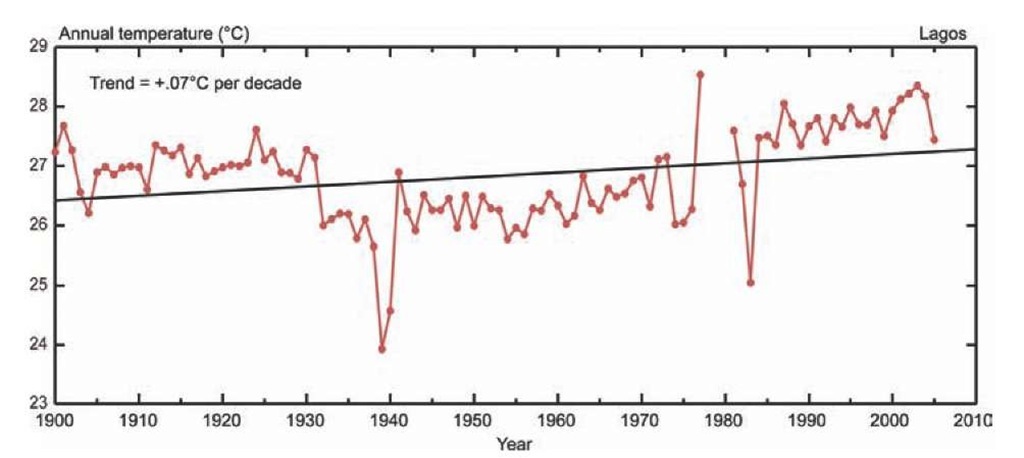
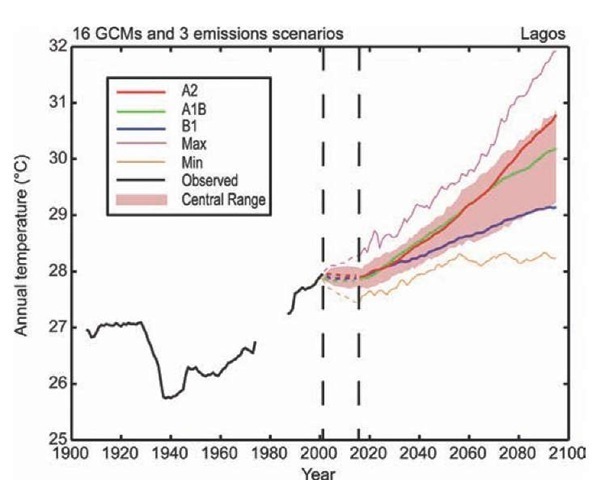
Records from the two stations (Ikeja and Lagos) used in this analysis show that monthly maximum temperature was increasing at about 0.1 °C per decade from 1952 to 2006, while monthly minimum was decreasing at about 0.5 °C per decade: since the 1900s average temperature has increased 0.07 °C per decade (see Figure 2.11). At the extremes, monthly maximum temperatures for Lagos have reached above 34 °C during seven of the last twenty years. The number of heat waves in Lagos has also increased since the 1980s (see Table 2.4). There have been very few incidences of unusually cold months of less than 20 °C since 1995. Projected temperature for Lagos for the 2050s anticipates a 1 to 2 °C warming (see Figure 2.12).
Figure 2.11: Observed temperatures, Lagos.
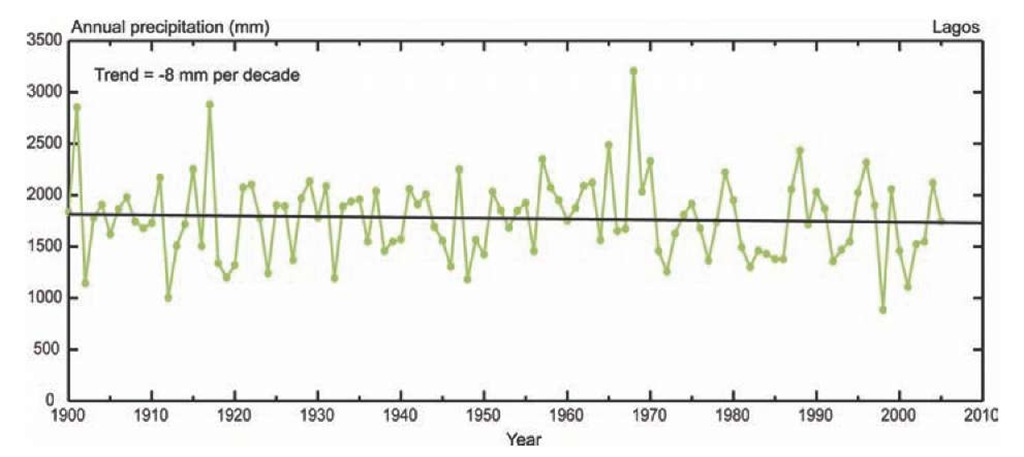
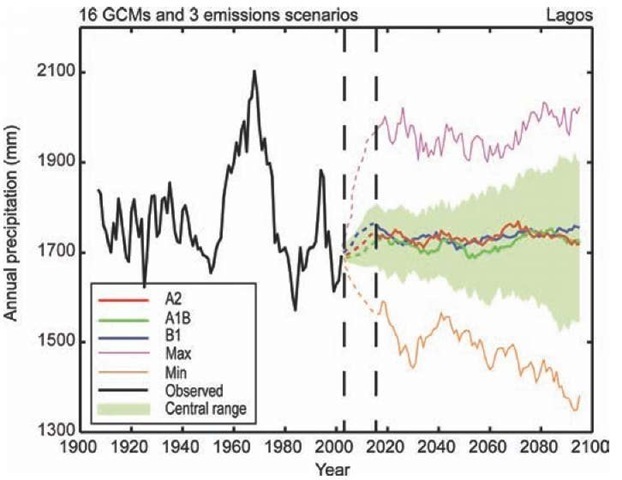
According to historical records, the total annual precipitation in Lagos has decreased by 8 millimeters per decade since 1900 (see Figure 2.13). In keeping with the overall precipitation trends, most of Lagos has experienced decreases in rainfall amounts during the rainy season. For example, between 1950 and 1989 more than 20 months experienced rainfall amounts of over 400 millimeters. In the recent period between 1990 and 2006, however, very few (four) rainy months recorded over 400 millimeters of rain. In the twenty-first century, precipitation in Lagos is expected to be less frequent but more intense; projected precipitation for Lagos for the 2050s anticipates an uncertain 5 percent change in mean precipitation (see Figure 2.14; Table 2.4).
Coastal storm surge also is a concern. Lagos, as well as the entire Nigerian coast, is projected to experience more storm surges in the months of April to June and September to October annually. This increase in storminess is projected to be accompanied by greater extreme wave heights along the coasts.
Figure 2.12: Projected temperatures, New York City.
According to Folorunsho and Awosika (1995) the months of April and August are usually associated with the development of low-pressure systems far out in the Atlantic Ocean (in the region known as the "roaring forties"). Normal wave heights along the Victoria Beach range from 0.9 m to 2 m. However, during these swells, wave heights can exceed 4 m. The average high high-water (HHW) level for Victoria Island is about 0.9 m above the zero tide gauge with tidal range of about 1 m. However, high water that occurs as surges during these swells has been observed to reach well over 2 m above the zero tide gauge. These oceano-graphic conditions are aggravated when the swells coincide with high tides and spring tide.
An extreme event, which can be considered a case study for future threats, was observed between August 16 and 17, 1995, when a series of violent swells in the form of surges were unleashed on the whole of Victoria Beach in Lagos. The most devastating of these swells occurred on August 17, 1995, and coincided with high tide, thus producing waves over 4 m high causing flooding. Large volumes of water topped the beach and the Kuramo waters. A small lagoon separated from the ocean by a narrow – 50 m wide – strip of beach was virtually joined to the Atlantic Ocean. Many of the streets and drainage channels were flooded, resulting in an abrupt dislocation of socioeconomic activities in Victoria and Ikoyi Islands for the period of the flood.
In addition, coastal erosion is very prevalent along the Lagos coast. Bar Beach in Lagos has an annual erosion rate of 25 to 30 m. Earlier IPCC scenarios have been used to estimate the effects of 0.2, 0.5, 1, and 2.0 m sea level rise for Lagos. Along with coastal flooding and erosion, another adverse effect of sea level rise on the Lagos coastal zone as earlier assessed by Awosika et al. (1993a, b) is increased salinization of both ground and surface water. The intrusion of saline water into groundwater supplies is likely to adversely affect water quality, which could impose enormous costs on water treatment infrastructure.
Lagos has an extremely dense slum population, many of whom live in floating slums. These are neighborhoods that extend out into the lagoons scattered throughout the city.
Figure 2.13: Observed precipitation, Lagos.
The barrier lagoon system in Lagos, which comprises Lagos, Ikoyi, Victoria, and Lekki, will be adversely affected through the estimated displacement of between 0.6 and 6 million people for sea level rise of between 0.2 and 2 m (Awosika et al., 1993a) (see Table 2.5).
In their study of the impacts and consequences of sea level rise in Nigeria, French et al. (1995) recommended that buffer zones be created between the shoreline and the new coastal developments. A more generalized multisectoral survey of Nigeria’s vulnerability and adaptation to climate change was funded by the Canadian International Development Agency (CIDA) through its Climate Change Capacity Development Fund (CCCDF). This study has served to create awareness of climate change issues and of the need for manpower development.
Even more worrisome is the general sensitivity of Lagos to climate change due to its flat topography and low-elevation location, high population, widespread poverty, and weak institutional structures. Many more vulnerabilities stem from these characteristics including the high potential for backing up of water in drainage channels, inundation of roadways, and severe erosion.
Figure 2.14: Projected precipitation, New York City.
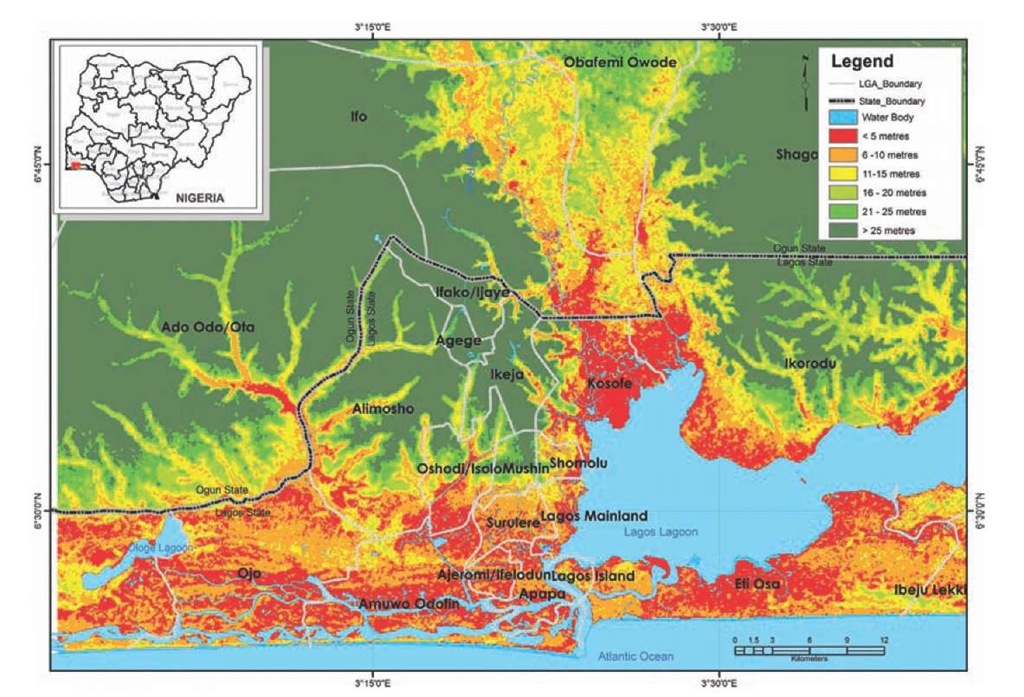
The barrier lagoon coastline in the western extremity, including the high-value real estate at Victoria Island and Lekki in Lagos, could lose well over 584 and 602 square kilometers of land respectively from erosion, while inundation could completely submerge the entire Lekki barrier system (Awosika et al., 1993a, b). Moreover, flooding poses greater threats to the urban poor in several African cities (Douglas and Alam, 2006). See Figure 2.15 for topography identifying low-lying areas that overlap with built-up areas and are prone to flooding.
Intense episodes of heat waves will likely severely strain urban systems in Lagos, by inflicting environmental health hazards on the more vulnerable segments of the population, imposing extraordinary consumption of energy for heating and air conditioning where available, and disrupting ordinary urban activities.
It is very likely that heat-related morbidity and mortality will increase over the coming decades; however, net changes in mortality are difficult to estimate because, in part, much depends on complexities in the relationships among mortality, heat, and other stresses. High temperatures tend to exacerbate chronic health conditions. An increased frequency and severity of heat waves is expected, leading to more illness and death, particularly among the young, elderly, frail, and poor. In many cases, the urban heat island effect may increase heat-related mortality. High temperatures and exacerbated air pollution can interact to result in additional health impacts.
Table 2.4: Extreme events in Lagos.
|
City |
Extreme temperatures |
Extreme precipitation |
|
Lagos |
March 1988; March 1990; February 1998; March 1988; March 2001; March 2002; February 2003; March 2003; August 2004 |
May 1958; June 1962; July 1968; August 1998; November 1998 |
Table 2.5: Estimation of internally displaced people by sea level rise scenarios in Lagos.
|
Sea level rise scenarios |
0.2 m |
0.5 m |
1.0 m |
2.0 m |
|
By shoreline types, number of people displaced (in millions) |
||||
|
Barrier |
0.6 |
1.5 |
3.0 |
6.0 |
|
Mud |
0.032 |
0.071 |
0.140 |
0.180 |
|
Delta |
0.10 |
0.25 |
0.47 |
0.21 |
|
Strand |
0.014 |
0.034 |
0.069 |
0.610 |
|
Total |
0.75 |
1.86 |
3.68 |
7.00 |
Impacts are projected to be widespread, as urban economic activities will probably be affected by the physical damage caused to infrastructure, services, and businesses, with repercussions on overall productivity, trade, tourism, and on the provision of public services.
The degraded state of the urban form and poverty is indicative of the expected low resilience of most of the inhabitants of the city to external hazard stressors such as those often associated with climate extreme events. Most of the city’s slums are located on marginal lands that are mainly flood-prone with virtually no physical and social infrastructure. Furthermore, some of the planned and affluent neighborhoods in many parts of the city still experience flooding during "normal" rainfall. This may be attributed to the little-to-no attention often given to the provision and maintenance of sewer and storm drains in these supposedly "planned" affluent neighborhoods. For instance, Ikoyi, one of the most highly priced neighborhoods in the city, was actually developed from an area originally covered by about 60 percent wetland.
Adaptive capacity: current and emerging issues
Even with active membership in the C40 Large Cities Climate Leadership network, Lagos megacity still does not have a comprehensive analysis of the possible climate risks facing it, especially with respect to inundation due to sea level rise. The implication is that there is an urgent need to address the obvious lack of awareness of the vulnerability of Lagos to climate change and the need to begin to plan adaptation strategies. Recently, tackling the problem of flooding and coastal erosion has been given more attention by the Lagos State government in the form of a sea wall along Bar Beach in Victoria Island. This activity, however, is evidence that local awareness appears to be lacking the full scope of the city’s vulnerability to climate change.
Although the attention of the city managers is more focused on filling its long physical infrastructural gap due to years of neglect, the lack of concern or awareness of likely sea level rise in Lagos is worrisome. There continues to be sand-filling of both the Lagos Lagoon and the Ogun River flood plain in the Kosofe local government area to about 2 m above sea level for housing developments. Such activities need to be done with projections of sea level rise due to climate change as part of the planning process.
Figure 2.15: Lagos topography.
Currently, the leading actor on climate change issues in the city is the Lagos State government, which has been influenced by its membership of the C40 Large Cities Climate Summit. Some of the mitigation actions being pursued by the Lagos State government in the city include:
1. Improvement of the solid waste dump sites that are notable point sources of methane – a greenhouse gas – emissions in the city;
2. The new bus rapid transport (BRT) mass transit system is already shopping for green technology to power vehicles in its fleet;
3. Commencement of tree planting and city greening projects around the city; and
4. Proposed provision of three air-quality monitoring sites for the city.
The full picture of the nature of climate change and variability, its magnitude, and how it will affect the city is yet to be analyzed to support any informed adaptation actions. Thus, the climate risk reduction adaptation actions presently taken in the city are primarily spin-offs from the renewed interest of the city’s management in reducing other risks and taking care of developmental and infrastructural lapses, rather than being climate change driven. Some of these adaptation activities include:
1. The sea wall protection at Bar Beach on Victoria Island to protect the coastal flooding and erosion due to storm surges;
2. Primary and secondary drainage channel construction and improvement to alleviate flooding in many parts of the city;
3. Cleaning of open drains and gutters to permit easy flow of water and reduce flooding by the Lagos State Ministry of Environment Task Force, locally referred to as "Drain Ducks";
4. Slum upgrade projects by the LMDGP project; and
5. Awareness and education campaigns such as the formation of Climate Clubs in primary and secondary schools in Lagos, and organization of training sessions and workshops on climate change issues.
Due to the increasing activity in the Ogun State sector of the city, a regional master plan for the years 2005-2025 (Ogun State Government, 2005) has been developed for its management. However, the issue of climate change risks to infrastructure and the different sectors such as water and wastewater (Iwugo et al, 2003), health, and energy, is not yet reflected in the report.
"Normal" rainfall is known to generate extensive flooding in the city largely because of inadequacies in the provision of sewers, drains, and wastewater management, even in government-approved developed areas. Consequently, an increase in the intensity of storms and storm surges is likely to worsen the city’s flood risks. Since the local governments work closely with the people and communities threatened by climate risks, there is a need to create awareness at the local government level. There is an urgent need to empower them intellectually, technically, and financially to identify, formulate, and manage the climate-related emergencies and disasters, as well as longer-term risks, more proactively.
