With the release of FP3, the firewall administrators are released from the legacy restraint of the old log viewer. All the GUI interface changes, which serve for a faster and better-organized desktop in SmartDashboard and SmartView Tracker, have been implemented in the new SmartView Tracker Client. This interface supports the three modes of log types in different tabular screens. Each screen is fortified with two additional panes and a more useful status bar. Extended free text search and remote file management are also newly enhanced features. Previous functions such as blocking connections in active mode or resolving addresses and services are also accessible through the toolbar and the menus.
What’s New in SmartView Tracker?
Actually, everything is new in FP3.The outlook and the organization features are original. Let’s take a closer look.
The Panes
Figure 2.17 SmartView Tracker Windows
The panes are available for all three log types: Log, Active, and Audit (see Figure 2.17).
The Query Tree Pane
If you are using plenty of custom predefined queries or switching between VPN and regular views, activating the Query Tree pane will be very helpful. As shown in Figure 2.18, this left pane has predefined product queries, too.The product queries are not simple filter-by-product queries. Remember that each product query has different fields. It is recommended to keep this pane closed if your screen resolution is limited. You may toggle between views from the toolbar toggle buttons.
Figure 2.18 The Query Tree Pane
Note
The predefined default query "All records" does not drawn on all entries in the log database. You still need to check the necessary field types from the Query Properties pane to display the hidden fields.
The Query Properties Pane
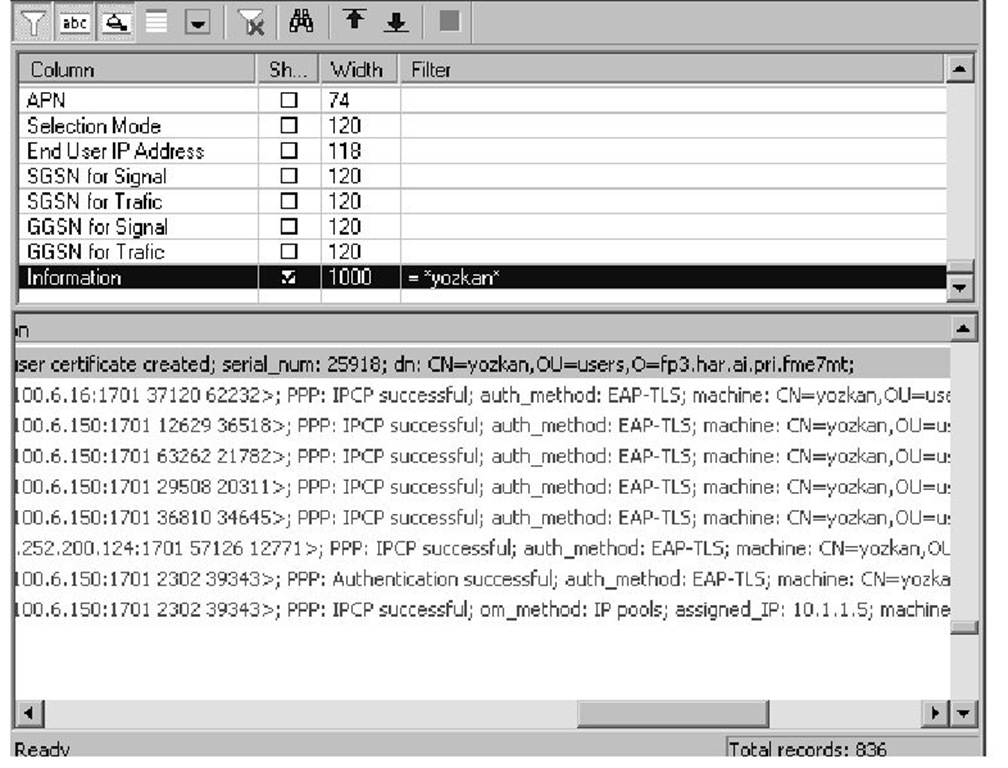
This filter screen (see Figure 2.19) is very useful.You may visually define your queries, design your screen layout, and enter your subqueries. The only drawback is the order of the query variables.You cannot sort the variables by clicking on the columns, so you need to know the order of the query properties.You may drag and drop the fields on the Query Properties pane. Of course, scrolling down the whole list is always a valid option. The default firewall queries do not contain the NAT-related fields, so you need to add them manually. This pane is accessible through the Menu and Toolbar option. It is recommended that you use toolbar Show and Hide options for a crisper log view.
The Records Pane
The old log viewer window is now the Records pane. The logs are more versatile in this GUI.You have the following options in the new Records pane:
■ Link to related Security Policy Rules.
■ Copy cell or whole record options.
■ When records are double-clicked, record details are displayed in a pop-up window.
■ There’s free text search on all columns.
Figure 2.19 The Query Properties Pane
Menu Changes
Firewall administrators who are familiar with the 4.x interface will not find the Edit, Select, and Mode items in the new menu bar. The Edit menu is no longer required, since Find is integrated with the right-click. The old expanding Select menu has been divided into two menus. The Query Properties pane has all the filter options. On the other hand, the Query menu has the necessary menu items for basic query management, which includes the functions such as save as, copy, delete, and rename. The Mode menu has been transferred to the main interface as the tabular screen switches.
Highlights From the SmartView Tracker
Besides managing regular log files, some additional features make firewall administrators’ lives easier. Fetching log files from remote enforcement modules or viewing a historical rule in SmartDashboard are very helpful features, as we see in this section.
Remote File Management
SmartView Tracker allows administrators to fetch log files from remote enforcement points.The interface has organized subscreens for remote log file management.This is done in three steps:
1. Choose the enforcement point. This screen allows you to choose the modules from which you will fetch the log files. It is also possible to execute a log switch on the remote module via the Log Switch button.
2. Get a file list. All log files on the remote station are listed in a scroll-down menu.You may choose multiple log files, except the active log file.To get the active file, you must first perform the Log Switch operation.
3. Monitor file fetch progress. This screen is simply a download screen.You have real-time access to the status of the log file fetches from the remote modules. The remote log filenames are prefixed with the module name to prevent mix-ups.
Note
Using remote log management commands from the command line or using Remote Files Management from the SmartView Tracker is always a better alternative to simple file transfer, since the log files are automatically compressed with the LZ77 (gzip) standard.
View in SmartDashboard
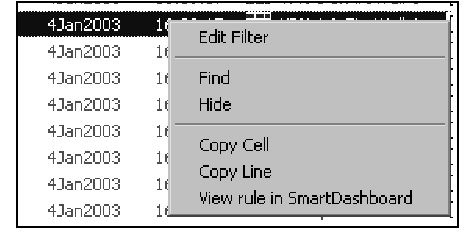
If you’re wondering who allowed this connection and you don’t want to track the rule number that existed six weeks ago, the new SmartView Tracker offers a convenient function. As shown in Figure 2.20, it is possible to display the related rule base and the rule via the View in SmartDashboard option. Of course, you must have the revisioned databases to use this function.The process is as follows:
1. Open an historical log file.
2. Highlight a record in the Records pane.
3. Click the View in SmartDashboard item on the right-click menu. A new SmartDashboard will be opened in read-only mode, displaying the rule that created the related record.This view displays a previous database version if the log record does not belong to the current security policy.
Figure 2.20 View in SmartDashboard
Command-Line Options
In an enterprise environment, most security policies require a centralized logging system. Although OPSEC-based products help firewall administrators manage the files through the LEA protocol, sometimes it is necessary to use simple scripts to automate tasks or troubleshoot some basic problems. NG offers the following flexible command-line logging utilities, which complete the SmartView Tracker:
■ fwm log Displays logs with the given switches. For example:
■ fwm logexport Exports log contents to ASCII format. Useful for third-party integration. For example:
■ fwm logswitch The command-line logswitch, useful for batch scripts. For example:
■ fwm repairlog Very useful when you only have the log file but not the PTR file. For example:
■ fwm mergefiles Merges multiple log files into single files and unifies the records. For example:
■ fwm lslogs This is the command line Get File List. For example:
■ fwm fetchlogs This is the command line File Fetch. For example:
■ fw lea_notify Notifies all LEA clients for log collection. For example:
■ log_export Exports logs to an Oracle database. Requires configuration file and an Oracle client. For example:


