Introduction
Cardiomyopathy refers to diseases of the heart muscle that becomes enlarged, thick, or rigid. These changes affect the electrical stability of the myocardial cells, which predisposes the heart to failure or arrhythmias. Cardiomyopathy in its two common forms, dilated and hypertrophic, implies enlargement of the atria. Therefore, computer intelligence techniques are proposed for the recognition and classification of P wave features for cardiomyopathy diagnosis. The technique that we propose is a neuro-fuzzy network. The neuro-fuzzy classifier will be trained with innovative evolutionary algorithms, which have recently been shown to be efficient global optimizers.
Cardiomyopathy is a significant clinical problem which is mainly generated by volume/diastolic overload. To accommodate the increased blood volume, the heart chambers may stretch or dilate. Valvular regurgitation and congestive heart failure are two conditions that contribute to chamber dilation.
Cardiomyopathy is generally diagnosed by an electrocardiographic (ECG) investigation. In the current standards published by the American Heart Association, chamber hypertrophy or enlargement is a separate diagnostic category which can be detected with ECG analysis (Masson, Hancock, & Gettes, 2007). Although many algorithms have been implemented for ECG analysis, the proposed research is unique in several ways.
• We propose the development of non-invasive and automatic cardiomyopathy diagnosis, which has not been reported in the literature.
• We propose the development of algorithms for P wave analysis, which have not been reported in the literature.
• We propose the use of 5-lead ECG data, which is more readily available than 12-lead data.
• We propose the use of a powerful neuro-fuzzy architecture for ECG analysis, which has not been reported in the literature.
• We propose neuro-fuzzy ECG classifier optimization using evolutionary algorithms, which has not been reported in the literature.
Our preliminary studies of postoperative cardiovascular patients reveal our hypothesis: the ECG presents different electrical activity for patients with cardiomyopathy, compared with patients who do not have cardiomyopathy. This working hypothesis indicates that an automated method that selects the best ECG parameters to include in a cardiomyopathy diagnosis algorithm will be extremely valuable. Although such a method will not be foolproof or 100% correct, and thus cannot replace medical doctors, it will help physicians diagnose or prognose life threatening conditions such as stroke or ventricular or atrial fibrillation. This will expedite the initiation of medical treatment as appropriate to minimize the risk of these conditions, or to prevent their onsets.
Although it has long been suggested that cardiomyopathy is reflected in modification of ECG characteristics, statistics-based attempts to classify cardiomyopathy from the ECG have been underwhelming (Macfarlane, 2006; Magdic, Saul, 1997). Motivated by the universal approximation theorem for neuro-fuzzy networks discussed in the topic, we hypothesize that earlier limitations may be overcome by a neuro-fuzzy classification model. Cardiovascular diseases are the major cause of death in the western world, resulting in more than 800,000 deaths per year in the United States alone (American Heart Association, 2009). One in five Americans has some form of cardiovascular disease (Olson, 2004). Cardiomyopathy is a significant clinical problem which is mainly generated by volume/diastolic overload. To accommodate the increased volume of blood, the heart chambers may stretch or dilate. Valvular regurgitation and congestive heart failure are two conditions that contribute to chamber dilation.
Cardiomyopathy is generally diagnosed by an echocardiograph investigation. For an echocardiography the patient has to be referred to a cardiologist or an echocardiographic investigation. But the electrocardiographic (ECG) investigation is always part of a cardiologic work-up.
The ECG represents the recording of the deflection of ionic current across myocardial cell membranes and throughout the extracellular space of the different tissues of the thoracic cavity. The ECG, in competition to many other techniques, retains an important role in diagnosis and prognosis of cardiovascular diseases.
It has been suggested that cardiomyopathy is reflected in modification of ECG characteristics such as P wave morphology. Previous statistics-based attempts to classify the cardiomyopathy from ECG have been underwhelming (Macfarlane, 2006; Magdic, Saul, 1997), but we hypothesize that these limitations can be overcome using a hybrid neuro-fuzzy classification model. To test this hypothesis and direct the results to patient care, we follow these directions. First we design a neuro-fuzzy model to diagnose cardiomyopathy. Then we train the network using an aquired clinical database of ECG signals. Neuro-fuzzy systems can be trained with derivative-based methods like gradient descent (Chen, Linkens, 2001; Linkens, Chen, 1999) or with evolutionary algorithms such as genetic algorithms and swarm intelligence (Kennedy, Eberhart, & Shi, 2001). Evolutionary algorithms have the advantage of not requiring derivative information, and have less likelihood of getting stuck in a local optimum. Hence we use a new biologically motivated optimization algorithm called biogeography-based optimization (BBO) (Simon, 2008) to train the neuro-fuzzy ECG classification network. We also incorporate opposition-based learning in the BBO algorithm (Ergezer, Simon, & Du, 2009) for better classification.
Background
Cardiomyopathy
The term "cardiomyopathy" defines a group of diseases primarily affecting the cardiac muscle by weakening it or changing its structure. Cardiomyopathy can be acquired or inherited, and in many cases its cause is unknown. Hypertrophic cardiomyopathy is inherited and is supposed to be a result of defects of genes that regulate heart muscle growth. Abnormal cardiac enlargement can be due to an increase in length or diameter of existing cardiac muscle cells (Olson, 2004). Cardiomyopathy, through electrical instability of myocardial cells, is associated with cardiac conduction abnormalities that can degenerate to arrhythmia or heart failure (Dische, 1972).
Cardiomyopathies, especially hypertrophic, are considered a common cause of sudden cardiac death in young adults and children (Ingles, Semsarian, 2007; Bar-Cohen, Silka, 2008). The Chagas and idiopathic dilated etiologies of cardiomyopathy led to Pereira et al.’s study in adults (Pereira et al., 2010); after 40 months, almost half of the cases studied (113 out of 284) registered deaths (104) or heart transplants (9).
The ECG records the deflection of ionic current across myocardial cell membranes and through the extracellular space of the thoracic cavity tissues. The history of cardiomyopathy research reveals the evolution of the analysis of ECG correlations. Due to the left ventricle’s critical role, initial studies were focused only on the ECG features of the hypertrophic left ventricle (Sox, Garber, Littenberg, 1989). The QRS and T waves, as the reflections of ventricular depolarization and repolarization respectively, were analyzed (Ziegler, 1970). In the study by Sox et al., citing the Framingham Study, the left ventricular hypertrophy (LVH) was defined by a prolonged ventricular activation period of 0.05 s, tall R waves, depressed ST segments, and inverted T waves (Sox, Garber, Littenberg, 1989). Ziegler was the first to analyze T waves related to LVH; he presented different patterns of the QRS and T configurations into left or right precordial limb leads (Ziegler, 1970). The P wave portrays atrial electrical activity, so changes in the atrial action potential and substrate are reflected in P wave timing or morphology (Chandy, 2004). Bahl et al. presented the P wave changes associated with the type and stage of the disease (Bahl, 1972). Analyzing the four chamber enlargements, Johnson et al. presented P wave changes for enlarged left and right atria (Johnson, Horan, & Flowers, 1977).
The atria, characterized by thin walls, respond to volume and pressure overload due to dilatation. Moreover, the enlargement of the associated ventricle is recognized as the cause of the enlargement of the atrium (Macfarlane, 2006; Magdic, Saul, 1997). The right atrium enlargement is recognized by the increased amplitude of the P wave (0.25 mV) while left atrial abnormality is reflected by the lengthened P wave duration (>120 ms) as well as a notched P wave.
The American Heart Association, American College of Cardiology Foundation, and the Heart Rhythm Society, recently concluded on standards to be used when interpreting ECG data related to cardiomyopathy (Hancock et al., 2009). In left ventricular hypertrophy, the P wave shape is mentioned as a criterion. In right ventricular hypertrophy (LVH), a P wave amplitude larger than 0.25 mV in lead II is presented as a threshold. Left atrial abnormality implies a prolongation of the total atrial activation time (>120 ms), widely notched P wave, and possible changes in P wave area. The right atrial abnormality list includes a larger amplitude of the P wave (> 0.25 mV) and a prolongation of the P wave in patients after cardiac surgery, which is the case for the patients in our proposed research. Our proposed algorithm presents the advantage of compatibility with the clinical CardioVascular Intensive Care Unit (CVICU) setting since it is designed to analyze P wave parameters from a 5-lead ECG, versus the laboratory 12-lead ECG. P wave delineation is made automatically on the ECG signal using wavelet transforms. The P wave features obtained by the wavelets are then processed by a neuro-fuzzy system. Neuro-fuzzy systems are combinations of fuzzy systems and artificial neural networks. Such combined systems have the advantage that they can learn faster and more accurately than an individual artificial neural network or fuzzy logic system. A benefit over artificial neural networks is that the rules that describe the system are explicit, thus permitting easy interpretation and validation. Considering the frequent association of cardiomyopathy and atrial fibrillation, a future application of this successful classification process is the inclusion of the results in an automatic prediction algorithm for atrial fibrillation (AF). AF is a threatening arrhythmia that is encountered in 25% of post-cardiovascular surgical patients in the CVICU of the Cleveland Clinic.
Cardiomyopathy diagnosis will be performed by a multivariate, neuro-fuzzy classification model that uses P wave parameters to generate a cardiomyopathy classification index. Artificial Neural Networks are universal approximators (Buckley, Hayashi, 1995), and there has also been extensive work to prove that neuro-fuzzy systems can approximate any continuous function to any desired degree of accuracy (Feuring, Lippe, 1999). Alvisi et al. (Alvisi et al., 2006) have studied the performances of fuzzy logic and Artificial Neural Networks, revealing the weaknesses and strengths of each of the methods. The strengths can be emphasized, and some of the weaknesses can be attenuated, by combining the techniques into a hybrid neuro-fuzzy model. The universal approximation theorem is the reason that a neuro-fuzzy system may be able to overcome the limitations of previous statistics-based methods for ECG analysis.
Neuro-fuzzy networks
Consider a multi-input, single-output fuzzy logic system. Our discussion can be easily generalized to multiple output systems, but restricting our discussion to single-output systems simplifies the notation considerably. In addition, the ECG classification system that we consider in this paper is single-output. The ith rule R of the fuzzy system can be written as follows (Chen, Linkens, 2001).
The inputs Xi and the output![]() are linguistic variables,
are linguistic variables,![]() are fuzzy sets, and
are fuzzy sets, and![]() is a function of the input
is a function of the input![]() The output function
The output function![]() typically takes one of the following forms: (1) singleton, (2) fuzzy set, (3) linear function. If the fuzzy system uses center average defuzzification, product inference, and singleton fuzzification, then
typically takes one of the following forms: (1) singleton, (2) fuzzy set, (3) linear function. If the fuzzy system uses center average defuzzification, product inference, and singleton fuzzification, then![]() (a singleton) and the fuzzy system output can be written as
(a singleton) and the fuzzy system output can be written as
where denotes the degree of membership of
![]() As in many neuro-fuzzy networks, we use a Gaussian form for
As in many neuro-fuzzy networks, we use a Gaussian form for![]()

where![]() is the jth element of the center of the ith rule, and
is the jth element of the center of the ith rule, and![]() is its standard deviation. In this case, Eq. (2) becomes
is its standard deviation. In this case, Eq. (2) becomes
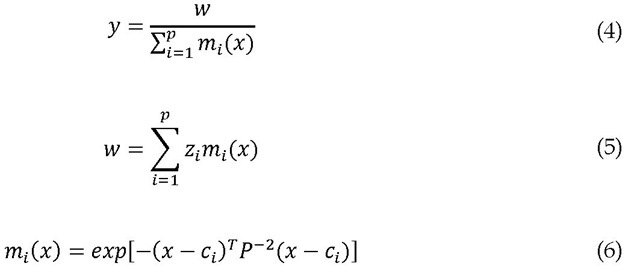
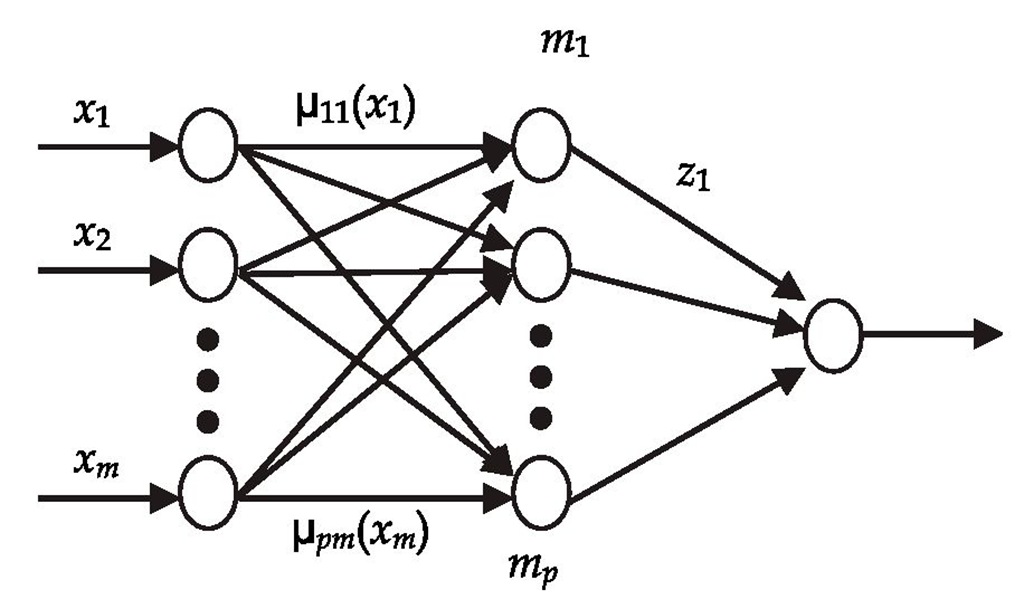
where![]() is in the form of a radial basis function, which is a type of neural network (Chen, Linkens, 2001). The system of Eqs. (5) and (6) is therefore called a neuro-fuzzy system. It can be depicted as shown in Figure 1.
is in the form of a radial basis function, which is a type of neural network (Chen, Linkens, 2001). The system of Eqs. (5) and (6) is therefore called a neuro-fuzzy system. It can be depicted as shown in Figure 1.
Fig. 1. Multi-input single-output neuro-fuzzy system architecture
The neuro-fuzzy system in Figure 1 is a function of the pxm elements of the membership centers cij, the pxm elements of the membership standard deviations aij, and the p elements of the singleton outputs zi. There are thus p(2m+1) parameters that define the neuro-fuzzy system. For a given neuro-fuzzy system architecture and a given training set of input/output data, the neuro-fuzzy system parameters can be optimized with respect to these p(2m+1) parameters.
Biogeography-Based Optimization (BBO)
Biogeography-based optimization (BBO) is a recently-developed population-based evolutionary optimization algorithm (Simon, 2008). As its name implies, BBO is motivated by biogeography, which is the study of the distribution of species over time and space (Whittaker, 1998). BBO has demonstrated good performance on various benchmark functions (Lomolino, Riddle, & Brown, 2009; Simon, 2008). It has also been successfully applied to several real-world optimization problems, including sensor selection (Simon, 2008), power system optimization (Rarick et al., 2009), groundwater detection (Kundra, Kaur, & Panchal, 2009), and satellite image classification (Panchal et al., 2009).
Given an optimization problem and a population of candidate solutions (individuals), a biogeography-based optimization (BBO) solution with high fitness is likely to share its features with other solutions, and a solution with low fitness is unlikely to share its features. Conversely, a solution with high fitness is unlikely to accept features from other solutions, while a solution low fitness is likely to accept features. Solution feature sharing, which is called immigration and emigration, tends to improve the solutions and thus evolve a good solution to the problem.
In biogeography-based optimization (BBO), each individual solution has its own immigration rate X and emigration rate |i. A good solution has relatively high | and low X, while the converse is true for a poor solution. The immigration rate and the emigration rate are functions of the fitness of the solution. They are often calculated as
where n is the population size and![]() is the fitness rank of the ith individual (the most fit individual has a rank
is the fitness rank of the ith individual (the most fit individual has a rank![]() The immigration rates
The immigration rates![]() are interpreted by the BBO algorithm as immigration probabilities. The emigration rates
are interpreted by the BBO algorithm as immigration probabilities. The emigration rates![]() are proportional to fitness and so are used in a roulette-wheel type of algorithm to determine the emigrating solution in case immigration is selected for a solution.
are proportional to fitness and so are used in a roulette-wheel type of algorithm to determine the emigrating solution in case immigration is selected for a solution.
Although the migration rates in Eq. (1) are linear with respect to fitness rank as originally proposed in earlier study (Simon, 2008), more natural migration rates which are sigmoid with respect to fitness rank generally seem to give better optimization performance (Lomolino, Riddle, & Brown, 2009). However, in this paper we retain the original linear migration rates for the simplicity reason.
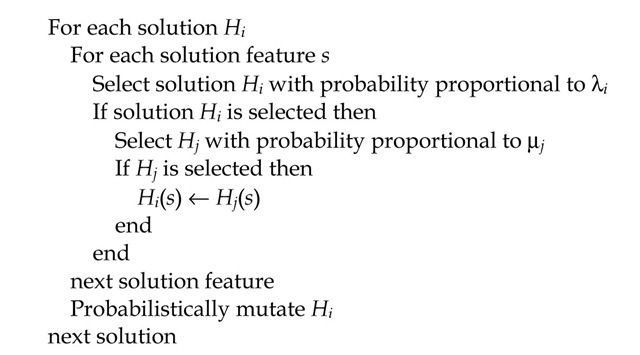
As with other evolutionary algorithms, mutation is typically implemented to increase exploration, and elitism is often implemented to retain highly fit solutions. The standard BBO algorithm is shown in Figure 2.
Fig. 2. One generation of the standard BBO algorithm.


