Widely used metrics that describe the shape of a feature are the aspect ratio, the compactness, and the irregularity. All three metrics use the boundary points. Let us assume that a shape has K boundary points and define the distance of the kth boundary point at an angle 9 from the x-axis as rk(9):
where the associated angle 9 follows
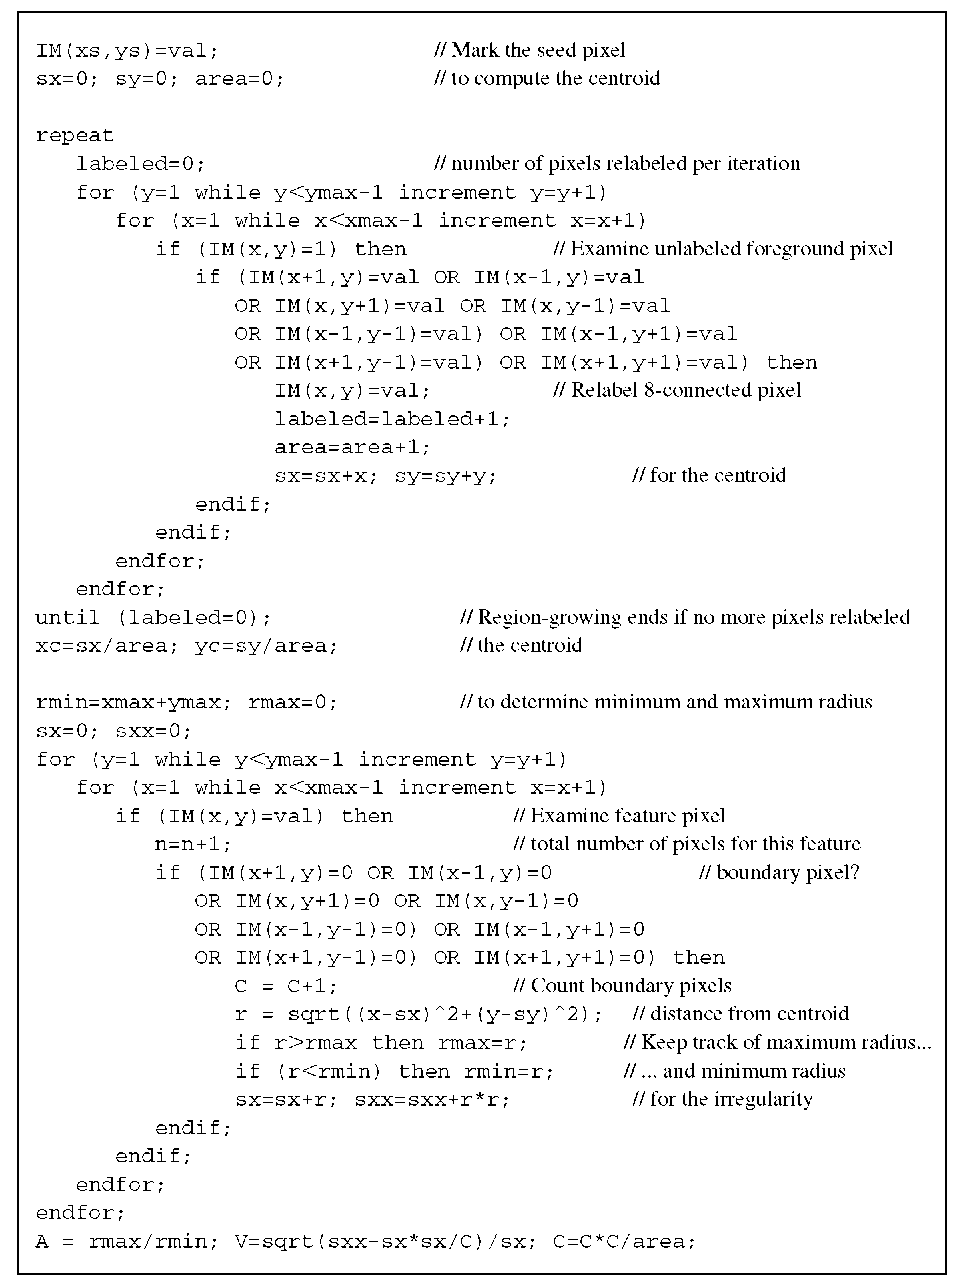
Algorithm 9.1 Cluster region growing. This algorithm fills a contiguous region in the input image IM(x,y) with the value val. The seed points is given by xs and ys and must be part of the feature. The input image is assumed to be strictly binary, with values of 0 for background and 1 for the features. At the end of this algorithm, one cluster has been relabeled to val, and the variables A, C, and V contain the shape descriptors of aspect ratio, compactness, and irregularity, respectively.
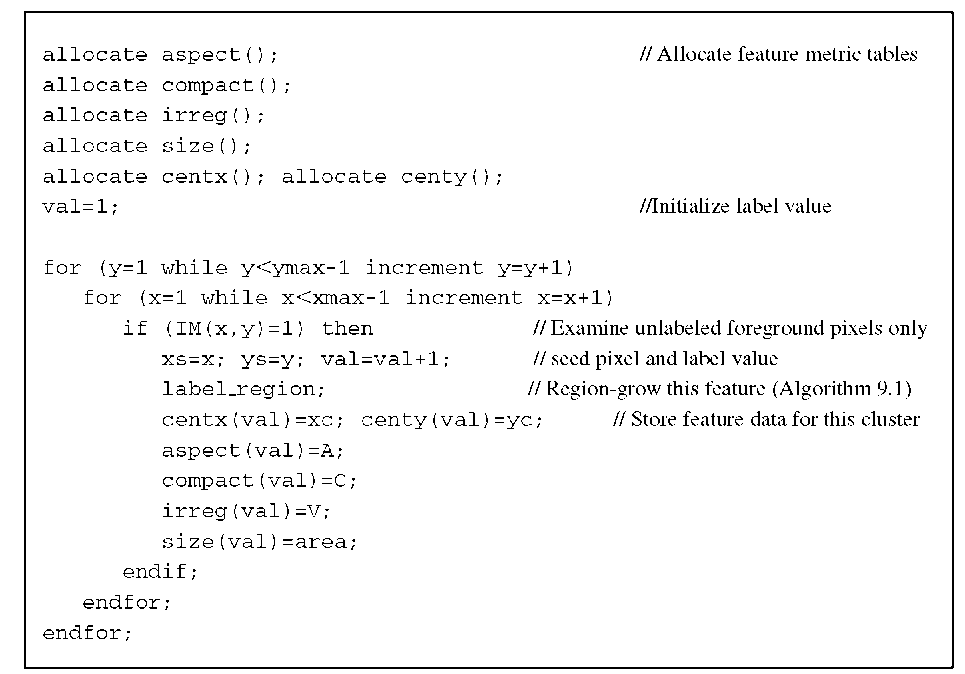
Algorithm 9.2 Cluster labeling. This algorithm builds on Algorithm 9.1, here referred to as label_region, to relabel contiguous areas. The input image IM(x,y) of size xmax and ymax is assumed to be strictly binary. In the process of labeling the clusters, tables are generated that contain centroid and shape information. At the end of this algorithm, each contiguous region (i.e., feature) is labeled with the same pixel value. At the end of this algorithm, each feature has a unique pixel value.
This representation allows us to unroll the perimeter and convert it into a one-dimensional function r(^) or, alternatively, into a sequence rk, 0 < r < K. An example is given in Figure 9.4, where the segmented shape (Figure 9.4A) was unrolled beginning at its topmost point and turning counterclockwise. The unrolled perimeter is shown in Figure 9.4C.
The aspect ratio A is defined as the ratio of the radii of the circumscribed to the inscribed circle, which corresponds to the ratio of the largest to the smallest rk:
The aspect ratio quantifies the eccentricity of a shape. A circle has an aspect ratio of 1. If the shape is more oval or elliptical, or has protrusions, A increases. The aspect ratio is translation-, rotation-, and scaling-invariant within the limits of the discrete pixel resolution of the image. Since A is based on only two salient points, the maximum and the minimum of the sequence of rk, the aspect ratio does not provide detailed information about the shape. The teardrop-shaped red blood cell and the sickle cell may have the same aspect ratio, yet they belong to two fundamentally different shape classes.
FIGURE 9.4 Sample cluster to illustrate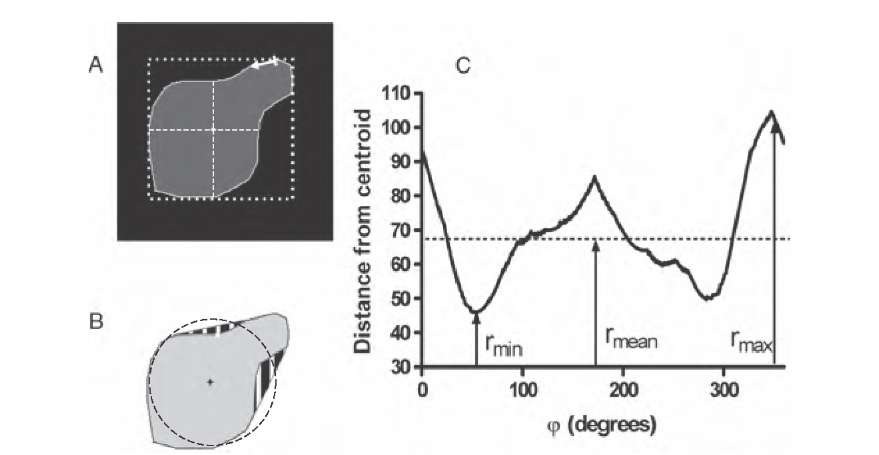 some spatial-domain shape metrics. The cluster is shown in part A after a typical segmentation process with zero-valued background (black) and highlighted perimeter (white). The thick dashed line indicates the bounding box, and the diagonal dashed lines are the long and short axes of an ellipse that approximates the feature. The centroid is indicated at the intersection of the long and short axes. In part B, a circle with radius rmean is displayed. The circle has four intersections with the shape. Furthermore, concave regions have been filled (striped regions) to obtain the convex hull. Part C shows the unrolled radius, with the minimum, mean, and maximum distance of the perimeter from the centroid.
The compactness C of a shape is defined as the squared perimeter length normalized by the area and can be approximated by
where N is the number of pixels that belong to the feature (i.e., the area), xk and yk are the pixel coordinates of the boundary points, and xK = x0, yK = y0 to provide a closed contour. The most compact shape possible is the circle with a theoretical value of C = 4^ « 12.6. Since C cannot be smaller than approximately 12.6 under the definition of Equation (9.4), different definitions of compactness can be found, for example,
This alternative value is normalized to 1 for an ideal circular shape and, being the inverse of the definition in Equation (9.4), tends toward zero for irregular shapes. Due to the discrete nature of images, small circles can deviate from the theoretical value. The compactness is a metric of the deviation from a circular shape, and C [as defined in Equation (9.4)] increases both with eccentricity of the shape and with the irregularity of its outline. In other words, values of C may overlap between highly elliptical shapes with a regular outline and round shapes with an irregular outline. The irregularity of the outline can better be quantified by the coefficient of variation V of the rk, which can be efficiently approximated with
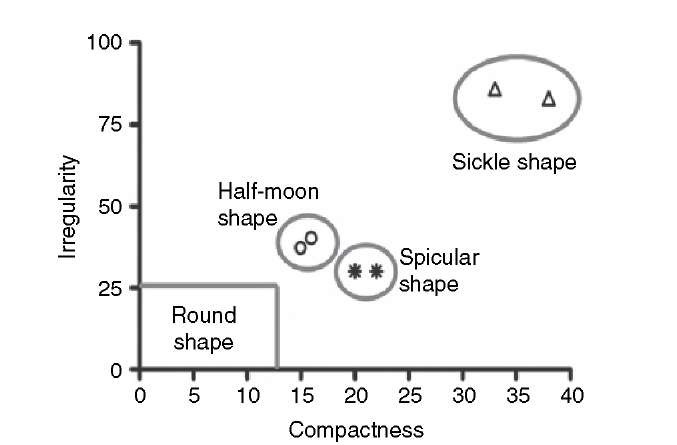
Aspect ratio, compactness, and irregularity are shape metrics that are rotation-, scale-, and translation-invariant within the limits of pixel discretization. Each of the metrics, however, can assume similar values for different shapes as demonstrated, for example, in Figure 9.1, where the half-moon and the spicular cells have approximately the same value for irregularity. A multidimensional feature vector may be used to better separate groups of features with a similar shape. An example is given in Figure 9.5, where a two-dimensional feature vector is composed for each shape with the irregularity and compactness as elements. All normal (round) red blood cells can be found inside the box at the lower left corner with C < 13 and V < 26. The distance between the cluster centers of the spicularly shaped and half-moon-shaped cells has been increased in two-dimensional space. Assignment of individual shapes to feature classes may be performed automatically by clustering methods such as k-means clustering and fuzzy c-means clustering (Section 2.5).
From the ordered set of boundary points r(^), additional shape descriptors can be derived, but they are to some extent related to compactness, aspect ratio, and irregularity. By fitting an ellipse function into the boundary, the orthogonal long and short axes can be determined (Figure 9.4A), and the ratio is referred to as the elongation.
FIGURE 9.5 Separation of features with different shapes by combining two metrics, irregularity and compactness.
With the same axes, the bounding rectangle can be defined and the extent of the shape, that is, the ratio of shape area to the area of the bounding rectangle can be determined. The bounding rectangle for this shape metric is aligned with the major and minor axes in Figure 9.4A and does not normally coincide with the bounding box shown in Figure 9.4A. Once the average radius is known, the number of zero crossings of r(9) and the area ratio parameter can be computed. The number of zero crossings is the number of times the shape crosses a circle with radius rmean and with the same centroid as the shape (Figure 9.4B). This metric is related to the irregularity. The area ratio parameter (ARP) is defined as
where the operation |_aj indicates a threshold at zero, that is, a for a > 0 and 0 for a < 0. A higher value for p causes the area ratio parameter to more strongly emphasize spicular outliers.
A number of descriptors are based on the convex hull of the shape. One method of obtaining the convex hull involves probing the shape in a direction tangential to the edge from every boundary pixel. If a straight line that starts at a boundary pixel tangential to the edge intersects the shape elsewhere, this line bridges a concavity. Two such lines are shown in Figure 9.4B, and the difference between the original shape and the convex shape is highlighted. The convexity metric is the ratio of the convex hull length to the actual perimeter length, and the solidity is the ratio of the shape area to the convex area. A metric known as Feret’s diameter, defined as the square root of the area multiplied by 4/^, is sometimes used,22 but neither this metric nor the perimeter/area ratio11 is scale-invariant. Although these metrics seem to aid in the diagnosis of—in these examples—microvascular shape and malignancy of melanocytic skin lesions, the question of whether size plays a more important role than shape arises immediately. In other publications,6,24 Feret’s minimum and maximum diameters are defined as the minimum and maximum distance of two parallel tangents to the shape outline. Again, this metric is not scale-invariant.
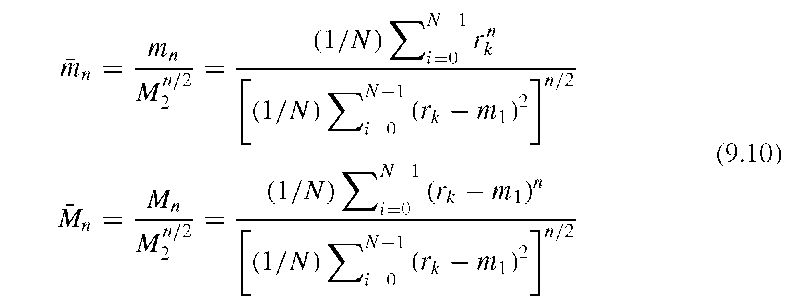
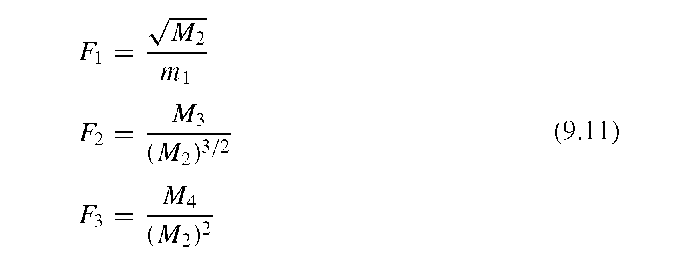
Gupta and Srinath14 suggested using statistical moments of shape boundaries. Under the definition of the unrolled perimeter rk, the nth boundary moment mn is defined by and the nth central moment is defined by (n > 1)
The moments mn and Mn are not scale-invariant. To obtain scale-invariant descriptors, the normalized moments mn and the normalized central moments Mn are defined through
Finally, Gupta and Srinath14 formulated a feature vector with the scale-, translation-, and rotation-invariant elements F1, F2, and F3, computed from the four lowest-order moments:


